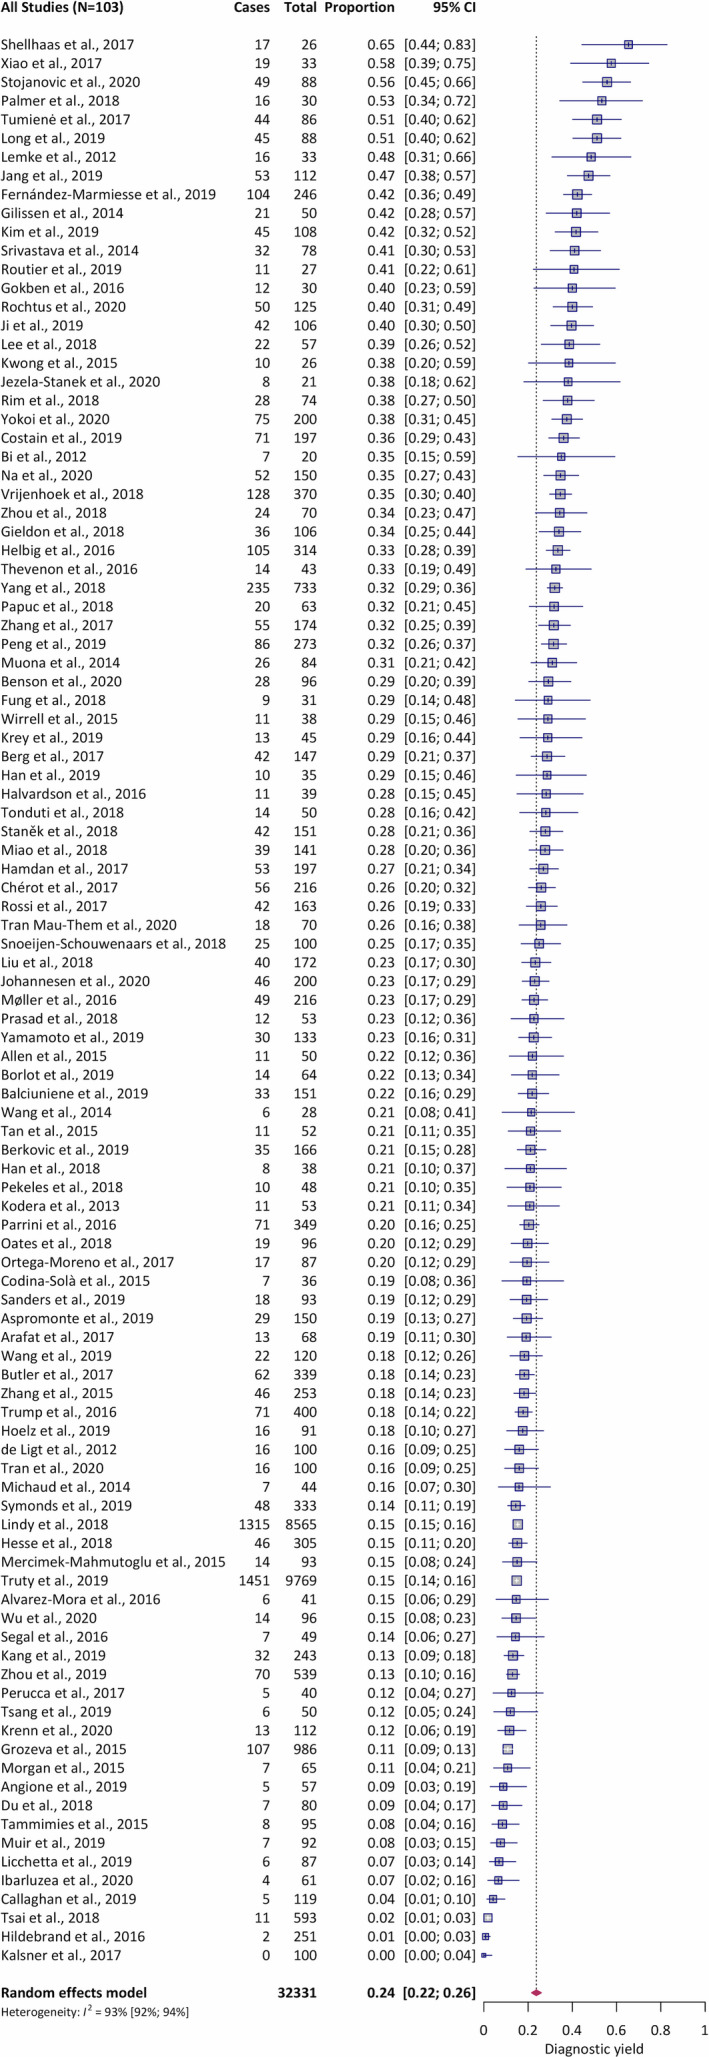
Figure 3.

Forest plot of meta‐analysis of the overall diagnostic yield from 103 studies. Abbreviations: CI, confidence interval; I2, estimated proportion of the variance in study estimates that is due to heterogeneity; Proportion, fraction of individuals with a positive genetic test (ie, pathogenic or likely pathogenic variant)
