

Abstract
Aim
To investigate the association of different categories of baseline cardio‐metabolic risk factors on the treatment effects of empagliflozin 10 and 25 mg when added as second‐line therapy to metformin in patients with type 2 diabetes (T2D).
Materials and Methods
Patients aged 18 years or older with HbA1c 7.0%‐10.0% were included. Analysis of covariance compared change from baseline to weeks 24 and 76 in HbA1c, body weight (BW) and systolic blood pressure (SBP) by respective baseline categories (HbA1c <8.5/≥8.5%; BW <80/80‐90/>90 kg, SBP <130/130‐140/>140 mmHg). Analyses were also conducted with a model using continuous covariates of cardio‐metabolic factors.
Results
In total, 637 patients (56.7% males; mean [SD] age 55.7 [9.9] years, HbA1c 7.9% [0.9%], BW 81.2 [18.8] kg, SBP 129.4 [14.6] mmHg) received one or more dose of either empagliflozin 10 mg (n = 217) or 25 mg (n = 213), or placebo (n = 207). At both time points, empagliflozin 10/25 mg versus placebo significantly (P < .0001) reduced HbA1c and BW, with greater reductions in HbA1c at higher baseline HbA1c (P interaction week 24/76 categorical and continuous models: .0290/.1431 and .0004/.0042, respectively) and in BW (P interaction .1340/.0012 and .0202/<.0001, respectively). Both empagliflozin doses also significantly lowered SBP versus placebo at both time points, with similar efficacy by subgroups of baseline SBP. Adverse events were consistent with the established empagliflozin safety profile across treatment groups.
Conclusions
Empagliflozin, as add‐on to metformin, decreases HbA1c and BW, particularly in patients with higher HbA1c and BW baseline values, and effectively lowers SBP.
Keywords: body weight, empagliflozin, glycaemic control, metformin, SGLT2 inhibitor, type 2 diabetes
1. INTRODUCTION
Cardiovascular (CV) outcome trials in individuals with type 2 diabetes (T2D) have shown that sodium‐glucose co‐transporter‐2 (SGLT2) inhibitors improve CV and heart failure (HF) outcomes and progression of kidney disease in those with established CV disease as well as those at high CV or renal risk. 1 , 2 , 3 Given that glucagon‐like peptide‐1 receptor agonists (GLP‐1 RAs) have also been shown to improve CV outcomes, there are now two classes of glucose‐lowering drugs for T2D with clear benefits in improving clinical CV outcomes in T2D. 4 , 5 Consequently, both GLP‐1 RAs and SGLT2 inhibitors are now recommended as preferred therapies by the American Diabetes Association and the European Association for the Study of Diabetes for patients with T2D and co‐existing CV disease and/or chronic kidney disease (CKD). 6 , 7
Despite advances in our understanding and evidence‐based effects of various medications, in particular on CV and HF outcomes, 8 a significant proportion of patients with T2D remain poorly controlled (e.g. glycaemic, body weight and blood pressure targets), with large proportions not meeting treatment targets as recommended by professional societies. 9 , 10 , 11 Individualization of therapy is now a widely recommended strategy in the management of patients with T2D. A better understanding of the clinical efficacy of specific glucose‐lowering drugs across phenotypical characteristics of key cardio‐metabolic factors will help clinicians to better tailor therapy, while potentially helping patients achieve their treatment goals. This is particularly important when discussing the efficacy of different glucose‐lowering drugs as second‐line therapy to metformin, also in the context of the need to take patient preferences into account when selecting therapy 12 , 13 and the treatment inertia that often occurs during T2D management. 14
Empagliflozin is a potent and selective inhibitor of SGLT2. 15 Its mechanism of action causes a reduction in renal glucose reabsorption, resulting in increased urinary glucose excretion with a corresponding decrease in plasma glucose. 16 In clinical trials, treatment with empagliflozin as monotherapy or as add‐on to metformin resulted in reductions in HbA1c, body weight and systolic blood pressure (SBP) after 12 weeks, 17 , 18 with the effects sustained for up to 90 weeks. 19 Continued effects on these variables were also observed over a median of 3.1 years in the EMPA‐REG OUTCOME trial. 1
The 24‐week EMPA‐REG MET trial, and its 52‐week extension study, previously reported that, compared with placebo, empagliflozin, as an add‐on to metformin therapy, significantly improved glycaemic control, body weight and SBP from baseline to weeks 24 and 76 in patients with inadequately controlled T2D. 20 , 21 The aim of the current study was to investigate the association of different categories of baseline cardio‐metabolic risk factors on the treatment effects of empagliflozin 10 and 25 mg when added as second‐line therapy to metformin, the most commonly used medication for managing T2D. Our hypothesis was that empagliflozin, like other diabetes drugs, 22 would be associated with greater absolute treatment benefits with a higher baseline risk factor.
2. MATERIALS AND METHODS
2.1. Study design and patients
The design and methods of the EMPA‐REG MET trial have been described previously. 20 , 21 Briefly, adults with T2D and insufficient glycaemic control (HbA1c ≥7.0% to ≤10.0%), despite a recommended diet and exercise programme, and on stable (unchanged for ≥12 weeks before randomization) immediate‐release metformin (≥1500 mg/day), were randomized (1:1:1) to receive either empagliflozin 10 mg, empagliflozin 25 mg or placebo once‐daily. Patients who completed 24 weeks of treatment in the initial trial and did not meet any of the exclusion criteria or develop any contraindications to metformin (according to the local label), could choose to continue the same treatment double‐blind for an additional 52 weeks or longer (a total of 76 weeks) in the extension trial.
2.2. Endpoints and safety analysis
The primary efficacy endpoint for the EMPA‐REG MET study was the change from baseline in HbA1c level after 24 weeks. Secondary efficacy endpoints in EMPA‐REG MET and the extension trial were the change from baseline in HbA1c after 76 weeks, and the change from baseline to weeks 24 and 76 in body weight and SBP.
Safety, including hypoglycaemia, was assessed via the reporting of all adverse events (AEs; preferred terms were coded according to the Medical Dictionary for Drug Regulatory Activities [MedDRA] version 14.1), with an onset after the first dose of study medication up to a period of 7 days after the last dose. AEs are presented for the treated set, which comprised all patients who were treated with one or more dose of study medication. AEs of special interest were events consistent with urinary tract infection (UTI) and genital infection (identified using prospectively defined search categories based on 67 and 87 MedDRA‐preferred terms, respectively).
Confirmed hypoglycaemic AEs were defined as hypoglycaemic AEs with plasma glucose 3.9 mmol/L or less and/or requiring assistance.
2.3. Statistical analysis
Efficacy analyses were performed on the full analysis set, which comprised all randomized patients treated with one or more dose of study medication who had a baseline HbA1c measurement. Missing data were imputed using the last observation carried forward approach.
The magnitude of the effects of empagliflozin 10 and 25 mg by baseline characteristics was explored for the following baseline subgroup categories: HbA1c: <8.5% and ≥8.5%; body weight: <80, 80‐90 and >90 kg; body mass index (BMI): <25, 25 to <30, 30 to <35 and ≥35 kg/m2; and SBP: <130, 130‐140 and >140 mmHg.
An analysis of covariance (ANCOVA) was used to analyse the change from baseline to weeks 24 and 76 in HbA1c, body weight and SBP by subgroups of the four baseline metabolic efficacy variables (SBP, HbA1c, body weight and BMI) for the empagliflozin 10 mg, empagliflozin 25 mg and placebo groups. The ANCOVA model was performed with baseline HbA1c as a linear covariate, and fixed effects for baseline estimated glomerular filtration rate (eGFR), geographical region, treatment, the baseline of the efficacy variable of interest, and interaction of treatment with the baseline of the efficacy variable of interest. For the analysis of change from baseline in HbA1c, the linear covariate of baseline HbA1c was excluded from the model because of the addition of the categorical variable of HbA1c at baseline. The change from baseline in body weight by BMI at baseline was analysed using baseline BMI as a fixed effect instead of baseline body weight. Analyses of the efficacy variables of interest were repeated using the baseline of each efficacy variable as a continuous covariate in the model instead of as a categorical covariate.
3. RESULTS
3.1. Participant characteristics
A total of 637 patients were randomized and received one or more doses of either empagliflozin 10 mg (n = 217), empagliflozin 25 mg (n = 213) or placebo (n = 207). The demographics and clinical characteristics within subgroups of categories of baseline HbA1c, body weight and SBP were comparable across treatment groups (Tables S1–S3).
3.2. Efficacy variables as categorical variables
3.2.1. Effects on glycaemia
Compared with placebo, empagliflozin significantly reduced HbA1c, body weight and SBP in the overall population, both in the short (24 weeks) and long term (76 weeks) (Table S4, Figures S1 and S2).
At week 24, the adjusted mean (SE) difference from baseline in HbA1c with empagliflozin 10 and 25 mg versus placebo was greater in those with baseline HbA1c 8.5% or higher (empagliflozin 10 vs. placebo: −0.73% [0.14%], empagliflozin 25 vs. placebo: −0.97% [0.15%], respectively) than with baseline HbA1c of less than 8.5% (empagliflozin 10 vs. placebo: −0.51% [0.08%], empagliflozin 25 vs. placebo: −0.52% [0.08%], respectively) (interaction P‐value = .0290; Figure 1A). Similarly, at week 76, the corresponding difference from baseline with empagliflozin 10 and 25 mg versus placebo was greater with baseline HbA1c 8.5% or higher (empagliflozin 10 vs. placebo: −0.78% [0.15%], empagliflozin 25 vs. placebo: −0.99% [0.16%], respectively) than for baseline HbA1c less than 8.5% (empagliflozin 10 vs. placebo: −0.55% [0.09%], empagliflozin 25 vs. placebo: −0.64% [0.09%], respectively) (interaction P‐value = .1431; Figure 2A).
FIGURE 1.
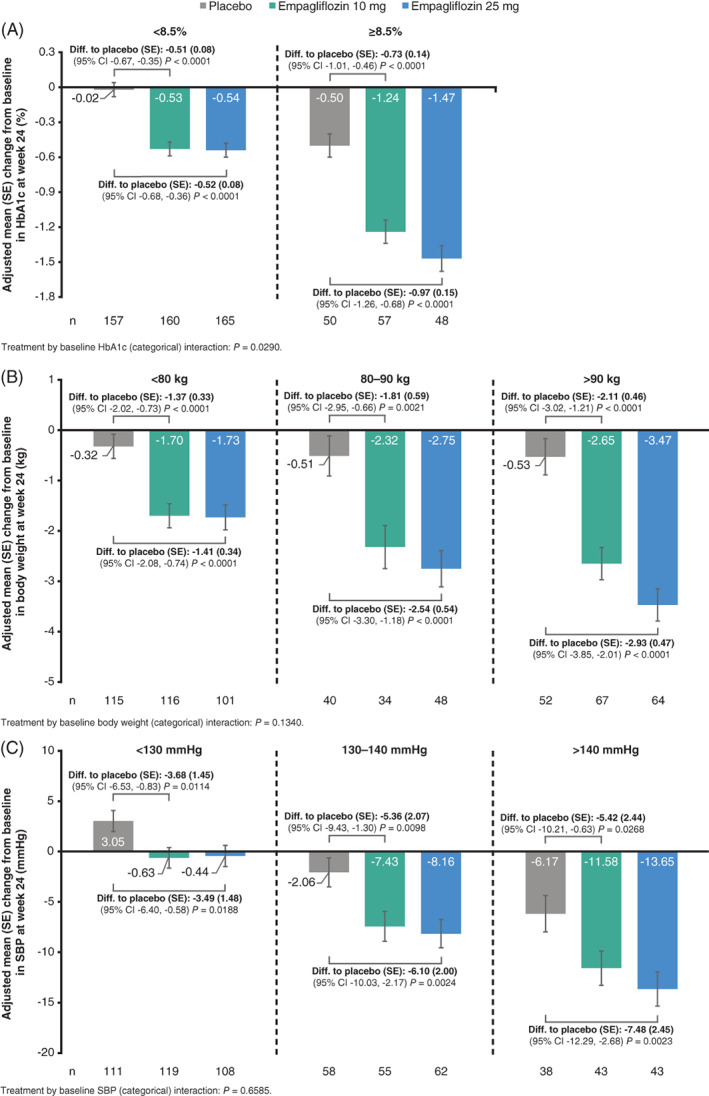
The change from baseline at week 24 in subgroups of A, HbA1c, B, body weight, and C, SBP by baseline categories (FAS [LOCF]) from the ANCOVA model. CI, confidence interval; diff., difference; FAS, full analysis set; LOCF, last observation carried forward; SBP, systolic blood pressure; SE, standard error
FIGURE 2.
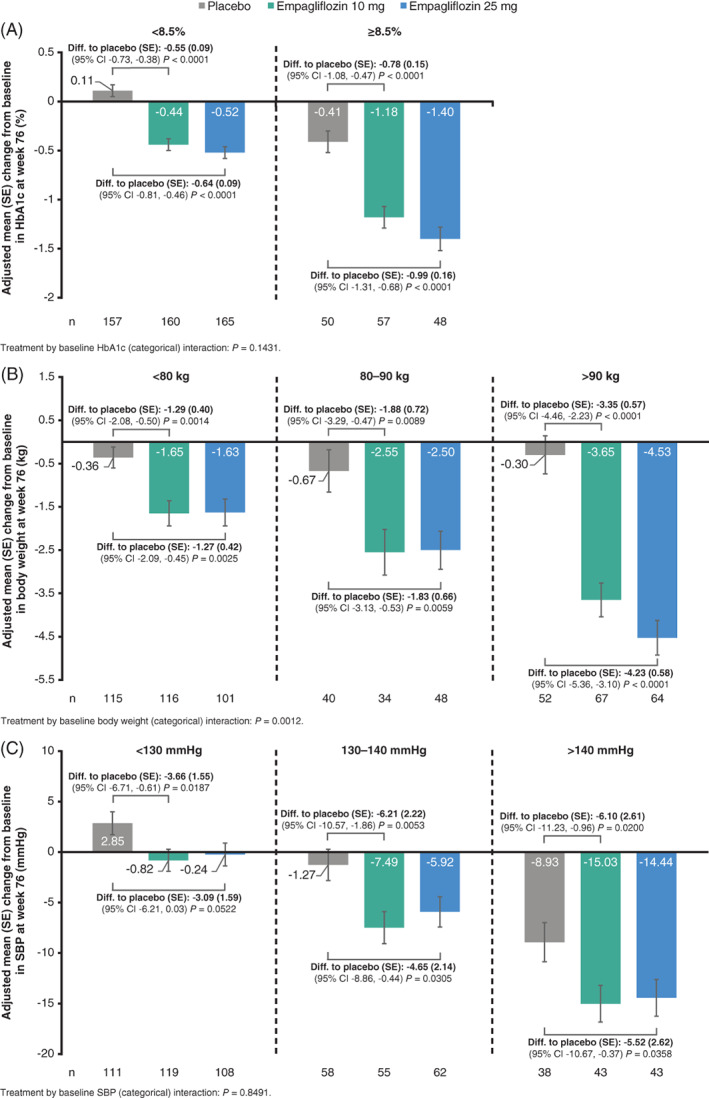
The change from baseline at week 76 in subgroups of A, HbA1c, B, body weight, and C, SBP by baseline categories (FAS [LOCF]) from ANCOVA model. CI, confidence interval; diff., difference; FAS, full analysis set; LOCF, last observation carried forward; SBP, systolic blood pressure; SE, standard error
3.2.2. Effects on body weight and SBP
Reduction in body weight with empagliflozin versus placebo was also greater in patients with higher baseline body weight. At week 24, the adjusted mean (SE) difference from baseline was greatest with baseline body weight greater than 90 kg (empagliflozin 10 vs. placebo: −2.11 [0.46] kg, empagliflozin 25 vs. placebo: −2.93 [0.47] kg, respectively), less with baseline body weight 80‐90 kg (empagliflozin 10 vs. placebo: −1.81 [0.59] kg, empagliflozin 25 vs. placebo: −2.54 [0.54] kg, respectively) and least at baseline body weight less than 80 kg (empagliflozin 10 vs. placebo: −1.37 [0.33] kg, empagliflozin 25 vs. placebo: −1.41 [0.34] kg, respectively) (interaction P‐value = .1340; Figure 1B). At week 76, the corresponding difference in body weight was greatest at baseline body weight < 90 kg (empagliflozin 10 vs. placebo: −3.35 [0.57] kg, empagliflozin 25 vs. placebo: −4.23 [0.58] kg, respectively), less at baseline body weight 80‐90 kg (empagliflozin 10 vs. placebo: −1.88 [0.72] kg, empagliflozin 25 vs. placebo: −1.83 [0.66] kg, respectively) and least at baseline body weight less than 80 kg (empagliflozin 10 vs. placebo: −1.29 [0.40] kg, empagliflozin 25 vs. placebo: −1.27 [0.42] kg, respectively) (interaction P‐value = .0012; Figure 2B).
The same pattern was also observed for body weight reduction by baseline BMI, with empagliflozin causing a greater placebo‐corrected reduction in body weight in patients with higher BMI at baseline (≥35 vs. 30 to <35 vs. 25 to <30 vs. <25 kg/m2), although a significant interaction was only observed at week 76 (interaction P‐value, week 24 = .3099; interaction P‐value, week 76 = .0031; Figures S3A and B, respectively).
Empagliflozin also significantly lowered SBP versus placebo at weeks 24 and 76 (P < .05; Figures 1C and 2C, respectively), but in contrast to HbA1c and body weight, without significant differences across SBP subgroups at baseline (interaction P‐value > .66).
3.3. Efficacy variables as continuous variables
3.3.1. Effects on glycaemia
Analysing change from baseline in HbA1c by HbA1c as a continuous variable showed a significant greater reduction with higher baseline HbA1c at both weeks 24 and 76 (treatment by baseline HbA1c [linear] interaction: P = .0004 and P = .0042, respectively; Figures 3A and 4A).
FIGURE 3.
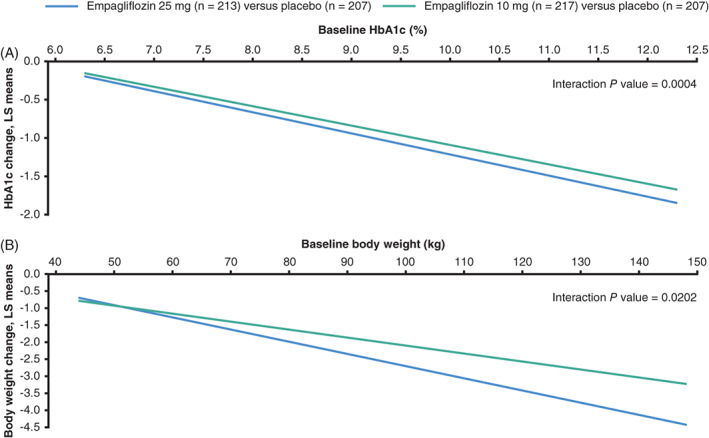
Placebo‐adjusted ANCOVA regression lines for the change from baseline to week 24 by A, HbA1c, and B, body weight at baseline considering treatment by baseline factor interactions (FAS [LOCF]). The ANCOVA model included baseline eGFR, geographical region and treatment as fixed effects, and the baseline efficacy variable of interest by treatment interaction and A, baseline HbA1c as a linear covariate or B, baseline weight and baseline HbA1c as linear covariates. ANCOVA, analysis of covariance; eGFR, estimated glomerular filtration rate; FAS, full analysis set; LOCF, last observation carried forward; LS, least squares
FIGURE 4.
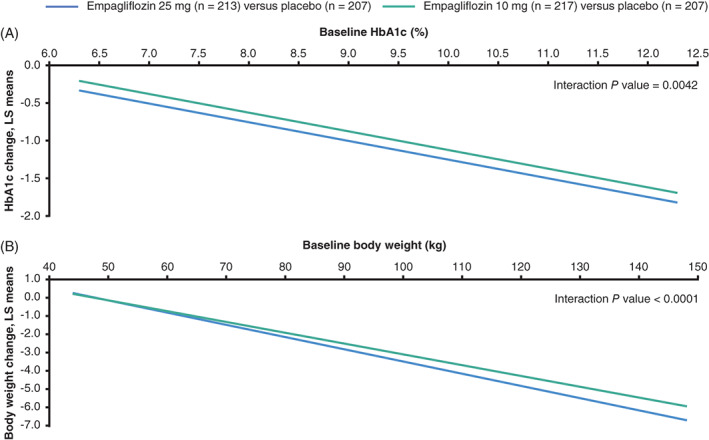
Placebo‐adjusted ANCOVA regression lines for the change from baseline to week 76 by A, HbA1c, and B, body weight at baseline considering treatment by baseline factor interactions (FAS [LOCF]). The ANCOVA model included baseline eGFR, geographical region and treatment as fixed effects, and the baseline efficacy variable of interest by treatment interaction and A, baseline HbA1c as a linear covariate or B, baseline weight and baseline HbA1c as linear covariates. ANCOVA, analysis of covariance; eGFR, estimated glomerular filtration rate; FAS, full analysis set; LOCF, last observation carried forward; LS, least squares
3.3.2. Effects on body weight and SBP
The same was true for body weight change at both time points. Change from baseline in weight was higher with higher baseline weight at both weeks 24 and 76 (treatment by baseline weight [linear] interaction P = .0202 and P < .0001, respectively; Figures 3B and 4B), although not for SBP at either time point (P = .7792 and P = .5750, respectively).
3.4. Safety
AE profiles were consistent with the overall AE profile for empagliflozin, 23 regardless of baseline values for HbA1c, body weight or SBP (Tables S5–S7). This includes events consistent with UTI (within each baseline category of each efficacy variable, UTI events were reported with a similar frequency in the empagliflozin vs. placebo arms) and events consistent with genital infection (within each baseline category of each efficacy variable, genital infections were reported with a higher frequency in the empagliflozin 10 and 25 mg groups vs. placebo arms). There were no cases of ketoacidosis in either group. Rates of hypoglycaemia were not increased with empagliflozin versus placebo overall, and there were too few events to analyse hypoglycaemia by categories of baseline variables (overall, eight confirmed hypoglycaemic events and no severe hypoglycaemic events [defined as episode requiring assistance] by week 24, and 25 confirmed hypoglycaemic events [one of them severe] by week 76, respectively).
4. DISCUSSION
We observed significant reductions for all variables with empagliflozin versus placebo when given as second‐line therapy after metformin, with significantly greater reductions in HbA1c and body weight, but not SBP, in those patients with higher baseline values of these respective variables. For both HbA1c and body weight, these greater reductions with empagliflozin versus placebo at higher baseline values were seen when analysed as a categorical variable and also as a continuous variable, at weeks 24 and 76. For example, placebo‐corrected HbA1c reductions with higher dose empagliflozin approached 1% when baseline HbA1c was ~9%, whereas it was 0.5% when baseline HbA1c values were ~7.5%.
Although previous reports from the EMPA‐REG OUTCOME trial have reported consistent CV and HF benefits, regardless of the magnitude of reduction in HbA1c with empagliflozin, 24 a better understanding of the clinical efficacy of glucose‐lowering drugs across the spectrum of cardio‐metabolic characteristics may help to better individualize therapy. 12 , 13 These are therefore important data to consider when choosing add‐on therapy to metformin for patients with specific glycaemic or weight considerations.
The results for weight reduction are in line with previous reports on the effects of empagliflozin on weight and indices of fat mass by baseline levels. 25 Weight considerations concerning medications to treat T2D are important to consider. 26 In contrast to the findings reported in this study, certain widely used glucose‐lowering medications, particularly insulin, insulin secretagogues and the less frequently used class of thiazolidinediones, are often associated with weight gain. 27 , 28 , 29 Whether this iatrogenic increased weight carries a potential long‐term deleterious effect 27 , 30 , 31 is unknown. However, weight gain is an important patient‐centred aspect of care, because the majority of patients with T2D are overweight or obese. For example, in the United States, more than 85% of patients with T2D have a BMI of higher than 25 kg/m2, with more than 50% of patients having a BMI of higher than 30 kg/m2. 32 Furthermore, studies have also shown that even modest weight reductions (e.g. 2‐3 kg) can improve a person's treatment satisfaction and weight‐related quality of life. 33 In the current study, in the highest BMI category of 35 kg/m2 or higher, the adjusted mean change from baseline in body weight at 76 weeks was −4.77 kg in the empagliflozin 25 mg group, meaning that even in the heaviest group of patients, a reduction in weight of ~4‐5 kg is achievable over time.
The observation of similar reductions in SBP by categories of baseline SBP in this study is in contrast to a previous analysis of the effects of empagliflozin on blood pressure. 34 In the previous pooled analysis, involving four 24‐week phase III trials and 2477 patients (empagliflozin: n = 1652; placebo: n = 825), significantly greater reductions were observed for SBP in those with SBP higher than 140 mmHg at baseline (−6.3 [−8.4, −4.2] mmHg) versus SBP 130‐140 mmHg (−4.0 [−5.9, −2.1] mmHg) and versus SBP less than 130 mmHg (−2.6 [−3.9, −1.3] mmHg), with a P‐value for interaction of .013. The discrepancy between the findings in the previous and current studies could be related to differences in the populations, in the background antihypertensive or glucose‐lowering therapy used, or in the technical aspects of measuring SBP. The population size in the previous pooled analysis was ~4‐fold greater than in the current study, meaning there was a lower power to show differences in SBP reduction in the current study. In addition, a majority of patients in the current study had well‐controlled SBP at baseline (>50% of patients had SBP <130 mmHg at baseline), which may have affected the ability to detect significant reductions in SBP with empagliflozin versus placebo across SBP categories.
Our study is subject to limitations of subgroup analyses; most importantly, the reduction in statistical power from lower patient numbers compared with the overall trial population, including a low number of participants from Asia within the higher BMI and body weight categories.
In conclusion, taken together, the results of this study suggest that empagliflozin, when used as second‐line therapy after metformin, is effective across all subgroups, but with higher efficacy in decreasing HbA1c and reducing body weight in those with higher baseline values of these variables. Importantly, the AE profiles were consistent with the overall AE profile for empagliflozin, regardless of the baseline values for HbA1c, body weight or SBP. In addition to empagliflozin being a glucose‐lowering agent recommended in patients with co‐existing CV disease and/or CKD, these data may help to tailor therapy with regard to important metabolic efficacy considerations.
CONFLICT OF INTEREST
S.E.I. has consulted for Janssen, vTv Therapeutics and Alere, served on Clinical Trial Steering/Executive Committees for AstraZeneca, Boehringer Ingelheim, Daiichi‐Sankyo, Eisai, Novo Nordisk and Sanofi/Lexicon Pharmaceuticals, and has served on Data Monitoring Committees for Intarcia Therapeutics, Inc. M.J.D. has acted as consultant, speaker and advisory board member for AstraZeneca, Boehringer Ingelheim, Eli Lilly and Company, Janssen, Merck Sharp & Dohme, Novo Nordisk and Sanofi‐Aventis, has acted as a speaker for Mitsubishi Tanabe Pharma Corporation, and has received grants in support of investigator and investigator‐initiated trials from Eli Lilly and Company, Novo Nordisk and Sanofi‐Aventis. K.K. has received research grants and acted as a consultant, advisory board member and speaker for AstraZeneca, Berlin‐Chemie AG/Menarini Group, Boehringer Ingelheim, Bristol‐Myers Squibb, Eli Lilly and Company, Merck Sharp & Dohme, Novo Nordisk, Roche and Sanofi. P.T. and I.Z. are employees of Boehringer Ingelheim. J.T.G. and O.E.J. were employed by Boehringer Ingelheim at the time of writing the manuscript, but are now employed elsewhere. N.S. has consulted for Amgen, Boehringer Ingelheim, Eli Lilly and Company, Napp, Novo Nordisk, Pfizer and Sanofi and has received grant support from Boehringer Ingelheim.
AUTHOR CONTRIBUTIONS
S.E.I. and O.E.J. wrote the first draft of the manuscript, which was subsequently reviewed by all the authors. All the authors were fully responsible for all content and editorial decisions, were involved at all stages of manuscript development, and have approved the final version. O.E.J. and N.S. are co‐senior authors.
Supporting information
Appendix S1 Supporting Information
ACKNOWLEDGEMENTS
Medical writing assistance, supported financially by Boehringer Ingelheim, was provided by Céline Tevlin and Paul Lidbury of Elevate Scientific Solutions, Horsham, UK, during the preparation of this manuscript. K.K. and M.J.D. acknowledge support from the National Institute for Health Research Applied Research Collaboration East Midland (NIHR ARC‐EM) and the NIHR Leicester Biomedical Research Centre. The EMPA‐REG MET trial and its 52‐week extension study, registered as NCT01159600 and NCT01289990, respectively, were funded by the Boehringer Ingelheim & Eli Lilly and Company Diabetes Alliance.
Inzucchi SE, Davies MJ, Khunti K, et al. Empagliflozin treatment effects across categories of baseline HbA1c, body weight and blood pressure as an add‐on to metformin in patients with type 2 diabetes. Diabetes Obes Metab. 2021;23:425–433. 10.1111/dom.14234
Funding information
The EMPA‐REG MET trial and its 52‐week extension study, registered as NCT01159600 and NCT01289990, respectively, were funded by the Boehringer Ingelheim & Eli Lilly and Company Diabetes Alliance.
Funding information Boehringer Ingelheim & Eli Lilly and Company Diabetes Alliance; National Institute for Health Research Applied Research Collaboration East Midlands; NIHR Leicester Biomedical Research Centre
DATA AVAILABILITY STATEMENT
The sponsor of the EMPA‐REG OUTCOME trial (Boehringer Ingelheim) is committed to responsible sharing of clinical study reports, related clinical documents and patient‐level clinical study data. Researchers are invited to submit inquiries via the following website (https://trials.boehringer-ingelheim.com/).
REFERENCES
- 1. Zinman B, Wanner C, Lachin JM, et al. Empagliflozin, cardiovascular outcomes, and mortality in type 2 diabetes. N Engl J Med. 2015;373:2117‐2128. [DOI] [PubMed] [Google Scholar]
- 2. Wanner C, Inzucchi SE, Lachin JM, et al. Empagliflozin and progression of kidney disease in type 2 diabetes. N Engl J Med. 2016;375:323‐334. [DOI] [PubMed] [Google Scholar]
- 3. Neal B, Perkovic V, Mahaffey KW, et al. Canagliflozin and cardiovascular and renal events in type 2 diabetes. N Engl J Med. 2017;377:644‐657. [DOI] [PubMed] [Google Scholar]
- 4. Marso SP, Daniels GH, Brown‐Frandsen K, et al. Liraglutide and cardiovascular outcomes in type 2 diabetes. N Engl J Med. 2016;375:311‐322. [DOI] [PMC free article] [PubMed] [Google Scholar]
- 5. Marso SP, Bain SC, Consoli A, et al. Semaglutide and cardiovascular outcomes in patients with type 2 diabetes. N Engl J Med. 2016;375:1834‐1844. [DOI] [PubMed] [Google Scholar]
- 6. Davies MJ, D'Alessio DA, Fradkin J, et al. Management of hyperglycaemia in type 2 diabetes, 2018. A consensus report by the American Diabetes Association (ADA) and the European Association for the Study of Diabetes (EASD). Diabetologia. 2018;61:2461‐2498. [DOI] [PubMed] [Google Scholar]
- 7. Buse JB, Wexler DJ, Tsapas A, et al. 2019 update to: Management of hyperglycaemia in type 2 diabetes, 2018. A consensus report by the American Diabetes Association (ADA) and the European Association for the Study of Diabetes (EASD). Diabetologia. 2020;63:221‐228. [DOI] [PubMed] [Google Scholar]
- 8. McGuire DK, Marx N, Johansen OE, Inzucchi SE, Rosenstock J, George JT. FDA guidance on antihyperglyacemic therapies for type 2 diabetes: one decade later. Diabetes Obes Metab. 2019;21:1073‐1078. [DOI] [PubMed] [Google Scholar]
- 9. Aschner P, Gagliardino JJ, Ilkova H, et al. Persistent poor glycaemic control in individuals with type 2 diabetes in developing countries: 12 years of real‐world evidence of the international diabetes management practices study (IDMPS). Diabetologia. 2020;63:711‐721. [DOI] [PMC free article] [PubMed] [Google Scholar]
- 10. Canivell S, Mata‐Cases M, Real J, et al. Glycaemic control after treatment intensification in patients with type 2 diabetes uncontrolled on two or more non‐insulin antidiabetic drugs in a real‐world setting. Diabetes Obes Metab. 2019;21:1373‐1380. [DOI] [PubMed] [Google Scholar]
- 11. Khunti K, Ceriello A, Cos X, De Block C. Achievement of guideline targets for blood pressure, lipid, and glycaemic control in type 2 diabetes: a meta‐analysis. Diabetes Res Clin Pract. 2018;137:137‐148. [DOI] [PubMed] [Google Scholar]
- 12. Choi SE, Berkowitz SA, Yudkin JS, Naci H, Basu S. Personalizing second‐line type 2 diabetes treatment selection: combining network meta‐analysis, individualized risk, and patient preferences for unified decision support. Med Decis Mak. 2019;39:239‐252. [DOI] [PMC free article] [PubMed] [Google Scholar]
- 13. Toroski M, Kebriaeezadeh A, Esteghamati A, Karyani AK, Abbasian H, Nikfar S. Patient and physician preferences for type 2 diabetes medications: a systematic review. J Diabetes Metab Disord. 2019;18:643‐656. [DOI] [PMC free article] [PubMed] [Google Scholar]
- 14. Khunti K, Gomes MB, Pocock S, et al. Therapeutic inertia in the treatment of hyperglycaemia in patients with type 2 diabetes: a systematic review. Diabetes Obes Metab. 2018;20:427‐437. [DOI] [PMC free article] [PubMed] [Google Scholar]
- 15. Grempler R, Thomas L, Eckhardt M, et al. Empagliflozin, a novel selective sodium glucose cotransporter‐2 (SGLT‐2) inhibitor: characterisation and comparison with other SGLT‐2 inhibitors. Diabetes Obes Metab. 2012;14:83‐90. [DOI] [PubMed] [Google Scholar]
- 16. Heise T, Seewaldt‐Becker E, Macha S, et al. Safety, tolerability, pharmacokinetics and pharmacodynamics following 4 weeks' treatment with empagliflozin once daily in patients with type 2 diabetes. Diabetes Obes Metab. 2013;15:613‐621. [DOI] [PubMed] [Google Scholar]
- 17. Ferrannini E, Seman L, Seewaldt‐Becker E, Hantel S, Pinnetti S, Woerle HJ. A phase IIb, randomized, placebo‐controlled study of the SGLT2 inhibitor empagliflozin in patients with type 2 diabetes. Diabetes Obes Metab. 2013;15:721‐728. [DOI] [PubMed] [Google Scholar]
- 18. Rosenstock J, Seman LJ, Jelaska A, et al. Efficacy and safety of empagliflozin, a sodium glucose cotransporter 2 (SGLT2) inhibitor, as add‐on to metformin in type 2 diabetes with mild hyperglycaemia. Diabetes Obes Metab. 2013;15:1154‐1160. [DOI] [PubMed] [Google Scholar]
- 19. Woerle HJ, Ferrannini E, Berk A, Manun'Ebo M, Pinnetti S, Broedl UC. Safety and efficacy of empagliflozin as monotherapy or add‐on to metformin in a 78‐week open‐label extension study in patients with type 2 diabetes. Diabetes. 2012;61(Suppl 1A):LB13(49‐LB). [DOI] [PMC free article] [PubMed] [Google Scholar]
- 20. Häring HU, Merker L, Seewaldt‐Becker E, et al. Empagliflozin as add‐on to metformin in patients with type 2 diabetes: a 24‐week, randomized, double‐blind, placebo‐controlled trial. Diabetes Care. 2014;37:1650‐1659. [DOI] [PubMed] [Google Scholar]
- 21. Merker L, Häring HU, Christiansen AV, et al. Empagliflozin as add‐on to metformin in people with type 2 diabetes. Diabet Med. 2015;32:1555‐1567. [DOI] [PubMed] [Google Scholar]
- 22. Bloomgarden ZT, Dodis R, Viscoli CM, Holmboe ES, Inzucchi SE. Lower baseline glycemia reduces apparent oral agent glucose‐lowering efficacy: a meta‐regression analysis. Diabetes Care. 2006;29:2137‐2139. [DOI] [PubMed] [Google Scholar]
- 23. Kohler S, Zeller C, Iliev H, Kaspers S. Safety and tolerability of empagliflozin in patients with type 2 diabetes: pooled analysis of phase I‐III clinical trials. Adv Ther. 2017;34:1707‐1726. [DOI] [PMC free article] [PubMed] [Google Scholar]
- 24. Inzucchi SE, Kosiborod M, Fitchett D, et al. Improvement in cardiovascular outcomes with empagliflozin is independent of glycemic control. Circulation. 2018;138:1904‐1907. [DOI] [PubMed] [Google Scholar]
- 25. Neeland IJ, McGuire DK, Chilton R, et al. Empagliflozin reduces body weight and indices of adipose distribution in patients with type 2 diabetes mellitus. Diab Vasc Dis Res. 2016;13:119‐126. [DOI] [PMC free article] [PubMed] [Google Scholar]
- 26. Wilding J, Godec T, Khunti K, et al. Changes in HbA1c and weight, and treatment persistence, over the 18 months following initiation of second‐line therapy in patients with type 2 diabetes: results from the United Kingdom clinical practice research Datalink. BMC Med. 2018;16:116. [DOI] [PMC free article] [PubMed] [Google Scholar]
- 27. Aas AM, Ohrvik J, Malmberg K, Ryden L, Birkeland KI, DIGAMI Investigators . Insulin‐induced weight gain and cardiovascular events in patients with type 2 diabetes. A report from the DIGAMI 2 study. Diabetes Obes Metab. 2009;11:323‐329. [DOI] [PubMed] [Google Scholar]
- 28. Phung OJ, Scholle JM, Talwar M, Coleman CI. Effect of noninsulin antidiabetic drugs added to metformin therapy on glycemic control, weight gain, and hypoglycemia in type 2 diabetes. JAMA. 2010;303:1410‐1418. [DOI] [PubMed] [Google Scholar]
- 29. Rosenstock J, Kahn SE, Johansen OE, et al. Effect of linagliptin vs glimepiride on major adverse cardiovascular outcomes in patients with type 2 diabetes: the CAROLINA randomized clinical trial. JAMA. 2019;322:1155‐1166. [DOI] [PMC free article] [PubMed] [Google Scholar]
- 30. Ross SA, Dzida G, Vora J, Khunti K, Kaiser M, Ligthelm RJ. Impact of weight gain on outcomes in type 2 diabetes. Curr Med Res Opin. 2011;27:1431‐1438. [DOI] [PubMed] [Google Scholar]
- 31. Purnell JQ, Zinman B, Brunzell JD, DCCT/EDIC Research Group . The effect of excess weight gain with intensive diabetes mellitus treatment on cardiovascular disease risk factors and atherosclerosis in type 1 diabetes mellitus: results from the diabetes control and complications trial/epidemiology of diabetes interventions and complications study (DCCT/EDIC) study. Circulation. 2013;127:180‐187. [DOI] [PMC free article] [PubMed] [Google Scholar]
- 32. Centers for Disease Control and Prevention . National Diabetes Statistics Report, 2017. Atlanta, GA: US Dept of Health and Human Services; 2017. [Google Scholar]
- 33. Traina S, Guthrie R, Slee A. The impact of weight loss on weight‐related quality of life and health satisfaction: results from a trial comparing canagliflozin with sitagliptin in triple therapy among people with type 2 diabetes. Postgrad Med. 2014;126:7‐15. [DOI] [PubMed] [Google Scholar]
- 34. Chilton R, Tikkanen I, Cannon CP, et al. Effects of empagliflozin on blood pressure and markers of arterial stiffness and vascular resistance in patients with type 2 diabetes. Diabetes Obes Metab. 2015;17:1180‐1193. [DOI] [PMC free article] [PubMed] [Google Scholar]
Associated Data
This section collects any data citations, data availability statements, or supplementary materials included in this article.
Supplementary Materials
Appendix S1 Supporting Information
Data Availability Statement
The sponsor of the EMPA‐REG OUTCOME trial (Boehringer Ingelheim) is committed to responsible sharing of clinical study reports, related clinical documents and patient‐level clinical study data. Researchers are invited to submit inquiries via the following website (https://trials.boehringer-ingelheim.com/).