

Abstract
The human intestine is host to a vast microbial community, the gut microbiome (GM). The GM has been considered as a key modulator of human health in the past decade. In particular, several studies have supported that altered GM is associated with cancer, such as colorectal cancer, adenocarcinoma, and pancreatic cancer. Formation of DNA adduct is one of the key events in carcinogenesis, and whether GM can influence DNA adducts has yet been examined. This study analyzed 10 DNA adducts (N2-Me-dG, N6-Me-dA, N2-Et-dG, OH-Me-dG, OH-Me-dA, N2-EtD-dG, O6-Me-dG, 1,N2-ε-dG, 8-oxo-dG, 5-Cl-dC), attributed to various endogenous processes and physiological stressors, using highly sensitive LC-MS/MS in germ-free (GF) and conventionally-raised (CONV-R) mice. Our results showed that significant differences in specific DNA adducts appeared in liver, colon, and small intestine samples between GF and CONV-R mice. The differences in adduct levels may indicate that GM can locally or systemically regulate endogenous processes including neutrophil bactericidal activity (represented by 5-Cl-dC), lipid peroxidation (1,N2-ε-dG), oxidative stress generation (8-oxo-dG), and endogenous aldehyde metabolism (OH-Me-dA). Further studies are warranted to elucidate how GM influences endogenous process, DNA damage and the risks of developing cancer.
Keywords: DNA adduct, gut microbiome, LC-MS/MS
Graphical Abstract

Introduction
The gut microbiome (GM) has been considered as a key modulator of human health in recent years, and more investigations have been made to evaluate the systemic, regulatory, and metabolic role of GM, rather than the classical interest in gastrointestinal disease pathogenesis.1,2 For instance, GM helps produce physiologically essential substances such as folate, secondary bile acids, and butyrate.2 Consequently, the dysbiosis of GM, e.g., disruption in GM composition, can result in impairment of host health. For example, in the gastrointestinal tract, lipopolysaccharides (LPS) is mainly produced by Gram-negative bacteria. Elevated LPS due to abnormal GM composition is a trigger of low-grade inflammation and insulin resistance, which can eventually lead to overweight and obesity.2 Commensal bacteria colonizing in hosts’ surface has been evidenced to correlate with various health events including Alzheimer’s disease, atherosclerosis, and cancer.3–8
Cancer, as the second leading cause of death worldwide, has shown association with GM’s metabolic and regulatory role.9 The change of GM composition and function that causes gastrointestinal dysbiosis has been linked to both local and distant oncogenic potential.4,10 Even without any enteric pathogen, commensal microbial imbalance and dysbiosis is capable of triggering or inducing malignancies.10,11 For example, colibactin and cytolethal distending toxin produced by enteric bacteria possess DNAse activity and may generate DNA double-strand breaks in the proximal gastrointestinal epithelium, which is potential for tumor initiation.12,13 Additionally, oxidative stress generation is one of the pathways GM can cause DNA damage.10 Research has shown that enteric microbes such as Bacteroides fragilis or Helicobacter pylori can trigger the host’s spermine oxidase, then further produce hydrogen peroxide and reactive oxygen species (ROS).10,14,15 The accumulation and imbalance of oxidative stress can cause DNA damage such as abasic sites and DNA adducts.16 Whether GM can induce key events in carcinogenesis should be understood more in order to clarify the potential oncogenic property of GM activity.
To our knowledge, little research has been done in understanding whether GM can modulate DNA adduct levels and further promote/inhibit mutagenic processes. The main objective of this study is to know whether GM status can affect endogenous DNA adducts. DNA adducts are defined as DNA nucleotides covalently bound to substances that adds a functional group to the DNA primary structure.17,18 DNA adducts, since they prohibit replications and transcriptions, trigger DNA damage responses that activate repair events. Inefficient, error-prone and slow repair of DNA are shown with higher probability of mutation.19 Therefore, formation of DNA adduct is a key event in carcinogenesis, and by monitoring levels of DNA adducts, an individual’s susceptibility to cancer and the stress level can be estimated. In addition, DNA adducts may serve as biomarkers since they can be attributed to endogenous processes or exogenous exposures. For instance, benzo(a)pyrene (BaP)-adducts show specificity to the exposure to BaP.20,21 Oxidative stress generated from different endogenous process can also lead to DNA adducts such as 8-oxo-2’-deoxyguanisine (8-oxo-dG).22–25 In this study, we monitor adducts caused by different endogenous processes to recognize potential roles of GM in modulating DNA damages. The sources and mutagenic types of the 10 DNA adducts we investigated are listed in the supporting information (Table S1). The chemical structures of the 10 adducts, which are N2-Methyl-dG (N2-Me-dG), N6-Methyl-dA (N6-Me-dA), N2-Ethyl-dG (N2-Et-dG), N2-Hydroxymethyl-dG (OH-Me-dG), N6-Hydroxymethyl-dA (OH-Me-dA), N2-Ethylidene-dG (N2-EtD-dG), O6-Methyl-dG (O6-Me-dG), 1,N2-Etheno-2’-dG (1,N2-ε-dG), 8-oxo-dG, and 5-Chloro-2’-dC (5-Cl-dC), are presented in Figure 1. OH-Me-dG, OH-Me-dA, and N2-EtD-dG were chemically converted to N2-Me-dG, N6-Me-dA, and N2-Et-dG, respectively, for detection (Figure 1K).
Figure 1.

Chemical structures of the 10 DNA adducts investigated in this research. (A) N2-Me-dG. (B) N6-Me-dA. (C) N2-Et-dG. (D) OH-Me-dG. (E) OH-Me-dA. (F) N2-EtD-dG. (G) O6-Me-dG. (H) 1,N2-ε-dG. (I) 8-oxo-dG. (J) 5-Cl-dC (K) Chemical reactions that utilizes NaCNBH3 to transform OH-Me-dG into N2-Me-dG. Similar chemical reactions were applied for transformation from OH-Me-dA to N6-Me-dA and N2-EtD-dG to N2-Et-dG.
In this study, we purified DNA and digested it into nucleosides from the colon, liver, small intestine, spleen, and brain tissues of GF and CONV-R mice, then we subsequentially monitored levels of the 10 DNA adducts. We succeeded in evidencing differences in adduct amount associated with the existence of GM. DNA adduct formations, being the key event in carcinogenesis, differ in GF and CONV-R mice. Our study supports that GM may influence mutagenic and cancer risk in individuals since differences in DNA adduct levels were observed. The variety in GM composition and metabolic activity may also contribute to different cancer susceptibility among individuals, which requires further investigation.
Material and Methodology
Chemicals and Materials.
All chemicals and reagents, if not otherwise specified, were purchased from Sigma-Aldrich. (St. Louis, MO). Methanol (CH3OH) solvent, water solvent, and isopropanol (C3H8O) were purchased from Thermo-Fisher Scientific (Rockford, IL). NucleoBond AXG 100 columns and NucleoBond buffer kit were bought from Macherey-Nagel (Bethlehem, PA). Stainless steel beads (5 mm) were purchased from Qiagen (Germantown, MD). Proteinase K was provided by VWR (Atlanta, GA). Nanosep Centrifugal Devices (MWCO 3K) were obtained from Pall Lift Sciences (Exton, PA). All the solvents were either HPLC-grade or LC-MS/MS grade.
Tissue Samples Collected from GF Mice and CONV-R Mice.
SPF grade C57BL/6 female mice (~7 weeks old) were purchased from Jackson Laboratories (Bar Harbor, ME). The mice were maintained in the static microisolator cages with Bed-O-Cob combination bedding under environmental conditions (22°C, 40–70% humidity, and a 12:12 h light:dark cycle) for one week and purified rodent diets were provided. The mice were then euthanized with carbon dioxide and necropsied to collect their tissues. GF female mice (~8 weeks old) were obtained from the National Gnotobiotic Resource Center at the University of North Carolina and were euthanized immediately with carbon dioxide to collect tissues. All tissue samples were fast frozen in liquid nitrogen and then stored at −80°C until use. All experiments were approved by the University of North Carolina on Animal Care. All mice were treated humanely as described in the approved animal protocol.
DNA Purification.
The experimental procedures for DNA purification, digestion and adduct enrichment were similar to those described previously.26–28 DNA of the tissues from GF mice and CONV-R mice were obtained by following the manufacturer instruction using NucleoBond DNA Isolation Kits. Briefly, approximate 50 mg of liver, colon, small intestine, spleen, or brain tissue of GF mice and CONV-R mice was homogenized in Nucleobond Buffer with a stainless-steel bead by a tissue lyser. Then, DNA was purified with the isolation kit and the resultant DNA was estimated in concentration by Nanodrop 2000 (Thermo Fisher Scientific).
DNA Reduction and Digestion.
As for analyzing aldehyde-induced DNA adducts that tends to be unstable under their nucleoside forms, DNA reduction was needed to convert OH-Me-dG to N2-Me-dG; OH-Me-dA to N6-Me-dA; and N2-EtD-dG to N2-Et-dG (See Figure 1K). The DNA reduction process was adapted from previous studies.26,29–31 Briefly, approximately 20 μg of DNA was dissolved in 70 μL water and added with 10 μL 1M NaPO3 and 20 μL 250 mM NaCNBH3. The reduction mixture was incubated overnight under 37°C, and was followed by digestion of DNA into nucleosides. If non-reduced DNA should be used for further analysis, 50 μg of extracted DNA was dissolved in 100 μL water and was prepared for digestion to nucleosides. The analysis of 20 μg DNA for reduced samples and 50 μg DNA for non-reduced samples were determined by several preliminary tests in order to get suitable DNA amounts needed for the adduct detection and quantitation. The reduced/non-reduced DNA solution was added with 200 μL NaPO3 buffer (50 mM NaPO3, 20 mM MgCl2, pH 7.2), 2.5 fmol of [13C1015N5]Me-dG; [15N5]Me-dA; [15N5]Et-dG; [15N5]O6-Me-dG; [13C515N5]ℇ-dG; [15N5]8-oxo-dG, 1.5 fmol of [13C915N3]5-Cl-dC, and DNAse (200 units), then was incubated under 37°C for 10 min. The adducts with heavy isotopes were served as the internal standard (IS), and was produced by methods described in the past studies.26,29,32–36 Subsequently, alkaline phosphatase (5 units) and phosphodiesterase (0.005 units) were used to digest each sample and the solutions were incubated for an additional 1 hr. The digested solutions were transferred to a 3 kDa MWCO filter and was centrifuged for 40 min to clear digesting enzymes. The eluted solution was collected for DNA adduct enrichment.
Deoxyguanosine Quantification, and DNA Adduct Enrichment.
The target analytes and their IS (Table 1) were purified from the filtrate using an Agilent 1200 Series UV HPLC System with a C18 reverse-phase column (T3, 3 μm, 15 cm × 4.6 mm i.d., Waters Atlantis). The detection wavelength was set at 254 nm, and the column temperature was set at 30°C. The mobile phase was consisted of water with 10 mM ammonium acetate(A), and methanol (B). As the flow rate was consistently set at 0.8 mL/min, the elution gradient condition was set as the following: 0 min, 5% B; 12 min, 15% B; 29 min, 22% B; 30 min, 80% B; 36 min, 5% B. The fractions that retained one or more DNA adduct(s) were dried using a vacuum concentrator and reconstituted with water before LC-MS/MS analysis. A calibration curve correlating the UV detection peak area (λ = 254 nm) and dG quantity was built and was used to estimate the dG amount in each digested DNA that was loaded on the HPLC column (See Figure S1). The dG amount for each sample was used for the adduct quantifying normalization (See Table S5).
Table 1.
Retention time, precursor/product ion mass-charge ratio (m/z) for 7 DNA adducts investigated in this research.
| Analyte | Retention time (min)a | Endogenous Analyte | Internal Standard Analyte | ||
|---|---|---|---|---|---|
| Precursor ion (m/z) | Product ion (m/z)b | Precursor ion (m/z) | Product ion (m/z)b | ||
| N2-Me-dG | 12.68 | 282.11968 | 166.07234 | 297.13840 | 176.07428 |
| N6-Me-dA | 11.89 | 266.12477 | 150.07742 | 271.10944 | 155.06260 |
| N2-Et-dG | 14.16 | 296.13533 | 180.08799 | 301.12050 | 185.07316 |
| O6-Me-dG | 14.49 | 282.11968 | 166.07234 | 287.10485 | 171.05751 |
| 1,N2-ε-dG | 13.18 | 292.10403 | 176.05669 | 302.13758 | 181.07346 |
| 8-oxo-dG | 12.14 | 284.09895 | 168.05160 | 289.08412 | 173.03678 |
| 5-Cl-dC | 11.70 | 262.05891 | 146.01157 | 274.08020 | 153.01609 |
Retention time on the LC-MS/MS analysis.
Product ion chose for quantification. All the quantifying product ions are the DNA adduct molecular ion with the deoxyribose sugar neutrally detached (−116 m/z, z=1).
DNA Adduct Identification and Quantification.
An Ultimate 3000 RSLCnano system coupled to a Q Exactive HF Hybrid Quadrupole-Orbitrap mass spectrometer utilizing an EASY-Spray ion source for nanoelectrospray ionization (Thermo Fisher Scientific) was used for the LC-MS/MS analysis. The DNA adducts were separated on a PepMap C18 analytical column (2 μm particle, 25 cm × 75 μm i.d., catalog number ES802, Thermo Fisher Scientific). The analytes were first loaded into a C18 trapping column (5 μm particle, 0.5 cm × 300 μm i.d., catalog number 160454, Thermo Fisher Scientific) at a flow rate of 5 μL/min in 0.1% formic acid in ddH2O (loading solvent) for 3 min. 0.1 % formic acid in ddH2O (solvent A) and acetonitrile (solvent B) together served as a binary solvent system for LC separation at a flow rate of 0.3 μL/min. The LC separation was applied with the following gradient setting: maintain in 5% B for 3 min (trapping time); 16.0 min, 40% B; 16.1 to 26 min, 90% B; 26.1 to 40 min, 5% (re-equilibrating).
In the LC-MS/MS analyses, both MS and MS/MS data were collected by one full scan coupled with the targeted parallel reaction monitoring (PRM) mode with an inclusion list consisted of the 7 endogenous DNA adducts and their IS. The precursors and quantifying product ions for the DNA adducts of interest were listed in Table 1. The Orbitrap resolution was set to 120,000 for the full MS, and 60,000 at m/z 200 for MS/MS spectra. The automatic gain control (AGC) target was set to 1×10⁶ with the corresponding maximum fill time (MFT) as 100 ms for the full scan. The AGC target and the MFT was 5×10⁵ and 150 ms for the MS/MS scan. The isolation window for precursors in the targeted PRM events was set to 1.4 m/z and the higher-energy collisional dissociation (HCD) fragmentation was set to a normalized collision energy of 25.
Calibration Curve for DNA Adducts Quantification.
The method of conducting calibration curves for DNA adduct quantification was modified from Liu’s study.27 Solutions containing different amount ratios of analytical standards (AS, native) and IS (heavy) of the DNA adducts were injected to the LC-MS/MS, and the signal ratios of AS and IS can be recorded. The amount ratios and signal ratios between AS and IS were used to conduct calibration curves for the DNA adducts.
Data Interpretation and Analysis.
The LC-MS/MS raw data acquired from the Q Exactive HF mass spectrometer were analyzed by Xcalibur software (Thermo Fisher Scientific). Quantification analyses were conducted on Skyline v19.1.0.193. by outputting the chromatographic peak area ratios of each endogenous DNA adducts to their respective IS after manually checking the peak integrations. The output ratios were converted into DNA adduct quantities by fitting in the calibration curves of each DNA adduct. The exact quantity of DNA adducts will be normalized by the dG quantified by the UV detector as afore-mentioned (units of adducts/108 dG). A subset of data in this study, which is composed of dG amounts and measurements used for quantifying N2-Me-dG in livers in GF (n=5) and CONV-R (n=5) mice is given in Table S5 as an example for DNA adduct quantification in this study. To examine whether statistically significant difference exist in each DNA adduct between GF mice tissues and CONV-R mice tissues, Mann-Whitney U tests was performed on R software v3.4.3. (RStudio, Boston).
Results
DNA Adduct Identification on LC-MS/MS.
7 DNA adducts, which are N2-Me-dG, N6-Me-dA, N2-Et-dG, O6-Me-dG, 1,N2-ε-dG, 8-oxo-dG, 5-Cl-dC, were detected by LC-MS/MS as described in the methods. The quantifying product ions’ intensities between endogenous adducts and IS adducts were compared, then was converted to the quantity of endogenous adducts by fitting in the calibration curve. After DNA reduction, The HO-Me-dG, HO-Me-dA, and N2-EtD-dG were converted to N2-Me-dG, N6-Me-dA, and N2-Et-dG, respectively, to maintain nucleoside stability after DNA digestion. DNA with and without reduction for each of the same tissues from GM and CONV-R mice were analyzed, and the difference between the quantities of N2-Me-dG, N6-Me-dA, and N2-Et-dG respectively indicates levels of HO-Me-dG, HO-Me-dA, and N2-EtD-dG. Figure 2 shows the representative chromatographic peak integration plots for 5-Cl-dC (Figure 2A), 1,N2-ε-dG (Figure 2B), 8-oxo-dG (Figure 2C), N2-Me-dG (Figure 2D), N6-Me-dA (Figure 2E), N2-Et-dG (Figure 2F), and O6-Me-dG (Figure 2G). The signal intensity ratio between the endogenous adduct and the IS adduct can fit in each adduct’s calibration curve to convert to the amount ratios. By multiplying the known added IS amount, the endogenous adduct level can be calculated. These data revealed confident power in identifying the 7 DNA adducts detected using high-resolution, accurate mass Orbitrap mass spectrometry.
Figure 2.

Representative chromatographic peak integrations for the quantifications of endogenous DNA adducts in tissue samples. Endogenous adducts in a tissue sample were shown in the upper panels in blue borders; internal standard adducts spiked were shown in the lower panels in red borders. (A) 5-Cl-dC detection (B) 1,N2-ɛ-dG detection (C) 8-oxo-dG detection (D) N2-Me-dG detection (E) N6-Me-dA detection (G) N2-Et-dG detection (G) O6-Me-dG detection.
Standard Curve for DNA Adduct Quantification.
For quantification of N2-Me-dG, N6-Me-dA, N2-Et-dG, O6-Me-dG, 1,N2-ε-dG, 8-oxo-dG, and 5-Cl-dC by Q Exactive HF, the targeted PRM mode was implemented. This mode, in brief, isolates the targeted precursor ions for HCD fragmentation, then conducts the full product ion spectrum. The quantity of the precursor ions can be achieved by reconstruction of chromatographic peaks based on the post-acquisition process. Two MS/MS events targeting each of the 7 endogenous DNA adducts and their IS were included in the PRM quantification in the LC-MS/MS methodology. We conducted calibration curves that converts signal ratio to amount ratio between endogenous adducts and IS for each of the 7 DNA adducts being detected. The calibration curves used for quantification and the intra-, inter-day accuracy and precision examination summary were provided in the supporting information (Table S2, Table S3, Table S4).
DNA Adducts arising from neutrophil activation between GF and CONV-R Mice.
Neutrophils may release hypochlorous acid (HOCl) in order to kill pathogens in situ. HOCl, as a strong oxidant, can be both bactericidal and harmful for biomolecules such as DNA. 5-Cl-dC is the representative DNA adduct resulted from HOCl secreted in immune-responses. Figure 3 shows the 5-Cl-dC levels in different tissues in GF and CONV-R mice. The adducts were quantified by LC-MS/MS and normalized with the dG amount measured by the HPLC-UV system (See Table S5 as an example) as described previously. An apparent trend of lower 5-Cl-dC level in every tissue analyzed can be observed, and significant differences were shown in colon and small intestine DNA between GF and CONV-R mice. Colon and small intestine are considered as local tissues for the gut microbiota to perform metabolic activities in situ. In contrast, liver, spleen, and brain are considered as distant tissues, and may be influenced by GM more distantly and systemically. In colon, GF and CONV-R mice were detected with 0.59±0.10 (Mean±SEM) and 0.34±0.04 adducts/108 dG for 5-Cl-dC (p < 0.05); and in small intestine, the level was 0.46±0.03 and 0.31±0.03 adducts/108 dG, respectively (p < 0.05). As a result, GM may restrict neutrophil bactericidal activity in tissues with bacteria, such as colon and small intestine.
Figure 3.

5-Cl-dC levels in different tissues from GF (N=5) and CONV-R (N=5) mice normalized by dG amount. 5-Cl-dC amount represents the DNA damage caused by neutrophils’ bactericidal activities. Quantification of DNA adducts are done by monitoring the ratio of endogenous adduct product ion over their IS and were adjusted with the dG amount evaluated using the UV HPLC system. All mean values of adduct quantity are presented with their standard error of mean (SEM) as error bars respectively. Data analyzed by Mann-Whitney U tests to examine whether significant difference exist in DNA adduct quantity in each tissue between GF and CONV-R. * p<0.05.
DNA Adducts from Lipid Peroxidation between GF and CONV-R Mice.
Figure 4 shows the 1,N2-ε-dG level normalized by dG amount in different tissues between GF mice and CONV-R mice, which reflects the tissue-specific difference in lipid peroxidation (LPO) potentially influenced by the gut microbiota. CONV-R mice possessed significant higher hepatic 1,N2-ε-dG than GF mice, in which the amounts were 3.15±0.08 and 5.96±0.34 adducts/108 dG, respectively (p < 0.01). This indicated that gut microbiota may influence LPO DNA damage in livers. Marginal difference existed in colon tissues in which CONV-R mice have higher 1,N2-ε-dG level than GF mice (p < 0.1). In other tissues, no significant differences were observed for 1,N2-ε-dG between GF and CONV-R mice.
Figure 4.
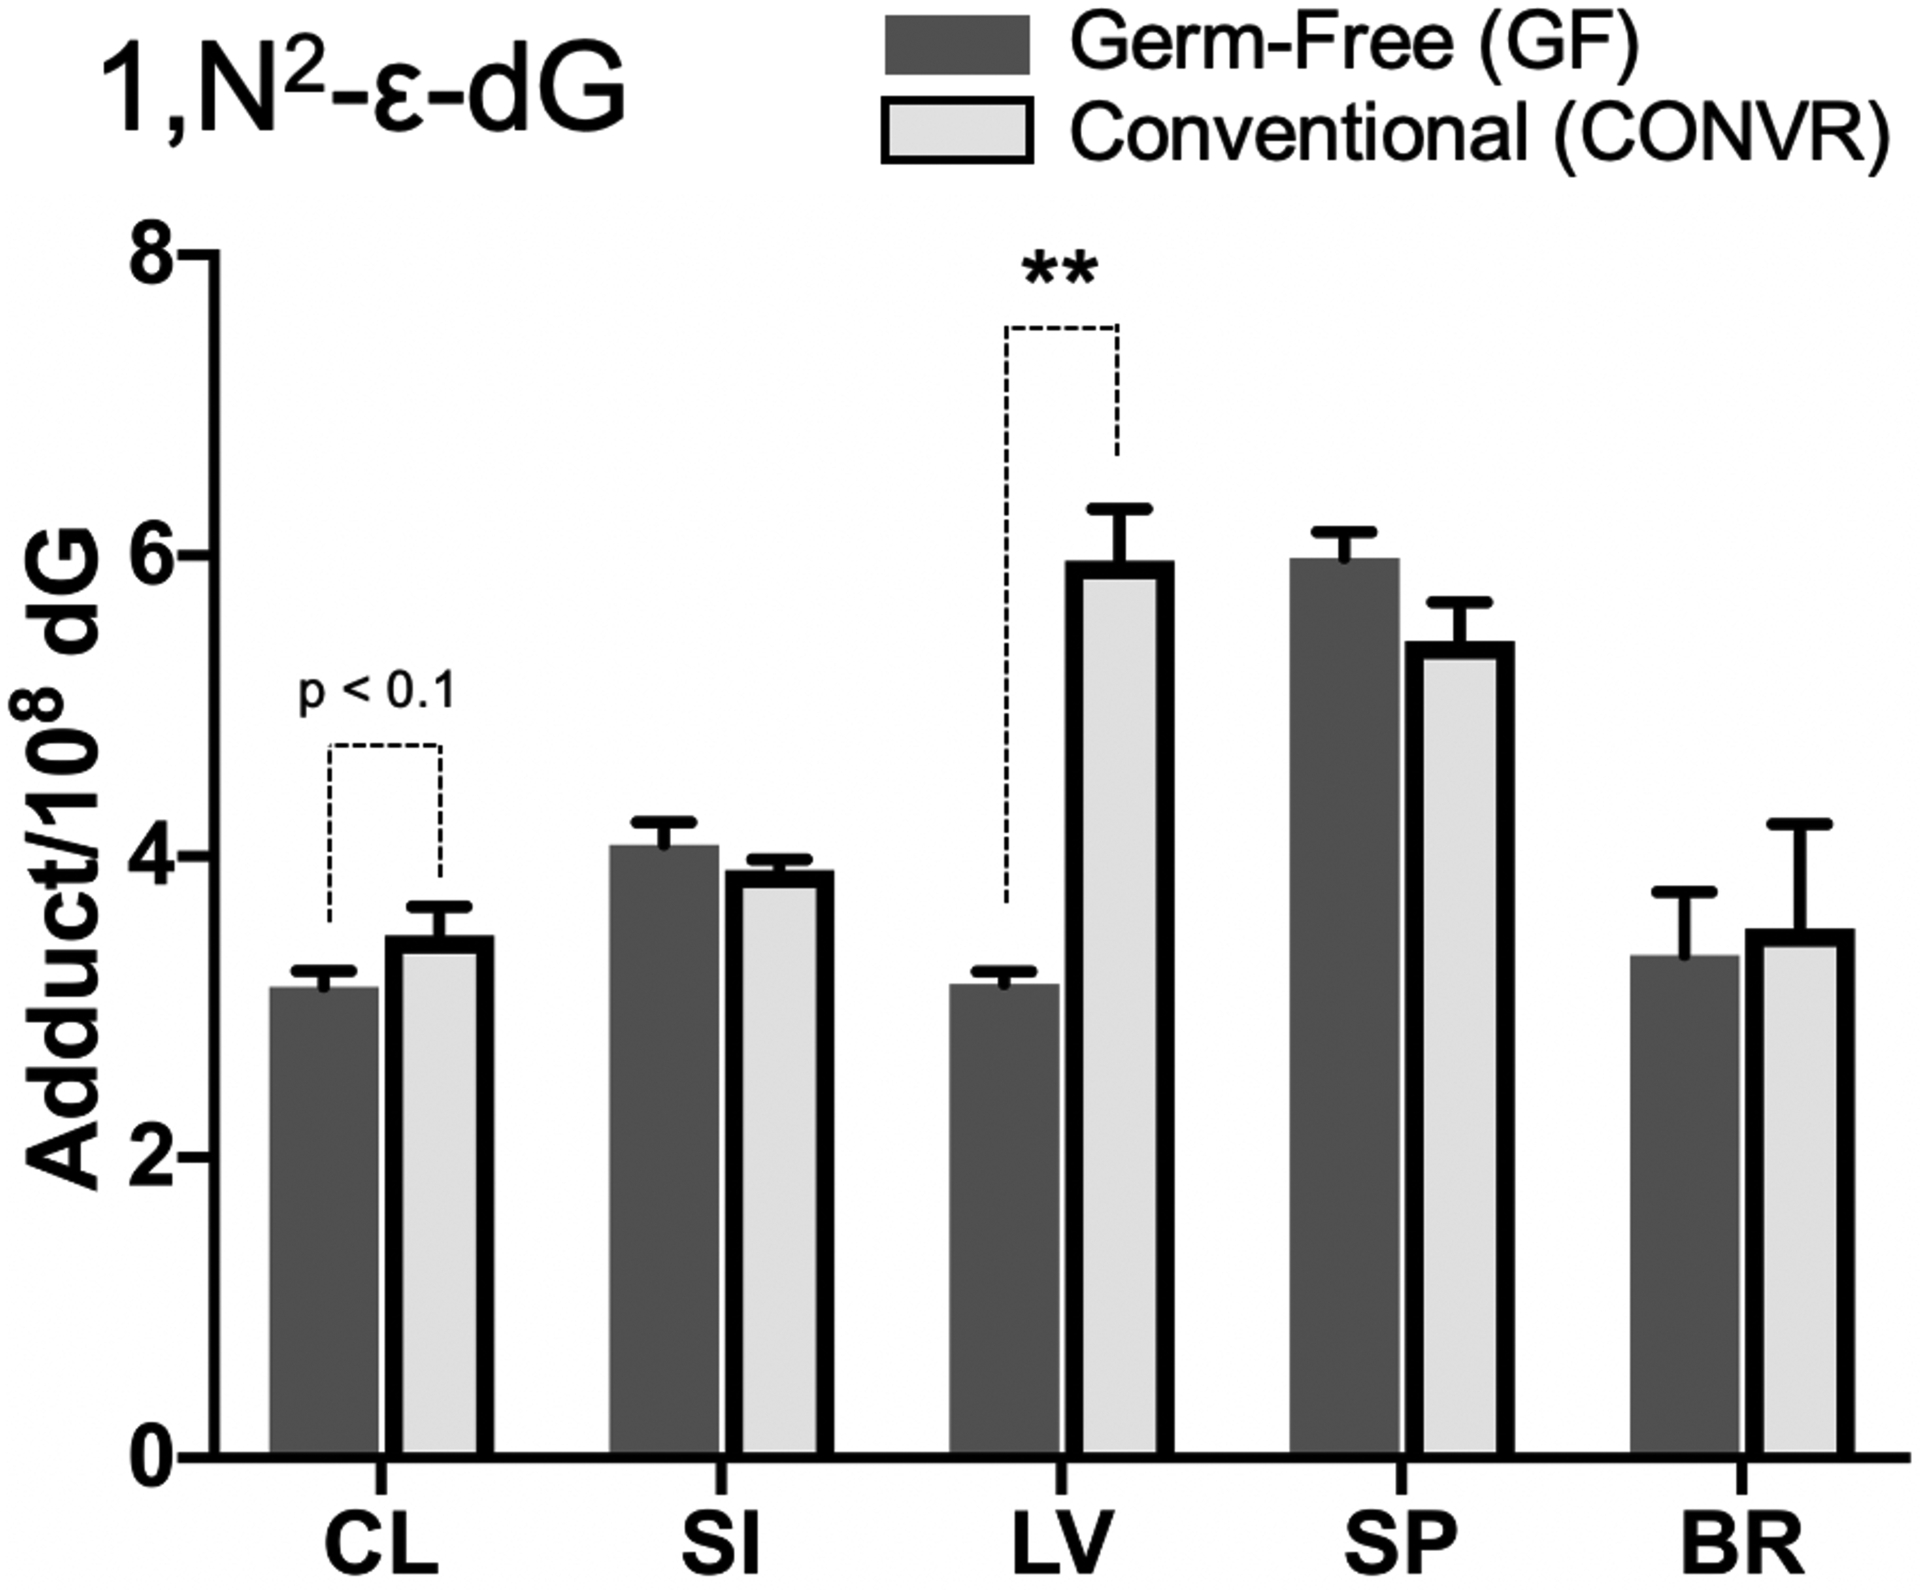
1,N2-ε-dG levels in different tissues from GF (N=5) and CONV-R (N=5) mice normalized by dG amount. 1,N2-ε-dG amount represents the endogenous LPO level in tissues. All mean values of adduct quantity are presented with their SEM as error bars respectively. Data analyzed by Mann-Whitney U tests to examine whether significant difference exist in DNA adduct quantity in each tissue between GF and CONV-R. * p<0.05; ** p<0.01.
DNA adduct from Oxidative Stress between GF and CONV-R Mice.
8-oxo-dG is a common-used and representative biomarker for ROS-related oxidative stress. As shown in Figure 5, in small intestine, the level of 8-oxo-dG was statistically significantly lower in GF mice. The amounts in small intestine were 345.87±27.11 adducts/108 dG for CONV-R mice and 477.94±42.45 adducts/108 dG for GF mice (p < 0.01).
Figure 5.

8-oxo-dG levels in different tissues from GF (N=5) and CONV-R (N=5) mice normalized by dG amount. The 8-oxo-dG quantity indicates the ROS-induced oxidative stress level. All mean values of adduct quantity are presented with their SEM as error bars respectively. Data analyzed by Mann-Whitney U tests to examine whether significant difference exist in DNA adduct quantity in each tissue between GF and CONV-R. * p<0.05; ** p<0.01.
Aldehyde-Induced DNA Adducts between GF and CONV-R Mice.
OH-Me-dG, OH-Me-dA, and N2-EtD-dG were detected in order to assess aldehyde-induced DNA damages. DNA extracted and purified from various tissue samples by going through DNA reduction can transform formaldehyde-induced DNA adducts (e.g., OH-Me-dG and OH-Me-dA) into DNA adducts with a methyl group (e.g., N2-Me-dG and N2-Me-dA) and transform acetaldehyde-induced DNA adducts (e.g., N2-EtD-dG) into DNA adducts with a ethyl group (e.g., N2-Et-dG). In the same tissue sample, the differences of N2-Me-dG, N6-Me-dA, and N2-Et-dG between reduced and non-reduced DNA indicate aldehyde-induced DNA adducts. Endogenous formaldehyde related DNA adducts such as OH-Me-dA presented higher levels in small intestine and liver of GF mice compared to CONV-R mice (Figure 6A and 6B). Significant higher OH-Me-dA was observed in liver tissues of GF (28.66±0.81) than in CONV-R (24.46±1.56) (p < 0.01). The higher OH-Me-dA in GF mice liver indicated a lower formaldehyde-induced damage attributed to gut microbiota existence (Figure 6B). In colon tissues, OH-Me-dA cannot be monitored due to high N6-Me-dA contamination (as a OH-Me-dA surrogate for detection) attributed to gut bacteria. Prokaryotes like enteric bacteria utilize N6-Me-dA as their normal DNA modification.37 We observed that when purifying and digesting colon DNA with bacterial DNA containing, extreme high proportion of detectable N6-Me-dA did not originate from the host (CONV-R mice). OH-Me-dG were in similar level between GF and CONV-R mice (Figure 6A). N2-EtD-dG, which is contributed by endogenous acetaldehyde mainly generated from ethanol metabolism, was observed with a significantly lower level in the small intestines of GF mice (9.02±0.40) than in CONV-R mice (15.13±1.81) (Figure 6C) (p < 0.01). In addition, marginally higher level of N2-EtD-dG can be observed in the CONV-R spleen samples (p < 0.06).
Figure 6.

Aldehyde-induced DNA adducts in different tissues GF (N=5) and CONV-R (N=5) mice, separated by OH-Me-dG (A), OH-Me-dA (B), N2-EtD-dG (C). Reduced and non-reduced DNA originated from the same tissue were compared for N2-Me-dG, N6-Me-dA, and N2-Et-dG, and the difference is interpreted as the aldehyde-induced adducts, which are OH-Me-dG, OH-Me-dA, and N2-EtD-dG, respectively. All mean values of adduct quantity are presented with their SEM as error bars respectively. Data analyzed by Mann-Whitney U tests. ** p<0.01.
Alkylation-Induced DNA Adducts between GF and CONV-R Mice.
To investigate whether GM can modify endogenous DNA damage from alkylation, N2-Me-dG, N6-Me-dA, N2-Et-dG, O6-Me-dG were examined. In all tissues, alkylation-induced DNA adducts presented similar levels in CONV-R and GF mice. N2-Me-dG and N6-Me-dA mainly result from methyl donor, and are potential for mutation when DNA repair happens. Marginal difference of N2-Me-dG can be observed in spleen samples in which CONV-R mice had lower adduct level than GF mice (p < 0.1) (Figure 7A). For other tissues, levels of N2-Me-dG were statistically similar. Tissues from GF mice and CONV-R mice, except for colon samples, were analyzed for N6-Me-dA, but no significant difference was seen (Figure 7B).
Figure 7.
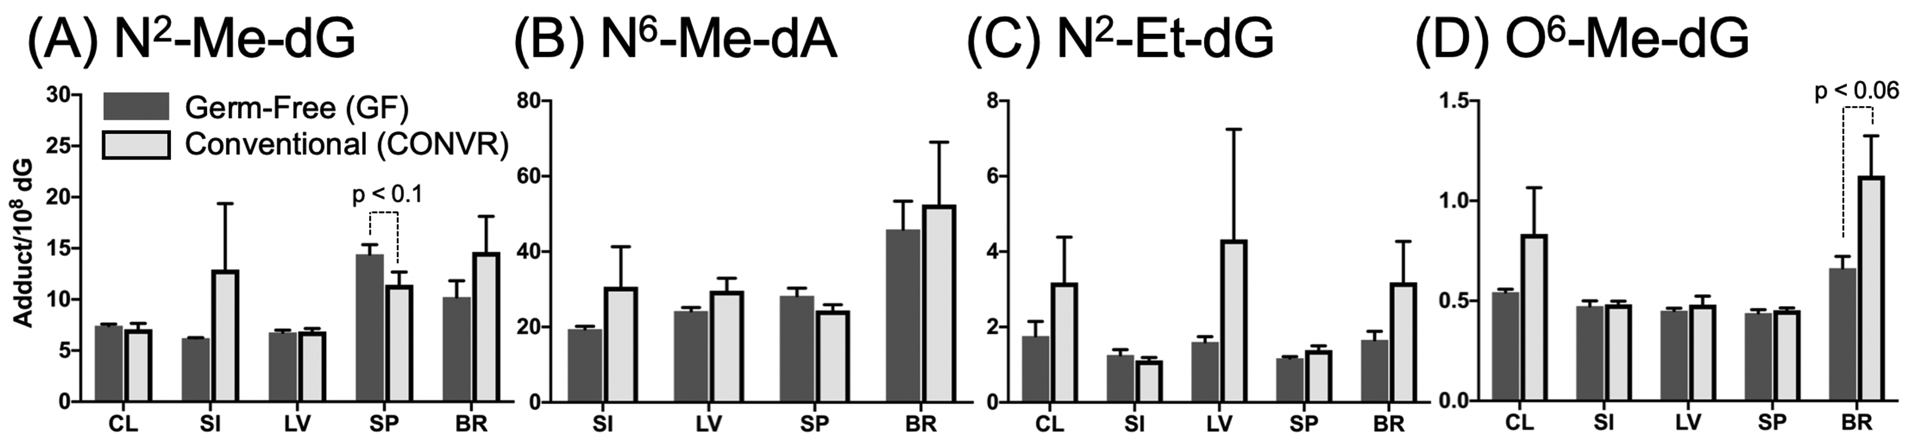
Alkylation-induced DNA adducts in different tissues (CL: colon, SI: small intestine, LV: liver, SP: spleen, BR: brain) from GF (dark gray bar, N=5) and CONV-R (light gray bar, N=5) mice, separated by N2-Me-dG (A), N6-Me-dA (B), N2-Et-dG (C), O6-Me-dG (D). All mean values of adduct quantity are presented with their SEM as error bars respectively. Data analyzed by Mann-Whitney U tests to examine whether significant difference exist in DNA adduct quantity in each tissue between GF and CONV-R. No significant results were obtained in this section of data.
O6-Me-dG is a methylation-induced DNA damage that is highly mutagenic, potentially causing GC→AT mutation. The trends of higher O6-Me-dG level in both colon and brain in CONV-R mice were observed, in which marginal difference existed in brain samples (p < 0.06) (Figure 7D). N2-Et-dG is thought to represent DNA damage attributed to current uncertain endogenous ethylating agents. CONV-R mice possessed higher N2-Et-dG levels than GF mice in colon, liver, spleen, and brain but presented similar level in small intestine (Figure 7C), though the trends showed no significant difference.
Discussion
This study demonstrates the role of gut microbiome (GM) in influencing baseline endogenous processes that lead to DNA adduct damages. Specifically, immune response, LPO, and oxidative stress related DNA adducts were different in GF and CONV-R mice. In addition, we observed larger variations in DNA adducts in CONV-R mice. For example, variations in aldehyde-induced (Figure 6) and alkylation-induced (Figure 7) DNA adducts are larger in CONV-R than in GF mice tissues. Likewise, for neutrophil bactericidal activity (Figure 3), LPO (Figure 4), and oxidative stress (Figure 5), the DNA adducts show higher variations in the colon samples of CONV-R mice than in GF mice. Bacteria may modulate endogenous processes in local or even distant tissues. The larger variations in different DNA adducts in CONV-R mice may imply different extents of regulations that were attributed to the variability of individual gut microbiome composition. Research has supported the link of GM and host health events; however, the molecular/cellular key events as well as individual susceptibility introduced by different GM composition requires further investigation.
Neutrophils secrete HOCl to present bactericidal activity as an immune response, and the strong oxidant HOCl may chlorinate biomolecules such as DNA, which creates DNA adducts including 5-Cl-dC.38,39 Mangerich et al. stimulated inflammatory carcinogenesis by infecting mice with Helicobacter hepaticus, and observed significantly higher levels of oxidized (8-oxo-dG) and chlorinated (5-Cl-dC) nucleosides in the infected subjects.40 The level of 5-Cl-dC, therefore, represents the immune defense of neutrophils.40,41 In every tissue, CONV-R mice showed a lower 5-Cl-dC level than in GF mice, and in colon and small intestine DNA, statistical significance was reached (Figure 3). Belkaid and Hand reviewed about the tolerance that the host immune system may exist to maintain GM homeostasis, and Murdoch et al. elucidated that serum amyloid A (Saa) can be induced by GM, then can systemically constrain the level of neutrophil bactericidal activity (but promote neutrophil recruitment) in a zebrafish model.42,43 Our findings echoed these results since systemic constraints of neutrophil activities that can form 5-Cl-dC were observed in CONV-R mice. GM has been known to induce host local immunological tolerance to maintain the commensal relationship. Our results may imply the possibility of systemic immunological tolerance since trends of lower 5-Cl-dC can be observed in both local and distant tissues.
1,N2-ε-dG is a DNA damage-associated adduct resulted from one of the main LPO products, 4-hydroxy-2-nonenal (4-HNE).33,44 4-HNE can be metabolized by the glutathione s-transferase (GSH) to produce glutathionyl-HNE (GS-HNE).45 If not metabolized, endogenous 4-HNE may target biomolecules, and 1,N2-ε-dG is one of the prominent DNA adducts that can be formed. 4-HNE is one of the well-studied active lipid electrophiles resulted from the peroxidation of polyunsaturated fatty acids (PUFAs), and PUFAs in the cell membrane lipid bilayers are vulnerable to oxidation by reactive species.44,46 Therefore, the adduct resulted from 4-HNE, 1,N2-ε-dG, is a good biomarker in understanding the baseline lipid peroxidation effects, and is used as a representative etheno adduct that derived from LPO in this study. However, there are other DNA lesions caused by LPO, such as 1,N6-etheno-2’-dA; N2,3-etheno-dG; 3,N4-etheno-2’-dC, that can be attributed to different LPO products (e.g., malondialdehyde and 4-oxo-(2E)-nonenal).47,48 To more holistically understand the effects of GM in DNA adducts resulted from LPO, more species of LPO adducts should be monitored in the future. In this study, the existence of GM significantly increased the level of 1,N2-ε-dG in livers (Figure 4). The rise in 4-HNE damage may result from the lower GSH activities in livers. The study conducted by Mardinoglu et al. demonstrated the systemic influence of GM on amino acid and glutathione synthesis.49 The mechanism of the glutathione modulation can differ in tissues, and can be up-/down-regulated via critical enzymes’ gene expression or promotion/reduction of necessary substrates availability. The higher hepatic 1,N2-ε-dG in CONV-R mice suggests higher hepatic 4-HNE level. GM may either increase 4-HNE production rate by inducing LPO, or restrict the metabolism of 4-HNE. Previous study has shown that GM can lower hepatic GSH activity due to specific down-regulation of glutathione synthesis enzymes; or limited availability to glutathione synthesis substrates (e.g., glutamate, cysteine).49,50 Thus, the mechanism of GM inducing hepatic LPO damage may require future investigation.
The trends in livers, small intestines, and spleens demonstrated the decreasing tendency of oxidative stress by GM. In small intestines, significantly lower oxidative stress was observed in CONV-R mice. The major antioxidants in vivo can be either enzymatic (e.g., catalase and glutathione peroxidase) or non-enzymatic (e.g., ascorbic acid and α-tocopherol). The reduction of small intestine oxidative stress correlated by GM may be attributed to the enhancement in antioxidant scavenging defenses. The normal GM may increase levels of metabolite activities, or up-regulate antioxidase activities in host.51 The balance between oxidative stress and antioxidant defense is complicated and can be contributed by various physiological routes. Specific effects of GM, such as the regulation to antioxidant synthesis, GSH level, and oxidative stress generations should be investigated.
Endogenous formaldehyde can be produced during the metabolism of exogenous or endogenous substances, e.g., serine, histamine, L-methionine.27,30,52 On the other hand, acetaldehyde is produced mainly by metabolism of ethanol.53 Endogenous ethanol may result from bacterial alcohol fermentation in the gastrointestinal tract. Formaldehyde and acetaldehyde as oxidants may attack biomolecules, and the Schiff base created in DNA nucleotides, by transforming into DNA adducts like OH-Me-dG, OH-Me-dA, and N2-EtD-dG, may potentially be mutagenic.54 In liver tissues, our study demonstrated that GM is correlated with lower hepatic formaldehyde-induced DNA adducts (Figure 6). N6-Me-dA was observed in a significantly lower amount in the liver of CONV-R mice. Higher efficiency in formaldehyde biotransformation may be distantly triggered by GM. Formaldehyde is a substance for the metabolizing enzymes such as alcohol dehydrogenase ADH 1 (cytosolic), which transform formaldehyde into formic acid.52,55 However, there is little study supporting that GM up-regulates ADH 1 activities systemically, and the linkage between the gut microbiota and hepatic ADH 1 performance should be evaluated further.56
As for acetaldehyde-induced N2-EtD-dG, significant and marginal increase was observed in CONV-R small intestines and spleens, respectively. The anaerobic condition of small intestine, with bacteria existing, may form ethanol that creates acetaldehyde stress in situ. Whether GM can systemically regulate ethanol metabolism or endogenous acetaldehyde is still unrecognized and require further study.
Conclusion
In this study, we were able to demonstrate that GM can affect DNA adduct levels in mice by LC-ESI-MS/MS detections and quantifications of DNA adducts representing different endogenous processes. Significant differences of adduct amounts were observed in colon, liver, and small intestine tissues between GF and CONV-R mice. Our results showed that GM may modulate aldehyde metabolism, lipid peroxidation and oxidative stress, as well as neutrophil activities. By affecting the DNA adduct level, GM composition or metabolic function may serve as a factor in modulating individual cancer risk. Our study suggests GM’s role in altering key events (i.e., DNA adduct formation) in carcinogenesis. The organ- or tissue-dependent effects of GM in regulating metabolic process, and how different composition of GM can promote/restrict DNA damages requires further investigation.
Supplementary Material
Funding information
This work was support in part by the NIH grant (R01-ES-024950), the University of North Carolina Center for Environmental Health and Susceptibility with the NIH grant (P30-ES-010126) and UNC-SRP (P42-ES-031007)
Footnotes
Supporting Information
UV-signal to dG amount calibration curve on HPLC-UV system for dG quantification. Sources and mutagenic properties for the 10 DNA adduct investigated in this study. Linear regression equation to transfer the signal ratio between endogenous and IS adducts to their amount ratio for the 7 DNA adducts detected in this study. Intra- and inter-day accuracy and precision evaluation for the 7 DNA adducts (AS) by spikes of each DNA adduct’s IS. Intra- and inter-day calibration curve tests for the 7 DNA adducts (analytical standards, AS) by spikes of each DNA adduct’s IS. Descriptive statistics for dG amount and N2-Me-dG adduct quantification in liver of GF (n=5) and CONV-R (n=5) mice.
References
- 1.Cresci GA & Bawden E Gut Microbiome: What We Do and Don’t Know. Nutrition in clinical practice : official publication of the American Society for Parenteral and Enteral Nutrition 30, 734–746, doi: 10.1177/0884533615609899 (2015). [DOI] [PMC free article] [PubMed] [Google Scholar]
- 2.Cani PD Human gut microbiome: hopes, threats and promises. Gut 67, 1716–1725, doi: 10.1136/gutjnl-2018-316723 (2018). [DOI] [PMC free article] [PubMed] [Google Scholar]
- 3.Jahani-Sherafat S, Alebouyeh M, Moghim S, Ahmadi Amoli H & Ghasemian-Safaei H Role of gut microbiota in the pathogenesis of colorectal cancer; a review article. Gastroenterol Hepatol Bed Bench 11, 101–109 (2018). [PMC free article] [PubMed] [Google Scholar]
- 4.Garrett WS The gut microbiota and colon cancer. Science 364, 1133, doi: 10.1126/science.aaw2367 (2019). [DOI] [PubMed] [Google Scholar]
- 5.Ahmadmehrabi S & Tang WHW Gut microbiome and its role in cardiovascular diseases. Curr Opin Cardiol 32, 761–766, doi: 10.1097/HCO.0000000000000445 (2017). [DOI] [PMC free article] [PubMed] [Google Scholar]
- 6.Wang Z et al. Gut flora metabolism of phosphatidylcholine promotes cardiovascular disease. Nature 472, 57–63, doi: 10.1038/nature09922 (2011). [DOI] [PMC free article] [PubMed] [Google Scholar]
- 7.Jiang C, Li G, Huang P, Liu Z & Zhao B The Gut Microbiota and Alzheimer’s Disease. J Alzheimers Dis 58, 1–15, doi: 10.3233/JAD-161141 (2017). [DOI] [PubMed] [Google Scholar]
- 8.Kowalski K & Mulak A Brain-Gut-Microbiota Axis in Alzheimer’s Disease. J Neurogastroenterol Motil 25, 48–60, doi: 10.5056/jnm18087 (2019). [DOI] [PMC free article] [PubMed] [Google Scholar]
- 9.Nagai H & Kim YH Cancer prevention from the perspective of global cancer burden patterns. J Thorac Dis 9, 448–451, doi: 10.21037/jtd.2017.02.75 (2017). [DOI] [PMC free article] [PubMed] [Google Scholar]
- 10.Vivarelli S et al. Gut Microbiota and Cancer: From Pathogenesis to Therapy. Cancers 11, 38, doi: 10.3390/cancers11010038 (2019). [DOI] [PMC free article] [PubMed] [Google Scholar]
- 11.Bhatt AP, Redinbo MR & Bultman SJ The role of the microbiome in cancer development and therapy. CA: A Cancer Journal for Clinicians 67, 326–344, doi: 10.3322/caac.21398 (2017). [DOI] [PMC free article] [PubMed] [Google Scholar]
- 12.Taieb F, Petit C, Nougayrède J-P & Oswald E The Enterobacterial Genotoxins: Cytolethal Distending Toxin and Colibactin. EcoSal Plus 7, 10.1128/ecosalplus.ESP-0008–2016, doi: 10.1128/ecosalplus.ESP-0008-2016 (2016). [DOI] [PMC free article] [PubMed] [Google Scholar]
- 13.Graillot V et al. Genotoxicity of Cytolethal Distending Toxin (CDT) on Isogenic Human Colorectal Cell Lines: Potential Promoting Effects for Colorectal Carcinogenesis. Frontiers in Cellular and Infection Microbiology 6, doi: 10.3389/fcimb.2016.00034 (2016). [DOI] [PMC free article] [PubMed] [Google Scholar]
- 14.Rocha ER, Herren CD, Smalley DJ & Smith CJ The complex oxidative stress response of Bacteroides fragilis: the role of OxyR in control of gene expression. 9, 165–173, doi: 10.1016/s1075-9964(03)00118-5 (2003). [DOI] [PubMed] [Google Scholar]
- 15.Ding S-Z et al. Helicobacter pylori infection induces oxidative stress and programmed cell death in human gastric epithelial cells. Infect Immun 75, 4030–4039, doi: 10.1128/IAI.00172-07 (2007). [DOI] [PMC free article] [PubMed] [Google Scholar]
- 16.Kryston TB, Georgiev AB, Pissis P & Georgakilas AG Role of oxidative stress and DNA damage in human carcinogenesis. Mutation Research/Fundamental and Molecular Mechanisms of Mutagenesis 711, 193–201, doi: 10.1016/j.mrfmmm.2010.12.016 (2011). [DOI] [PubMed] [Google Scholar]
- 17.De Bont R Endogenous DNA damage in humans: a review of quantitative data. Mutagenesis 19, 169–185, doi: 10.1093/mutage/geh025 (2004). [DOI] [PubMed] [Google Scholar]
- 18.Rajalakshmi TR, AravindhaBabu N, Shanmugam KT & Masthan KMK DNA adducts-chemical addons. J Pharm Bioallied Sci 7, S197–S199, doi: 10.4103/0975-7406.155901 (2015). [DOI] [PMC free article] [PubMed] [Google Scholar]
- 19.Tubbs A & Nussenzweig A Endogenous DNA Damage as a Source of Genomic Instability in Cancer. Cell 168, 644–656, doi: 10.1016/j.cell.2017.01.002 (2017). [DOI] [PMC free article] [PubMed] [Google Scholar]
- 20.Stowers SJ & Anderson MW Formation and persistence of benzo(a)pyrene metabolite-DNA adducts. Environ Health Perspect 62, 31–39, doi: 10.1289/ehp.856231 (1985). [DOI] [PMC free article] [PubMed] [Google Scholar]
- 21.Kulkarni MS & Anderson MW Persistence of benzo(a)pyrene metabolite:DNA adducts in lung and liver of mice. Cancer Res 44, 97–101 (1984). [PubMed] [Google Scholar]
- 22.Valavanidis A, Vlachogianni T & Fiotakis C 8-hydroxy-2’ -deoxyguanosine (8-OHdG): A critical biomarker of oxidative stress and carcinogenesis. J Environ Sci Health C Environ Carcinog Ecotoxicol Rev 27, 120–139, doi: 10.1080/10590500902885684 (2009). [DOI] [PubMed] [Google Scholar]
- 23.Sova H, Jukkola-Vuorinen A, Puistola U, Kauppila S & Karihtala P 8-Hydroxydeoxyguanosine: a new potential independent prognostic factor in breast cancer. British Journal of Cancer 102, 1018–1023, doi: 10.1038/sj.bjc.6605565 (2010). [DOI] [PMC free article] [PubMed] [Google Scholar]
- 24.Roszkowski K, Jozwicki W, Blaszczyk P, Mucha-Malecka A & Siomek A Oxidative damage DNA: 8-oxoGua and 8-oxodG as molecular markers of cancer. Med Sci Monit 17, CR329–CR333, doi: 10.12659/msm.881805 (2011). [DOI] [PMC free article] [PubMed] [Google Scholar]
- 25.Weimann A, Belling D & Poulsen HE Quantification of 8-oxo-guanine and guanine as the nucleobase, nucleoside and deoxynucleoside forms in human urine by high-performance liquid chromatography-electrospray tandem mass spectrometry. Nucleic Acids Res 30, E7–E7, doi: 10.1093/nar/30.2.e7 (2002). [DOI] [PMC free article] [PubMed] [Google Scholar]
- 26.Leng J et al. Evaluation of inhaled low-dose formaldehyde-induced DNA adducts and DNA-protein cross-links by liquid chromatography-tandem mass spectrometry. Archives of toxicology 93, 763–773, doi: 10.1007/s00204-019-02393-x (2019). [DOI] [PMC free article] [PubMed] [Google Scholar]
- 27.Liu C-W et al. Accurate Measurement of Formaldehyde-Induced DNA–Protein Cross-Links by High-Resolution Orbitrap Mass Spectrometry. Chemical research in toxicology 31, 350–357, doi: 10.1021/acs.chemrestox.8b00040 (2018). [DOI] [PubMed] [Google Scholar]
- 28.Yu R et al. Formation, Accumulation, and Hydrolysis of Endogenous and Exogenous Formaldehyde-Induced DNA Damage. Toxicological sciences : an official journal of the Society of Toxicology 146, 170–182, doi: 10.1093/toxsci/kfv079 (2015). [DOI] [PMC free article] [PubMed] [Google Scholar]
- 29.Lu K, Collins LB, Ru H, Bermudez E & Swenberg JA Distribution of DNA adducts caused by inhaled formaldehyde is consistent with induction of nasal carcinoma but not leukemia. Toxicological sciences : an official journal of the Society of Toxicology 116, 441–451, doi: 10.1093/toxsci/kfq061 (2010). [DOI] [PMC free article] [PubMed] [Google Scholar]
- 30.Swenberg JA et al. Endogenous versus exogenous DNA adducts: their role in carcinogenesis, epidemiology, and risk assessment. Toxicological sciences : an official journal of the Society of Toxicology 120 Suppl 1, S130–145, doi: 10.1093/toxsci/kfq371 (2011). [DOI] [PMC free article] [PubMed] [Google Scholar]
- 31.Lu K, Craft S, Nakamura J, Moeller BC & Swenberg JA Use of LC-MS/MS and stable isotopes to differentiate hydroxymethyl and methyl DNA adducts from formaldehyde and nitrosodimethylamine. Chemical research in toxicology 25, 664–675, doi: 10.1021/tx200426b (2012). [DOI] [PMC free article] [PubMed] [Google Scholar]
- 32.Kang JI, Burdzy A, Liu P & Sowers LC Synthesis and Characterization of Oligonucleotides Containing 5-Chlorocytosine. Chemical research in toxicology 17, 1236–1244, doi: 10.1021/tx0498962 (2004). [DOI] [PubMed] [Google Scholar]
- 33.Petrova KV, Jalluri RS, Kozekov ID & Rizzo CJ Mechanism of 1, N 2 -Etheno-2′-deoxyguanosine Formation from Epoxyaldehydes †. 20, 1685–1692, doi: 10.1021/tx7001433 (2007). [DOI] [PMC free article] [PubMed] [Google Scholar]
- 34.Matter B, Malejka-Giganti D, Csallany AS & Tretyakova N Quantitative analysis of the oxidative DNA lesion, 2,2-diamino-4-(2-deoxy-β-d-erythro-pentofuranosyl)amino]-5(2H)-oxazolone (oxazolone), in vitro and in vivo by isotope dilution-capillary HPLC-ESI-MS/MS. Nucleic Acids Res 34, 5449–5460, doi: 10.1093/nar/gkl596 (2006). [DOI] [PMC free article] [PubMed] [Google Scholar]
- 35.Guza R, Ma L, Fang Q, Pegg AE & Tretyakova N Cytosine Methylation Effects on the Repair of O6-Methylguanines within CG Dinucleotides. 284, 22601–22610, doi: 10.1074/jbc.m109.000919 (2009). [DOI] [PMC free article] [PubMed] [Google Scholar]
- 36.Ziegel R, Shallop A, Upadhyaya P, Jones R & Tretyakova N Endogenous 5-Methylcytosine Protects Neighboring Guanines from N7 and O6-Methylation and O6-Pyridyloxobutylation by the Tobacco Carcinogen 4-(Methylnitrosamino)-1-(3-pyridyl)-1-butanone. Biochemistry 43, 540–549, doi: 10.1021/bi035259j (2004). [DOI] [PubMed] [Google Scholar]
- 37.O’Brown ZK & Greer EL N6-Methyladenine: A Conserved and Dynamic DNA Mark. Adv Exp Med Biol 945, 213–246, doi: 10.1007/978-3-319-43624-1_10 (2016). [DOI] [PMC free article] [PubMed] [Google Scholar]
- 38.Henderson JP, Byun J & Heinecke JW Molecular chlorine generated by the myeloperoxidase-hydrogen peroxide-chloride system of phagocytes produces 5-chlorocytosine in bacterial RNA. J Biol Chem 274, 33440–33448, doi: 10.1074/jbc.274.47.33440 (1999). [DOI] [PubMed] [Google Scholar]
- 39.Wang Y et al. Hypochlorous Acid Generated by Neutrophils Inactivates ADAMTS13. 290, 1422–1431, doi: 10.1074/jbc.m114.599084 (2015). [DOI] [PMC free article] [PubMed] [Google Scholar]
- 40.Mangerich A et al. Infection-induced colitis in mice causes dynamic and tissue-specific changes in stress response and DNA damage leading to colon cancer. Proceedings of the National Academy of Sciences 109, E1820–E1829, doi: 10.1073/pnas.1207829109 (2012). [DOI] [PMC free article] [PubMed] [Google Scholar]
- 41.Wogan GN, Dedon PC, Tannenbaum SR & Fox JG Infection, inflammation and colon carcinogenesis. Oncotarget 3, 737–738, doi: 10.18632/oncotarget.624 (2012). [DOI] [PMC free article] [PubMed] [Google Scholar]
- 42.Belkaid Y & Timothy. Role of the Microbiota in Immunity and Inflammation. Cell 157, 121–141, doi: 10.1016/j.cell.2014.03.011 (2014). [DOI] [PMC free article] [PubMed] [Google Scholar]
- 43.Murdoch CC et al. Intestinal Serum amyloid A suppresses systemic neutrophil activation and bactericidal activity in response to microbiota colonization. PLOS Pathogens 15, e1007381, doi: 10.1371/journal.ppat.1007381 (2019). [DOI] [PMC free article] [PubMed] [Google Scholar]
- 44.Zhong H & Yin H Role of lipid peroxidation derived 4-hydroxynonenal (4-HNE) in cancer: focusing on mitochondria. Redox Biol 4, 193–199, doi: 10.1016/j.redox.2014.12.011 (2015). [DOI] [PMC free article] [PubMed] [Google Scholar]
- 45.Ayala A, Muñoz MF & Argüelles S Lipid Peroxidation: Production, Metabolism, and Signaling Mechanisms of Malondialdehyde and 4-Hydroxy-2-Nonenal. Oxidative Medicine and Cellular Longevity 2014, 1–31, doi: 10.1155/2014/360438 (2014). [DOI] [PMC free article] [PubMed] [Google Scholar]
- 46.Mihalas BP, De Iuliis GN, Redgrove KA, McLaughlin EA & Nixon B The lipid peroxidation product 4-hydroxynonenal contributes to oxidative stress-mediated deterioration of the ageing oocyte. Scientific Reports 7, 6247, doi: 10.1038/s41598-017-06372-z (2017). [DOI] [PMC free article] [PubMed] [Google Scholar]
- 47.Blair IA DNA Adducts with Lipid Peroxidation Products. Journal of Biological Chemistry 283, 15545–15549, doi: 10.1074/jbc.r700051200 (2008). [DOI] [PMC free article] [PubMed] [Google Scholar]
- 48.Swenberg JA, Fedtke N, Ciroussel F, Barbin A & Bartsch H Etheno adducts formed in DNA of vinyl chloride-exposed rats are highly persistent in liver. Carcinogenesis 13, 727–729, doi: 10.1093/carcin/13.4.727 (1992). [DOI] [PubMed] [Google Scholar]
- 49.Mardinoglu A et al. The gut microbiota modulates host amino acid and glutathione metabolism in mice. Molecular Systems Biology 11, 834–834, doi: 10.15252/msb.20156487 (2015). [DOI] [PMC free article] [PubMed] [Google Scholar]
- 50.Zhang J, Zhang J & Wang R Gut microbiota modulates drug pharmacokinetics. Drug Metab Rev 50, 357–368, doi: 10.1080/03602532.2018.1497647 (2018). [DOI] [PubMed] [Google Scholar]
- 51.Wang Y et al. Antioxidant Properties of Probiotic Bacteria. Nutrients 9, 521, doi: 10.3390/nu9050521 (2017). [DOI] [PMC free article] [PubMed] [Google Scholar]
- 52.Voulgaridou G-P, Anestopoulos I, Franco R, Panayiotidis MI & Pappa A DNA damage induced by endogenous aldehydes: current state of knowledge. Mutation research 711, 13–27, doi: 10.1016/j.mrfmmm.2011.03.006 (2011). [DOI] [PubMed] [Google Scholar]
- 53.Elshaghabee FMF et al. Ethanol Production by Selected Intestinal Microorganisms and Lactic Acid Bacteria Growing under Different Nutritional Conditions. Front Microbiol 7, 47–47, doi: 10.3389/fmicb.2016.00047 (2016). [DOI] [PMC free article] [PubMed] [Google Scholar]
- 54.Cheng G et al. Reactions of Formaldehyde Plus Acetaldehyde with Deoxyguanosine and DNA: Formation of Cyclic Deoxyguanosine Adducts and Formaldehyde Cross-Links. 16, 145–152, doi: 10.1021/tx025614r (2003). [DOI] [PubMed] [Google Scholar]
- 55.Shindyapina AV et al. The Antioxidant Cofactor Alpha-Lipoic Acid May Control Endogenous Formaldehyde Metabolism in Mammals. Frontiers in Neuroscience 11, doi: 10.3389/fnins.2017.00651 (2017). [DOI] [PMC free article] [PubMed] [Google Scholar]
- 56.Blundon MA et al. Microbiota-dependent elevation of Alcohol Dehydrogenase in Drosophila is associated with changes in alcohol-induced hyperactivity and alcohol preference. bioRxiv, 444471, doi: 10.1101/444471 (2018). [DOI] [Google Scholar]
Associated Data
This section collects any data citations, data availability statements, or supplementary materials included in this article.