Abstract
We use the recently released Cloud Aerosol Lidar and Infrared Pathfinder Satellite Observations (CALIPSO) Version 4.1 (V4) lidar data to study the smoke plumes transported from Southern African biomass burning areas. Significant improvements in the CALIPSO V4 Level 1 calibration and V4 Level 2 algorithms lead to a better representation of their optical properties, with the aerosol subtype improvements being particularly relevant to smoke over this area. For the first time, we show evidence of smoke particles increasing in size, evidenced in their particulate color ratios, as they are transported over the South Atlantic Ocean from the source regions over Southern Africa. We hypothesize that this is due to hygroscopic swelling of the smoke particles and is reflected in the higher relative humidity in the middle troposphere for profiles with smoke. This finding may have implications for radiative forcing estimates over this area and is also relevant to the ORACLES field mission.
Keywords: CALIPSO lidar measurements, African smoke, Evolution of optical properties
1. Introduction:
The impact of different types of aerosols on our environment is not very well understood and there is an ever-increasing need to characterize the various aerosol types in different parts of the globe (IPCC, 2013). In particular, the smoke from biomass burning needs to be better understood because of the important radiative effects of black carbon (Bond et al., 2013), and because forest fires have been growing in size and frequency in many parts of the world. As such, there have been many studies of biomass burning smoke, their properties and evolution with time (e.g., Reid et al., 2005, Semeniuk et al., 2007, Saide et al., 2015). Some of these properties depend upon the location and type of burning (e.g., smoldering or flaming).
Over Southern Africa, savanna burning occurs every year between June and October and constitutes the largest source of biomass burning smoke over the globe (IPCC, 2013; Van der Werf et al., 2010). The smoke plumes from these fires are transported over the Southeast Atlantic Ocean within 5–7 days, overlying one of the largest low altitude extended stratus cloud decks anywhere on the globe, which has consequences for radiative forcing estimates in this area. The direct radiative forcing can be complex under such circumstances changing from cooling in absence of clouds to potentially heating at the top of the atmosphere depending upon the aerosol loading as well as the albedo and fractional coverage of the underlying clouds (Chand et al., 2009, Wilcox, 2012, Yu and Zhang, 2013). Passive satellite sensors have generally limited utility here because the aerosol retrievals are done mostly for cloud-free conditions. However, progress has been made in recent years, with researchers exploiting the spectral dependence of the absorption of the upwelling radiation by the aerosols to simultaneously retrieve the cloud and aerosol optical depths for cloudy scenes (Jethva et al., 2013, 2016, Meyer et al., 2015, Sayer et al., 2016). Multi angle polarization information from the POLDER instrument has also been utilized to retrieve the AOD (Waquet et al., 2012, Peers et al. 2015). However, passive sensors can not provide vertically resolved information on these clouds and aerosols, which is crucial for a proper assessment of the radiative forcing, both direct and indirect. This vertical information has become possible in the last decade because of the space borne lidar CALIPSO, which has been providing high quality measurements of the aerosol vertical profiles globally since June 2006 (Winker et al., 2009). Measurements from CALIPSO have been used to derive accurate estimates of radiative forcing of the ACA in this region (Chand et al., 2008, 2009).
In the CALIPSO data processing sequence, the attenuated backscatter data are first examined to detect layers using a thresholding algorithm (Vaughan et al., 2009) and then the layers are classified as either a cloud or aerosol (Liu et al., 2009). The aerosol layers are subsequently assigned various subtypes based on their optical properties and geospatial location (Omar et al., 2009). The November 2016 release of Version 4.1 (V4) of the CALIPSO lidar Level 2 data products incorporates significant improvements to the retrieval algorithms, including the aerosol subtype assignments. In particular, there was a significant anomaly in the subtyping over the Southeast Atlantic in earlier versions, where many smoke layers were misclassified as marine layers. This has since been addressed in V4. Many more smoke layers are now identified over the Atlantic, thus presenting a good opportunity for further study of these extensive and regularly occurring smoke plumes. In particular, the evolution of the optical properties of these smoke plumes as they are transported great distances over the South Atlantic may now be better characterized.
In this short report, we use V4 CALIPSO data to present evidence of the evolution of size of the smoke particles being exported from the Southern African savanna burning zones. We show that these particles tend to increase in size as they are transported large distances over the ocean. Recent work has noted a close correlation between the smoke plumes and moisture over the South east Atlantic with a general increase in mid-tropospheric moisture in polluted conditions (Adebiyi et al., 2015). While most constituents of smoke plumes are generally hydrophobic, aging and oxidation processes during the transport might make them hydrophilic, and the signatures of this behavior could be discerned in the relative humidity data. This result will have implications for regional radiative forcing as well as for simulations of the transport of these extensive smoke plumes and should be of interest to the currently ongoing ObseRvations of Aerosols above CLouds and their intEractionS (ORACLES) aircraft mission studying the smoke and its interaction with clouds over the same area (Zuidema et al., 2016).
2. Data:
We use the CALIPSO V4 level 2 aerosol profile product, which reports height-resolved profiles of the total backscatter and extinction coefficients at 532 nm and 1064 nm, as well as the perpendicular backscatter coefficients at 532 nm for all layers detected. The horizontal resolution of the data is 5km while the vertical resolution is 60m up to 20km and 180m above that. As part of the V4 level 2 updates, the retrieval algorithms were optimized to take maximum advantage of the changes in the V4 level 1 data, released earlier, with significant improvements in both the 532 nm and 1064 nm channel calibrations (Getzewich et al., 2015). In particular, the improvement in 1064 nm channel calibration makes it feasible to study the optical properties of particles using both the channels with a higher degree of confidence in this new data set. We shall use the particulate color ratio (χ) of the aerosols,which is defined by the relation:
| (1) |
where β1064(z) and β532(z) are the particulate backscatter coefficients retrieved at altitude z at 1064 nm and 532 nm respectively. The particulate color ratio values derived from CALIPSO measurements for the various subtypes typically range from 0 to 2, with the small particles like smoke, polluted continental, clean and polluted dust generally having a broad peak near 0.5, while coarse particles like dust, marine and dusty marine have broad peak near 0.7 or so. The uncertainties of the backscatter coefficients are somewhat larger for 1064 nm than 532 nm and the estimated uncertainties for the particulate color ratio for the various subtypes generally peak around 150% – 200%.
We use aerosol layers that have been assigned the smoke aerosol subtype by the CALIOP level 2 aerosol classification algorithm for our analysis (Omar et al. 2009).. Previous iterations of the CALIPSO aerosol subtype assignments have been validated by comparison with AERONET data as well as High Spectral Resolution Lidar (HSRL) data (Mielonen et al., 2009, Misra et al., 2013, Burton et al., 2013, Bibi et al., 2016). We also use the 1064 nm measurements retrieved from the Cloud-Aerosol Transport System (CATS) lidar on board the International Space Station (ISS) Mode 7.2 Version 2–00 Level 2 Operational (L2O) Layer and Profile data products. The CATS lidar measures 1064 nm elastic backscatter in polarization planes parallel and perpendicular to the transmitted linearly polarized laser pulses, thus providing depolarization ratio data at 1064 nm since March 2015 (Yorks et al., 2016).
3. Results
3.1. Particulate color ratio evolution in transported smoke.
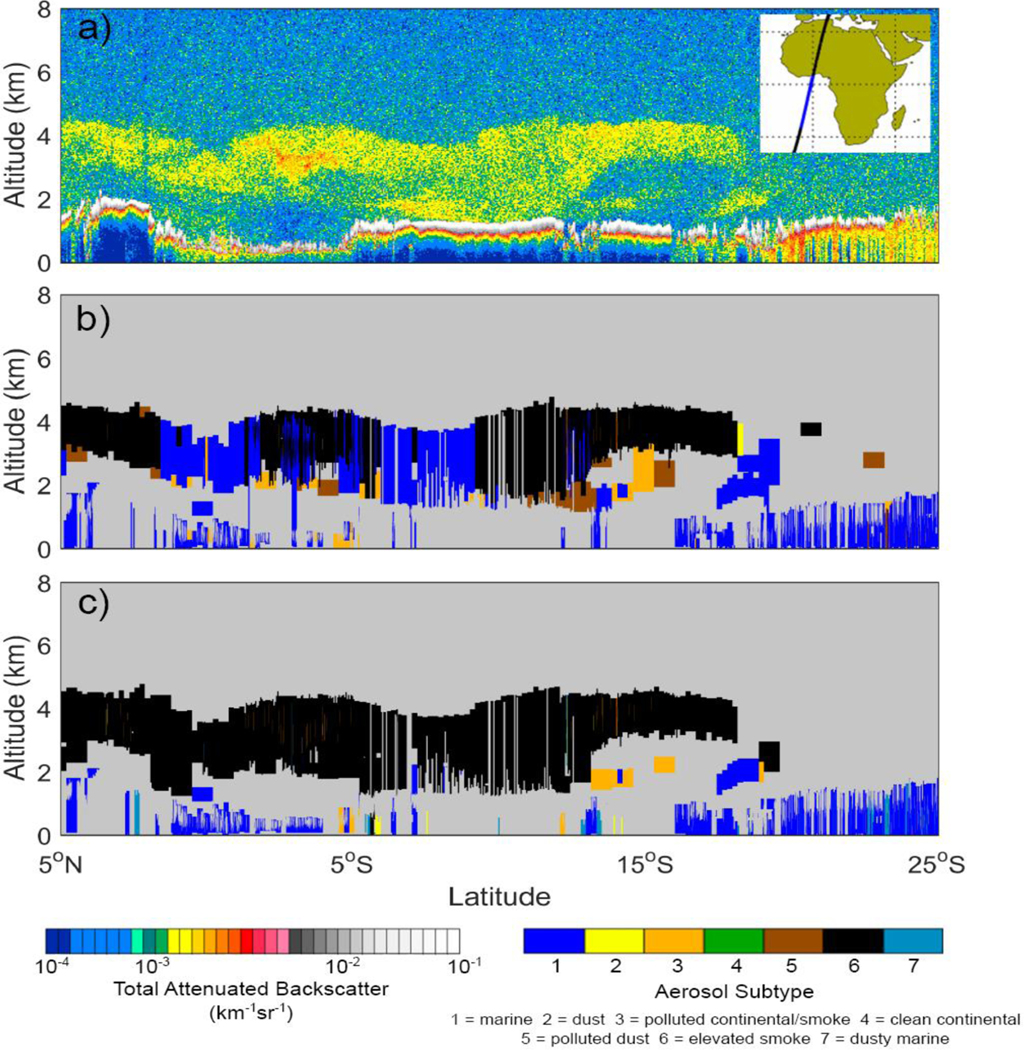
Figure 1a shows the nighttime 532 nm attenuated backscatter coefficients measured over the South Atlantic Ocean off the coast of Southern Africa on September 5, 2010. The extended plume at 2–5 km altitude between 19°S and 5°N is smoke that has been transported from the extensive fires that occur over Southern Africa between June and October every year. Figure 1b shows the aerosol subtypes assigned in the Version 3 (V3) data products. As can be seen, in the V3 analysis the plume between 2 and 5 km is punctuated by a large number of misclassified marine layers (in blue). The misclassification of smoke layers as marine was a pervasive problem in V3 data over this area. Figure 1c shows the recently released V4 data, where now we can see a fuller and more coherent smoke plume. The V4 analysis reports a much larger number of smoke layers (and an upward revision of the aerosol optical depth) over this most important and extensive biomass burning area. Thus, we now have more representative information about the spatial extent of biomass burning plumes in this region so that we can better exploit the optical properties reported in the CALIPSO data products.
Figure 1.
CALIPSO browse images from September 5, 2010 of a) 532 nm attenuated backscatter coefficients; and b) aerosol subtypes from V3; and c) aerosol subtypes from V4.
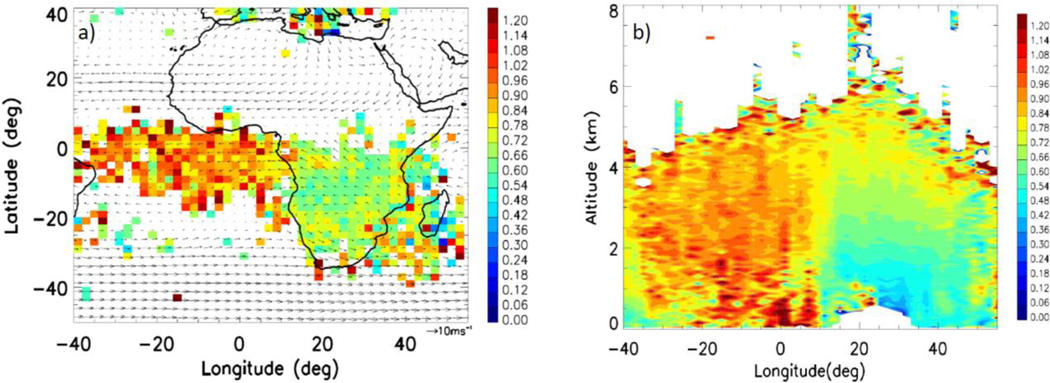
Figure 2a shows the spatial distribution of the particulate color ratio of the aerosol samples classified as smoke at 3 km using nighttime data for the month of August averaged over 2006–2010. An important change in CALIPSO V4 that is particularly relevant over this area is that the V4 aerosol subtyping algorithm no longer distinguishes between polluted continental and smoke at low altitudes. Instead these layers are identified as “polluted continental/smoke”. An “elevated smoke” subtype is defined for those smoke layers with top altitudes exceeding 2.5 km. We have included both smoke categories in our analysis. As mentioned above, the particulate color ratio is the ratio of the total backscatter coefficients at 1064 nm and 532 nm, and provides a measure of aerosol particle size. The data shown in Figure 2 used only cloud free nighttime profiles. Further, we have included data from only those profiles which had the extinction quality control flag as either zero, indicating that the initial lidar ratio resulted in stable extinction retrievals, or one, which flags those cases where the lidar ratio could be inferred directly from the data (constrained retrievals). We also filtered out the data points where the extinction uncertainty estimate diverged and where the uncertainty of particulate color ratio exceeds 500%. The uncertainty filter retains about 93% of the samples in the region between equator and 35°S and 35°W-55°E. A minimum number of 15 samples was used for each grid box. As can be seen in Figure 2a, there is a clear increase in the particulate color ratio values from the source areas over land to those over the ocean. This likely represents an increase in the size of the smoke particles as they are swept over the ocean over 5–7 days. To our knowledge, this is the first time evidence for such an increase in the size of the smoke particles using satellite data is being reported over this area. The full altitude information can be seen in Figure 2b, which shows the height-longitude cross-section of the particulate color ratios over 0–25°S, using only the cloud free nighttime profiles for August 2006–2010. Once again, the difference between the land and ocean can be clearly seen with somewhat higher values at the lowest altitudes over the ocean, which might be due to gravitational settling of relatively larger and heavier particles.
Figure 2.
a) Particulate color ratio distribution of smoke at 3 km for August, 2006–2010 (binned at 2°×2° in latitude and longitude), with wind vectors at 700 hPa from MERRA-2 (August 2006–2010) re-binned into 2.5°×2.5° in latitude and longitude; and b) height-longitude cross section of particulate color ratio along 0–25°S (August 2006–2010). Only nighttime data are used.
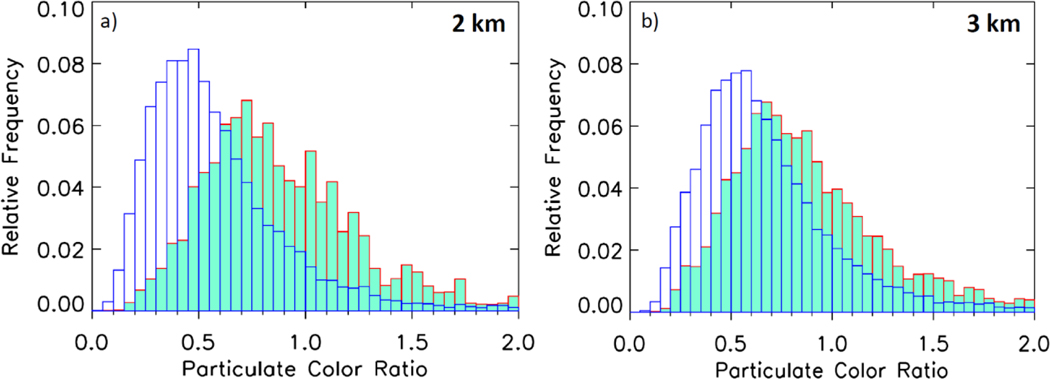
Figures 3a and 3b show the histograms of the particulate color ratio at 2 km and 3 km respectively over the source regions on land (in blue, between 25°S-equator, 10°E-35°E) and over oceanic regions (in aquamarine, filled, between 25°S-equator, 30°W-10°E) for August 2006–2010. There is a significant difference in the color ratio distribution between land and ocean with the distribution significantly shifted toward higher values over the ocean at both altitudes with much sharper difference at 2 km. At 3 km, the mean particulate color ratio over land is ~0.7 while that over the ocean is ~0.9, an increase of ~29%, while the increase at 2 km is ~ 60%. This increase in particulate color ratio for smoke particles was seen for all months between June and October and in all years with some interannual variability. Similar results were also obtained using the daytime data although the latter has significantly more noise than the nighttime (not shown). Given that this phenomenon occurs consistently for the key biomass burning months every year, it is not likely to be a data artifact.
Figure 3.
Histograms of particulate color ratio over land (25°S-0,10°E-35°E, in blue) and ocean (25°S-0, 30°W-10°E, in aquamarine, filled) at a) 2 km and b) 3 km (August 2006–2010).
Apart from the smoke that is transported to the Atlantic, there is another pathway that transports smoke plumes from the southern Africa to the Indian Ocean. This has been noted in satellite data (Swap et al., 1998) and has been known as the “river of smoke”. This outflow can be seen in Figure 2 south of 20°S and between 30°E-55°E. While there is some suggestion of a similar increased color ratio as compared to the land, there is more noise as compared to the outflow to the South east Atlantic. Further, the signature is not clearly seen in the spatial distribution at other altitudes (not shown). Therefore we shall restrict our discussion to the transport to the South East Atlantic ocean only.
The current version (V4.1) of the CALIPSO data processing scheme employs the Modern Era Retrospective Analysis for Research and Applications version 2 (MERRA-2) for meteorological information. The latter, for the first time, assimilates aerosol optical depth (AOD) retrieved from AVHRR, MODIS, MISR and AERONET through the integration of the GOCART model and the aerosol radiative feedbacks to the atmospheric fields (Randles et al., 2016). The vertical profiles of the total attenuated backscatter from MERRA-2 generally reproduce the CALIPSO vertical profiles at various places over the globe but show some biases (Randles et al., 2016). Insofar as MERRA-2 already incorporates aerosol information, it is important to determine if the results presented above are biased in any way. We found similar particulate color ratio enhancements over the ocean using V3 CALIPSO data, which reported fewer smoke layers but used GEOS-5.7.2 meteorological data that did not assimilate the aerosol information, thus discounting the possibility of any bias coming from the MERRA-2 meteorology.
The increase in size of smoke particles from CALIPSO observations as seen above is consistent with the findings of Sayer et al. (2014), who studied smoke aerosols transported from biomass burning using data from Analysis of Aerosol Robotic Network (AERONET) stations. For African smoke particles reaching Ascension Island (7.98°S, 14.42°W) in the southeast Atlantic Ocean, they found the volume mean radius (rv,f) for fine mode particles to be larger by about 0.02 μm than at the inland station of Mongu (15.25°S, 23.15°E) in South Africa. This difference is significantly higher than the estimated uncertainty of 0.01 μm for (rv,f) (Sayer et al., 2014). They did not find any evidence of data artifacts resulting from calibration or contamination issues and concluded that the larger radius of the smoke particles at Ascension compared to Mongu is likely to be “a real characteristic of the aerosol transported to this area, rather than an artefact”, with aging over the several days of transport over the Ocean being one of the possible causes.
3.2. Relative Humidity Variations
The increase in size of the smoke particles over the ocean is likely due to swelling of the particles by water uptake which might have a signature in the relative humidity (RH) profiles.
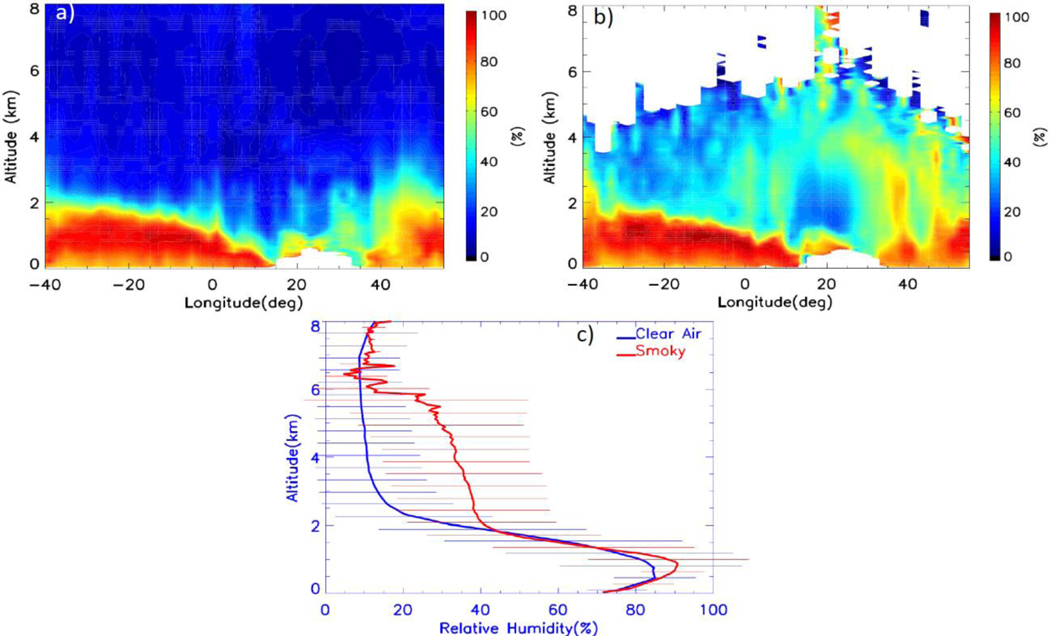
Figures 4a and 4b show the height longitude distribution of RH from MERRA-2 as available in CALIPSO data files averaged over 25°S-equator, for August 2006–2010 nighttime data. The clear air RH profiles correspond to cloud free and aerosol free columns within this area, while the smoky profiles correspond to columns that are cloud free but contain smoke samples (essentially corresponding to Figure 2b). Enhanced RH values seem to be associated with the biomass burning smoke plumes. As can be seen in Figure 4c, there is a notable difference between the two mean RH profiles between 2 km and 6 km (over the Atlantic ocean, 0–25°S, 30°W-10°E) where the RH values for the mean smoky profile are larger than in the clear air mean profile. Adebiyi et al. (2015) had earlier shown that the RH profiles from MERRA on average tend to reproduce the large scale features from high resolution radiosonde profiles obtained at St. Helena Island (~16°S, 6°W), which is located near the southern parts of this study region. The deviation in the mean RH profiles between MERRA and radiosondes is ~10% (Adebiyi et al., 2015). However the bias changes sign around 700 hPa. Below this pressure level, MERRA profiles have a low bias as compared to sondes; above this pressure level, they have a higher bias. Note, however, that Adebiyi et al. (2015) used an earlier version of the MERRA product, and not the MERRA-2 reanalyses.
Figure 4.
Height longitude cross sections (0–25°S) of relative humidity for a) clear air profiles, b) profiles with smoke samples in them, and c) averaged profiles and standard deviations of relative humidity over the Atlantic Ocean (0–25°S, 30°W-10°E), using all data for August, 2006–2010.
The mid-tropospheric difference between the smoky and the clear air RH profiles in Figure 4c is quite similar to the results of Adebiyi et al. (2015) at St. Helena Island, representing the difference between polluted and non-polluted conditions in September-October. Adebiyi et al. (2015) presented individual CALIPSO smoke extinction profiles which often closely matched that of the radiosonde RH profiles at St. Helena with high RH values (~ 80%) at the top of the smoke layer with the largest extinctions. In contrast, the RH profiles for the non-smoke days showed much lower RH values (≤ 20%) in the mid troposphere. Adebiyi et al. (2015) did not discuss the possible swelling effects on the smoke particles, though they did mention the possibility of this occurring. The increase in moisture collocated with increased aerosol loading suggests an environment conducive for swelling of smoke particles. The increase in particulate color ratio of the smoke particles suggesting increased size is thus quite consistent with this scenario.
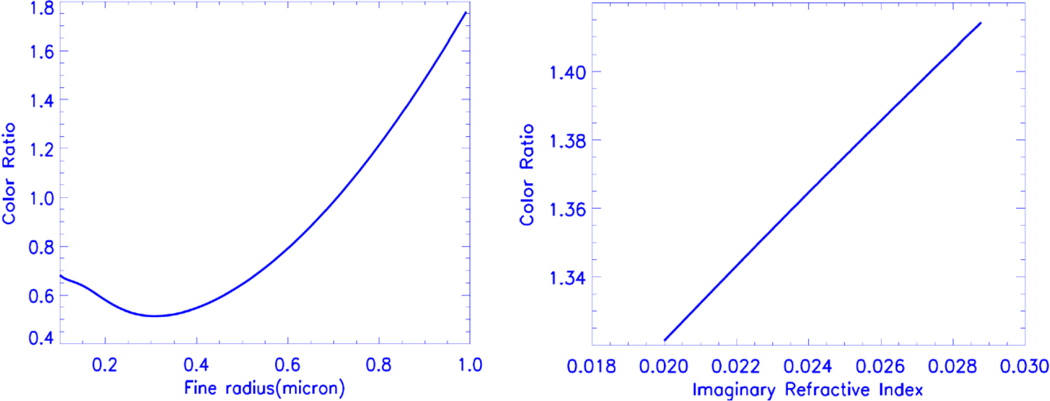
In Figure 5a and Figure 5b above we investigate the changes in color ratio as a function of mean fine radius and imaginary refractive index, respectively, using Mie scattering models. The inputs of the fixed parameters, i.e., real part of the refractive index, coarse mode parameters, type and standard deviation of the distributions are from the CALIPSO smoke parameters in Table 1 of Omar et al. [2009]. Figure 5a shows that the color ratio initially decreases until some critical value and then increases rapidly with fine radius. This critical value is quite sensitive to the ratio of fine to coarse mode used in the computation. However this ratio is not well constrained by observations and is highly dependent on the air mass type. Nonetheless, it can be seen that a color ratio increment from about 0.6 to 1.0 indicates a fine radius change of about 0.25 μm or so. Also as the particle takes up water, the imaginary refractive index of the activated particle will decrease since the imaginary refractive index of water is close to zero. Figure 5b shows that the color ratio will tend to decrease with decreasing imaginary refractive index. However, the change in the color ratio as a function of the radius is far larger than as a function of imaginary refractive index. Thus our observation of the increase in color ratio in the moist transported plumes over the Atlantic Ocean is likely to be the result of an increase in the size of the fine mode particles.
Figure 5.
Change in the color ratio with fine radius and imaginary refractive index from Mie calculations.
3.3. Particulate depolarization of smoke
The particulate depolarization ratio (i.e., the ratio of the backscatter in the perpendicular and parallel channels at 532 nm) reported in the CALIPSO data provides insight into the shape of the scattering particles. The particulate depolarization ratio values for the various aerosol subtypes range between 0 and ~0.5, with a mean value of about 0.04–0.05 for smoke and polluted continental to 0.27 for dust (Liu et al., 2015). Polluted dust has a mean value of about 0.13 and marine near 0.02 and dusty marine about 0.15. The values of the estimated uncertainties for the various subtypes peak in the range of 200%−300%. In general, swelling might be expected to enhance the sphericity of particles. However, because biomass burning typically generates quasi-spherical particles having low depolarization ratios (Burton et al., 2013), it may be difficult to detect further changes in particle shape using this measurement.
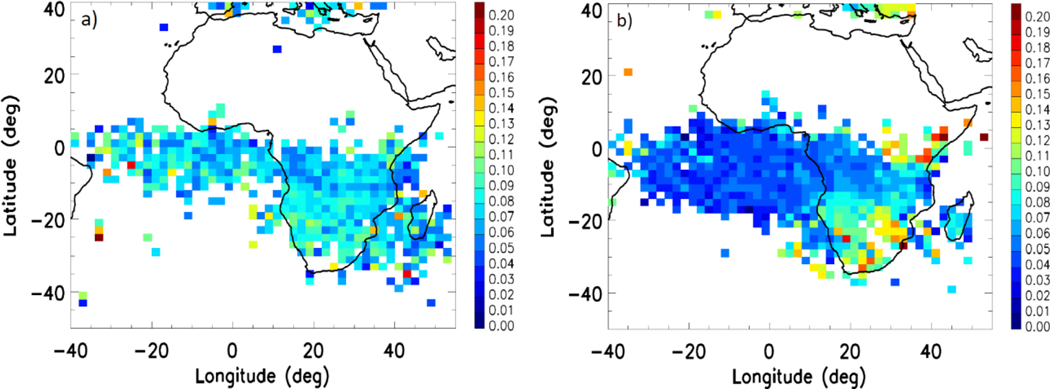
Figure 6a shows the spatial distribution of the particular depolarization of smoke samples at 3 km from CALIPSO, once again using only nighttime cloud free profiles in August for 2006–2010. We rejected depolarization data having estimated relative uncertainty above 500%. This criterion removes data points with very low negative particulate depolarization with associated uncertainties much higher than 500%. There is significant noise in the data with only a suggestion of a somewhat higher depolarization over the land areas over South Africa as compared to the oceanic regions. As an independent measurement, Figure 6b shows the spatial distribution of the volume depolarization of smoke at 3 km at 1064 nm as observed by the CATS lidar for August 2015–2016. The CATS data products do not report particulate depolarization ratios. However, because molecular contributions to the backscatter signal at 1064 nm are substantially smaller than at 532 nm (by a factor of ~17), the CATS 1064 nm volume depolarization ratios should provide essentially the same information as the particulate depolarization ratios. The effect of swelling is seen a bit more clearly in the CATS 1064 nm depolarization ratio data with somewhat higher values over the source regions in southern Africa and falling off over the Atlantic Ocean. The significantly higher depolarization of smoke particles south of 18°S may be related to aging of the particles in the anticyclonic gyre over this region (Figure 2a). In general the burning over Southern Africa takes place in dry conditions and produces soot particles which tend to be non-spherical as compared to the wet burning near the equator (Midzak et al., 2017). Note that CATS data products are only available at 1064 nm, so we cannot confirm the changing color ratio using the CATS data.
Figure 6.
a) Particulate depolarization of smoke at 532 nm at 3 km from CALIPSO for August, 2006–2010 and b) volume depolarization of smoke at 1064 nm at 3 km from CATS for August 2015–2016. A minimum number of 15 samples per grid box was used for each plot. Only nighttime were used from both instruments.
4. Discussion and Conclusions:
We have presented evidence of an increase in the size of smoke particles that are transported over the South Atlantic Ocean in large amounts from the biomass burning regions of South Africa as reflected in the particulate color ratios retrieved from the CALIPSO space borne lidar. The enhanced RH profiles for smoke samples in the mid troposphere as compared to the clear air samples suggests an association with water uptake by these particles. As such, there have been reports of significantly increased moisture content in biomass burning smoke plumes, particularly for smoldering fires (Achtemeir, 2006, Clements et al., 2006). In Southern Africa, smoldering fires may be more frequent towards the equator during the wet season (Midzak et al., 2017). A number of studies have confirmed the hygroscopicity of smoke under certain conditions. Semeniuk et al. (2007) studied the hygroscopic behavior of 80 aerosol particles sampled from southern African burning sources during the SAFARI 2000 mission, which included tar balls and soot, as well as mixed particles. While tar balls and soot were found to be hydrophobic, mixed particles and particles with inorganic coatings showed significantly enhanced hygroscopicity. A similar conclusion about the effect of inorganic material substantially increasing the hygroscopicity of smoke from Siberian fires was also reached by Popovicheva et al. (2016). Further, Vakkari et al. (2014) found that the hygroscopicity of smoke particles, again sampled from South African biomass burning areas, can increase rapidly within the first 2–4 hours due to oxidation and secondary aerosol formation. Aging and further oxidation of the smoke particles as they are transported to vast distances over the ocean may lead to further water uptake. It is possible that there might be other contributing mechanisms apart from swelling. Radke et al. (1995) had made aircraft observations of a large smoke plume that originated in Oregon and was transported over the Pacific Ocean for about 3 days travelling over 1000 km. They found an increase in the size of the accumulation mode particles and argued that coagulation might have been underestimated as a causative mechanism for size changes in smoke plumes. However Radke et al. (1995) did not consider the possible effects of swelling, which seems to be a more likely explanation for our scenario given the correlation with RH as was also observed by Adebiyi et al. (2015) over St. Helena.
To our knowledge, this is the first report of a change in size distribution of smoke particles as evidenced from satellite data over this area far from the source regions and is generally consistent with the AERONET finding of a significant increase in rv,f at Ascension Island as compared to Mongu (Sayer et al., 2014). This is an important result, insofar as the aerosol indirect effect depends strongly on the size of the particles (Spracklen et al., 2011). The enhanced moisture associated with the smoke particles may also be important for radiative forcing and leads to a cooling in September-October in this area (Adebiyi et al., 2015). The size increase of smoke particles in this area should also provide important constraints for simulations of this southern African smoke transport which show significant discrepancies compared to observations (Das et al., 2017). Therefore, this finding needs to be explored further using field missions as well as with satellite data. In fact, a major field mission, ORACLES, is currently studying the aerosol and cloud properties over this very region, and the ORACLES measurements should provide a wealth of resources to validate the results presented here.
5. Acknowledgements:
The CALIPSO aerosol and cloud profile data as well as the CATS lidar data are available at the NASA Langley Research Center Atmospheric Science Data Center. The MERRA 2 wind data were taken from the MERRA-2 Giovanni instance.
References:
- Achtemeier GL(2006): Measurements of moisture in smoldering smoke and implications for fog, Int. J. Wildland Fire, 15, 517–525. [Google Scholar]
- Adebiyi AA et al. (2015), The convolution of dynamics and moisture with the presence of shortwave absorbing aerosols over the Southeast Atlantic, J. Clim, 28, 1997–2024, doi: 10.1175/J-CLI-D-14-00352.1. [DOI] [Google Scholar]
- Bibi H, Alam K. and Bibi S, (2016): “In-depth discrimination of aerosol types using multiple clustering techniques over four locations in Indo-Gangetic plains”, Atmos. Res, 181, 106–114, doi: 10.1016/j.atmosres.2016.06.017. [DOI] [Google Scholar]
- Bond TC et al. (2013), Bounding the role of black carbon in the climate system: A scientific assessment, J. Geophys. Res, 118, 5380–5552, doi: 10.1002/jgrd.50171. [DOI] [Google Scholar]
- Burton SP, et al. (2013), Aerosol Classification from Airborne HSRL and Comparisons with the CALIPSO Vertical Feature Mask. Atmos. Meas. Tech, 6, 1397–1412. [Google Scholar]
- Chand D. et al. (2008): Quantifying above-cloud aerosol using spaceborne lidar for improved understanding of cloudy-sky direct climate forcing, J. Geophys. Res, 113, D13206, doi: 10.1029/007JD009433. [DOI] [Google Scholar]
- Chand D, et al. (2009): Satellite-derived direct radiative effect of aerosols dependent on cloud cover, Nature Geosc., 2, 181–184,doi: 10.1038/NGE0437. [DOI] [Google Scholar]
- Clements CB, Potter BE, and Zhong S. (2006).: In situ measurements of water vapor, heat, and CO2 fluxes within a prescribed grass fire, Int. J. Wildland Fire, 15, 299–306. [Google Scholar]
- Das S, et al. , (2017), Biomass burning aerosol transport and vertical distribution over the South African-Atlantic region, J. Geophys. Res, 122, doi: 10.1002/2016JD026421. [DOI] [Google Scholar]
- Getzewich BJ, et al. (2015): “CALIOP Calibration: Version 4.0 Algorithm Updates”, The 27th International Laser Radar Conference (ILRC 27), EPJ Web of Conferences, 119, 04013, doi: 10.1051/epjconf/201611904013. [DOI] [Google Scholar]
- Intergovernmental Panel on Climate Change, IPCC, (2013), Climate Change 2013: The physical science basis. The contribution of working group I to the Fifth Assessment Report of the Intergovernmental Panel on Climate Change. [Google Scholar]
- Jethva H, et al. , (2013), A color ratio method for simultaneous retrieval of aerosol and cloud optical thickness of above-cloud absorbing aerosols from passive sensors: Application to MODIS measurements, IEEE Trans. Geosci. Remote, 51, 3862–3870, doi: 10.1109/TGRS.2012.2230008. [DOI] [Google Scholar]
- Jethva H et al. , (2016), Validating MODIS above-cloud aerosol optical depth retrieved from “color ratio” algorithm using direct measurements made by NASA’s airborne AATS and 4STAR sensors, Atmos. Meas. Tech, 9, 5053–5062. [Google Scholar]
- Liu Z, et al. (2009): The CALIPSO Lidar Cloud and Aerosol Discrimination: Version 2 Algorithm and Initial Assessment of Performance, J. Atmos. Oceanic Technol, 26, 1198–1213, doi: 10.1175/2009JTECHA1229.1. [DOI] [Google Scholar]
- Liu Z, et al. , 2015: Evaluation of CALIOP 532-nm AOD over Opaque Water Clouds, Atmos. Chem. Phys, 15, 1265–1288, doi: 10.5194/acp-15-1265-2015. [DOI] [Google Scholar]
- Meyer K, Platnick S. and Zhang Z, (2015), Simultaneously inferring above-cloud absorbing aerosol optical thickness and underlying liquid phase cloud optical and microphysical properties using MODIS, J. Geophys Res, 120, 5524–5547, doi: 10.1002/2015JD023128. [DOI] [Google Scholar]
- Midzak N. et al. (2017), Determining smoke particle sphericity using CATS data, paper presented at the 97th Annual Meeting of the American Meteorological Society, Seattle, Jan 22–27, 2017. [Google Scholar]
- Mielonen T. et al. (2009). Comparison of CALIOP Level 2 aerosol subtypes to aerosol types derived from AERONET inversion data. Geophys. Res. Lett, 36, L18804. [Google Scholar]
- Misra AK et al. (2013). Study of MPLNET-derived aerosol climatology over Kanpur, India and validation of CALIPSO Level 2 version 3 backscatter and extinction products. J. Atmos. Oceanic Technol, 29, 1285–1294. [Google Scholar]
- Omar A. et al. (2009), The CALIPSO automated aerosol classification and lidar ratio selection algorithm, J. Atmos. Oceanic Technol, 26, 1994–2014. [DOI] [PMC free article] [PubMed] [Google Scholar]
- Popovicheva OB, et al. (2016), Small-scale study of Siberian biomass burning: II. Smoke hygroscopicity Aerosol and Air Quality Res., 16, 1558–1568. [Google Scholar]
- Radke LF et al. , (1995), Effects of aging on the smoke from a large forest fire, Atmos. Res, 38, 315–332. [Google Scholar]
- Randles CA et al. , (2016), The MERRA-2 aerosol assimilation, NASA/TM–2016–104606 / Vol.45, vol. 45, ed. Koster RD. [Google Scholar]
- Reid JS et al. (2005), A review of biomass burning emissions part III. Intensive optical properties of biomass burning particles, Atmos. Chem. Phys, 5, 827–849. [Google Scholar]
- Saide PE (2015): Central American biomass burning smoke can increase tornado severity in the U.S, Geophys. Res. Lett, 42, 956–965, doi: 10.1002/2014GL062826. [DOI] [Google Scholar]
- Sayer AM, et al. (2014), AERONET-based models of smoke-dominated aerosol near source regions and transported over oceans, and implications for satellite retrievals of aerosol optical depth, Atmos. Chem. Phys, 14, 11493–11523. [Google Scholar]
- Sayer AM et al. , (2016), Extending “deep blue” aerosol retrieval coverage to cases of absorbing aerosols above clouds: Sensitivity analysis and first case studies, J. Geophys. Res, 121, 4830–4854, doi: 10.1002/2015JD024729. [DOI] [Google Scholar]
- Semeniuk TA, et al. (2007), Hygroscopic behavior of aerosol particles from biomass fires using environmental transmission electron microscopy, J. Atmos. Chem, 56, 259–273. [Google Scholar]
- Spracklen DV et al. , (2011), Global cloud condensation nuclei influenced by carbonaceous combustion aerosol, Atmos. Chem. Phys, 11, 9067–9087. [Google Scholar]
- Swap RJ, et al. , (2003), Africa burning: A thematic analysis of the Southern African Regional Science Initiave (SAFARI 2000), J. Geophys. Res, 108, 8465, doi: 10.1029/2003JD003747. [DOI] [Google Scholar]
- Vakkari V, et al. (2014), Rapid changes in biomass burning aerosols by atmospheric oxidation, Geophys. Res. Lett, 41, 2644–2651, doi: 10.1002/2014GL059396. [DOI] [Google Scholar]
- Van der Werf GR, et al. (2010), Global fire emissions and the contribution of deforestation, savanna, forest, agricultural, and peat fires (1997–2009), Atmos. Chem. Phys, 10, 11707–11735. [Google Scholar]
- Vaughan M, et al. (2009): Fully Automated Detection of Cloud and Aerosol Layers in the CALIPSO Lidar Measurements, J. Atmos. Oceanic Technol, 26, 2034–2050, doi: 10.1175/2009JTECHA1228.1. [DOI] [Google Scholar]
- Waquet F. et al. , (2013), Retrieval of aerosol microphysical and optical properties above liquid clouds from POLDER/PARASOL polarization measurements, Atmos. Meas. Tech, 6, 991–1016, [Google Scholar]
- Wilcox EM, (2012), Direct and semi-direct radiative forcing of smoke aerosols above clouds, Atmos. Chem. Phys, 12, 139–149. [Google Scholar]
- Winker DM et al. , (2009), Overview of the CALIPSO mission and CALIOP data processing algorithms, J. Atmos. Oceanic Technol, 26, 2310–2323. [Google Scholar]
- Yorks JE et al. (2016), An overview of the CATS Level 1 processing algorithms and data products, Geophys. Res. Lett, 43, 4632–4639, doi: 10.1002/2016GL068006. [DOI] [Google Scholar]
- Yu H. and Zhang Z, (2013), New directions: Emerging satellite observations of above-cloud aerosols and direct radiative forcing, Atmos. Environ, 72, 36–40. [Google Scholar]
- Zuidema P. et al. , (2016): Smoke and Clouds above the Southeast Atlantic: Upcoming Field Campaigns Probe Absorbing Aerosol’s Impact on Climate, BAMS, 97, 1131–1135, doi: 10.1175/BAMS-D-15-00082.1. [DOI] [Google Scholar]


