

The study illustrates a crucial role of tissue microenvironment in mediating endothelial dropout and vascular rarefaction.
Abstract
Endothelial cell injury leading to microvascular rarefaction is a characteristic feature of chronic kidney disease (CKD). However, the mechanism underlying endothelial cell dropout is poorly defined. Here, we show a central role of the extracellular microenvironment in controlling endothelial cell survival and proliferation in CKD. When cultured on a decellularized kidney tissue scaffold (KTS) from fibrotic kidney, endothelial cells increased the expression of proapoptotic proteins. Proteomics profiling identified fibrillin-1 (FBN1) as a key component of the fibrotic KTS, which was up-regulated in animal models and patients with CKD. FBN1 induced apoptosis of endothelial cells and inhibited their proliferation in vitro. RNA sequencing uncovered activated integrin αvβ6/transforming growth factor–β signaling, and blocking this pathway abolished FBN1-triggered endothelial injury. In a mouse model of CKD, depletion of FBN1 ameliorated renal fibrotic lesions and mitigated vascular rarefaction. These studies illustrate that FBN1 plays a role in mediating vascular rarefaction by orchestrating a hostile microenvironment for endothelial cells.
INTRODUCTION
Chronic kidney disease (CKD) has become a major public health problem worldwide. The prevalence of CKD is high, ranging from 10 to 13% in the adult population (1, 2). A considerable number of patients with CKD will eventually progress to end-stage renal disease, a devastating condition that needs renal replacement therapy. Irrespective of the initial causes, CKD progression is characterized by unresolved inflammation, tubular atrophy, interstitial fibrosis, and peritubular capillary rarefaction (3–6). Microvascular rarefaction, as defined by a decreased capillary density, presumably results from endothelial cell apoptosis, detachment, or dysfunction (7, 8). However, the cause and underlying mechanism of endothelial cell dropout in the setting of CKD is poorly understood.
Vascular endothelial cells are a layer of flat cells located between the blood vessel wall and the bloodstream (9). They can not only sense information such as inflammatory signals, hormones, shear stress, and pressure in the blood but also play an important role in maintaining vascular tone and normal blood flow and regulating inflammation and angiogenesis (9). Not unexpectedly, vascular rarefaction impairs capillary function and reduces blood supply, leading to ischemic and hypoxic conditions, and accelerates CKD progression (10, 11). Extensive studies have shown that vascular rarefaction is closely associated with the development, progression, and severity of CKD in patients (11, 12). Despite the intense investigation during the past several decades, relatively little is known about the cues that cause endothelial cell loss in CKD. Many earlier studies are focused on the dysregulation of angiogenic factors such as vascular endothelial growth factor (VEGF) (13–15). However, interventional manipulations of these factors for treatment of CKD often results in inconsistent outcomes (13, 16, 17). These perplexing findings prompt us to search for a new regulatory system and rethink the biology and pathology underlying vascular rarefaction.
The sites of vascular rarefaction are not evenly distributed throughout renal parenchyma in CKD, suggesting that local tissue microenvironment may play a decisive role in this process. We recently showed that kidney injury induces marked changes in the makeup and nature of the extracellular matrix (ECM), leading to the formation of unique fibrogenic niche (18). Using a decellularized kidney tissue scaffold (KTS), we demonstrate that fibroblasts and tubular epithelial cells inoculated on KTS from normal and fibrotic kidneys behave quite differently (18, 19). These observations make us speculate that tissue microenvironment may also play a role in determining endothelial cell fate after kidney injury. However, the identity of such an element in the fibrotic niche responsible for causing endothelial cell injury in CKD remains to be determined.
In this study, we report that fibrillin-1 (FBN1), a large ECM glycoprotein, is up-regulated in various CKDs and orchestrates a hostile microenvironment for endothelial cells, leading to vascular rarefaction. FBN1 induces endothelial cell apoptosis and inhibits mitogen-triggered proliferation. Our findings establish that an FBN1-enriched microenvironment plays a crucial role in driving endothelial cell injury and vascular rarefaction in CKD.
RESULTS
Fibrotic kidney matrix scaffold is a hostile environment for endothelial cells
We first investigated the effect of kidney tissue microenvironment on the biology of endothelial cells using an ex vivo model system. To this end, decellularized KTS was prepared from the contralateral (Ctrl) and obstructed kidneys at 3 weeks after unilateral ureteral obstruction (UUO) in pigs (fig. S1A), by using an established protocol described previously (18). As shown in fig. S1B, hematoxylin and eosin staining confirmed that all renal cells were completely removed from the KTS of Ctrl and UUO kidneys, with no nuclear staining. Morphologically, the KTS from the Ctrl kidney showed a continuous and well-organized matrix network (fig. S1B), whereas KTS from the UUO kidney displayed a disordered appearance with scattered scarring foci.
We then inoculated human umbilical vein endothelial cells (HUVECs) onto the KTS prepared from either control or fibrotic kidneys. We found that compared with the Ctrl-KTS, UUO-KTS rendered endothelial cells to apparently undergo apoptotic cell death after 2 days of incubation. As shown in fig. S1 (C to I), Western blotting showed that UUO-KTS induced the expression of various apoptosis-related proteins such as cleaved caspase-3, poly [ADP (adenosine 5′-diphosphate)–ribose] polymerase 1 (PARP-1), Fas, Fas ligand (FasL), Fas-associated death domain protein (FADD), and p53. Furthermore, KTS from fibrotic kidney also promoted the expression of endothelin 1 (ET-1) (fig. S1, C and J), a marker of endothelial cell injury (20).
We also assessed the ability of endothelial cells to proliferate in response to mitogen stimulation when cultured on KTS. As shown in fig. S1 (K to M), UUO-KTS inhibited the expression of c-Fos and cyclin D1, two proliferation-related proteins, in HUVECs in response to mitogen stimulation. Together, these results unambiguously demonstrate that the KTS from the fibrotic kidney is a hostile environment for endothelial cells by inhibiting their survival and proliferation.
FBN1 is a major component of the fibrotic tissue microenvironment
To identify the component of the fibrotic KTS that is responsible for endothelial cell injury, we analyzed the composition and differences of the KTS proteins from normal and fibrotic kidneys by using an unbiased, mass spectrometry (MS) proteomics approach (Fig. 1A). As shown in the Venn diagram (Fig. 1B), there were 843 proteins that were present commonly in the KTS of both normal (sham) and CKD [unilateral ischemic-reperfusion injury (UIRI)] kidneys. However, 89 proteins were expressed only in sham KTS, while 325 proteins were present only in CKD KTS (Fig. 1B). The differentially expressed proteins are further plotted on the volcano map (Fig. 1C). FBN1, a large ECM glycoprotein (21), was identified as one of the most up-regulated proteins (Fig. 1C). Western blot analyses confirmed an up-regulated FBN1 protein in the KTS prepared from CKD kidney, compared with that from control kidney (Fig. 1D).
Fig. 1. MS proteomics analysis identifies FBN1 as a major component of fibrotic KTS.
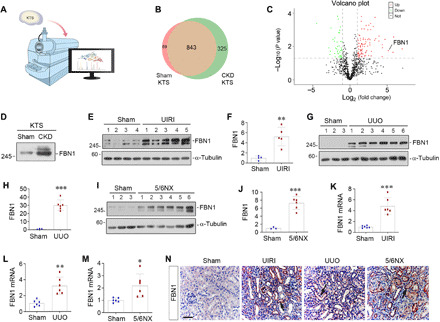
(A) Diagram shows using the MS proteomics approach to identify the different composition of the KTS from sham and CKD kidneys. (B) The Venn diagram shows the differentially expressed proteins in sham and CKD KTS. (C) The volcano diagram displays the differentially expressed proteins in the KTS of the two groups. FBN1 was highlighted as one of the most up-regulated proteins in CKD KTS. The red dots represent the proteins up-regulated in CKD KTS, while green dots show proteins down-regulated. The black dots denote proteins with no change in abundance between the two groups. (D) KTS prepared from CKD kidney is rich in FBN1 protein. Western blot analysis shows the level of FBN1 in different groups as indicated. (E and F) FBN1 expression is induced in the kidney after UIRI. Western blot analyses show the levels of FBN1 in different groups as indicated. Representative Western blot (E) and quantitative data (F) are shown. (G and H) Renal FBN1 expression is induced after UUO. Western blot analyses show the levels of FBN1 in different groups as indicated. Representative Western blot (G) and quantitative data (H) are shown. (I and J) FBN1 protein is induced in the kidney after 5/6NX. Representative Western blot (I) and quantitative data (J) are shown. **P < 0.01 and ***P < 0.001 versus sham. (K to M) qRT-PCR analyses show renal mRNA levels of FBN1 after UIRI (K), UUO (L), and 5/6NX (M), respectively. *P < 0.05, **P < 0.01, and ***P < 0.001 versus sham (n = 6). (N) Representative micrographs show renal expression and localization of FBN1 protein in different groups as indicated. FBN1 was detected by immunohistochemical staining. Arrows indicate positive staining. Scale bar, 50 μm.
To investigate FBN1 regulation after kidney injury in vivo, we examined its expression in three well-characterized models of renal fibrosis induced by UIRI, UUO, and 5/6 nephrectomy (5/6NX). As shown in Fig. 1 (E to J), little FBN1 protein was detected in sham control kidney by Western blot analyses. However, marked induction of FBN1 was found in the fibrotic kidneys after UIRI, UUO, or 5/6NX, respectively, suggesting an induction of FBN1 expression commonly in different models of CKD in vivo. Similar results were obtained when renal mRNA level of FBN1 was assessed by quantitative real-time reverse transcription polymerase chain reaction (qRT-PCR) (Fig. 1, K to M).
We further examined the expression and localization of FBN1 in the fibrotic kidney by immunohistochemical staining. As shown in Fig. 1N, FBN1 was virtually undetectable in sham-operated normal kidney, but induced in the fibrotic kidneys after UIRI, UUO, and 5/6NX. FBN1 protein was predominantly localized in the renal tubular epithelium of diseased kidneys (Fig. 1N and fig. S2A). Staining for FBN1 and endomucin (EMCN), an endothelial marker, revealed an inverse relationship between FBN1 level and endothelial density in kidney parenchyma (fig. S2, B and C), implying that FBN1-enriched microenvironment plays a role in vascular rarefaction.
FBN1 promotes endothelial cell apoptosis in vitro
To test whether FBN1 is directly responsible for mediating endothelial cell injury, we next examined its effect on endothelial cell apoptosis in vitro. To this end, HUVECs were incubated with recombinant human FBN1 protein for 2 days, and cell apoptosis was assessed by flow cytometry. As shown in Fig. 2 (A and B), compared with the control group, FBN1 triggered substantial apoptosis in cultured HUVECs as illustrated by flow cytometry–based apoptosis detection. Terminal deoxynucleotidyl transferase–mediated deoxyuridine triphosphate nick end labeling (TUNEL) staining also showed a marked increase in apoptosis of HUVECs after FBN1 treatment (Fig. 2, C and D).
Fig. 2. FBN1 induces endothelial cell apoptosis in vitro.
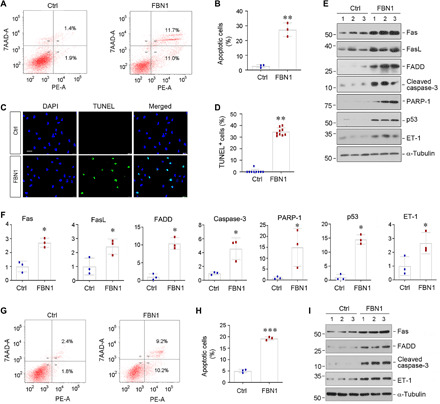
(A and B) Flow cytometry shows HUVEC apoptosis after incubation with recombinant human FBN1 protein (50 ng/ml) for 2 days. Representative flow cytometry histograms (A) and quantitative data (B) are shown. Both attached and detached cells were collected for flow cytometric analysis. **P < 0.01 versus control group. (C and D) TUNEL staining shows an increased apoptosis of HUVECs after incubation with FBN1. Representative micrographs of TUNEL staining (C) and quantitative data (D) are presented. Scale bar, 50 μm. **P < 0.01 versus control group. (E and F) Western blot analyses show that FBN1 induced the expression of many apoptosis-related proteins in HUVECs. HUVECs were incubated in the absence or presence of FBN1 (50 ng/ml) for 2 days, and cell lysates were then subjected to Western blot analyses for Fas, FasL, FADD, cleaved caspase-3, PARP-1, p53, ET-1, and α-tubulin. Representative Western blot (E) and quantitative data (F) are shown. *P < 0.05 versus controls. (G and H) Flow cytometry shows human renal glomerular endothelial cell (HRGEC) apoptosis after incubation with recombinant human FBN1 protein (50 ng/ml) for 2 days. Representative flow cytometry histograms (G) and quantitative data (H) are shown. Both attached and detached cells were collected for flow cytometric analysis. ***P < 0.001 versus control group. (I) Representative Western blot analyses show that FBN1 induced the expression of Fas, FADD, cleaved caspase-3, and ET-1 proteins in HRGECs. HRGECs were incubated in the absence or presence of FBN1 (50 ng/ml) for 2 days.
We further examined the expression of various apoptosis-related proteins in endothelial cells after FBN1 treatment. As shown in Fig. 2 (E and F), Western blotting revealed that FBN1 induced the expression of Fas, FasL, FADD, cleaved caspase-3, PARP-1, and p53 in HUVECs. In addition, ET-1 protein was also induced by FBN1 (Fig. 2, E and F). Furthermore, when FBN1 was coated on culture plates, it also induced the expression of proapoptotic proteins such as Fas, FADD, and cleaved caspase-3 in HUVECs (fig. S3, A to D). These results suggest that FBN1 embedded in the fibrotic KTS is sufficient to cause apoptotic death of endothelial cells.
We also examined the effect of FBN1 on human renal glomerular endothelial cells (HRGECs). As shown in Fig. 2 (G and H), FBN1 also induced HRGEC apoptosis as detected by flow cytometry. Likewise, incubation of HRGECs with FBN1 promoted Fas, FADD, cleaved caspase-3, and ET-1 expression (Fig. 2I and fig. S3, E to H). FBN1 also increased HRGEC detachment (fig. S3, I and J). However, incubation of human kidney proximal tubular epithelial cells (HK-2) with FBN1 did not affect their apoptosis and survival (fig. S3, K to N), suggesting that the proapoptotic effect of FBN1 is specific to endothelial cells.
FBN1 inhibits endothelial cell proliferation in response to mitogen in vitro
We next examined the effect of FBN1 on the proliferation of endothelial cells. To this end, we incubated HUVECs with different concentrations of recombinant human FBN1 protein for 48 hours. As shown in Fig. 3A, by using a quantitative colorimetric 3-(4,5-dimethylthiazol-2-yl)-2,5-diphenyl-tetrazolium bromide (MTT) assay, we found that FBN1 substantially decreased the number of HUVECs in a dose-dependent manner, indicating that FBN1 hinders HUVEC proliferation. Further cell cycle analysis using flow cytometry revealed that the percentage of cells in the S-phase was increased in HUVECs in response to mitogen stimulation with fetal bovine serum (FBS), whereas incubation with FBN1 reduced the S-phase cell population (Fig. 3, B to E). Similar results were obtained by 5-ethynyl-2′-deoxyuridine (EdU) incorporation assay, a sensitive method to detect and quantify DNA synthesis and cell proliferation. As shown in Fig. 3 (F and G), FBN1 inhibited EdU incorporation in endothelial cells in response to mitogen stimulation, indicating its ability to inhibit cell cycle entry and subsequent DNA synthesis. Consistently, Western blotting also demonstrated that FBN1 suppressed the expression of multiple proliferation-related proteins in HUVECs, such as proliferating cell nuclear antigen (PCNA), cyclin D1, c-Fos, and c-Myc (Fig. 3, H to L). Together, these results indicate that FBN1 inhibits the expression of a host of proliferation-related genes and hinders endothelial cell proliferation in response to mitogen.
Fig. 3. FBN1 inhibits endothelial cell proliferative response to mitogen in vitro.
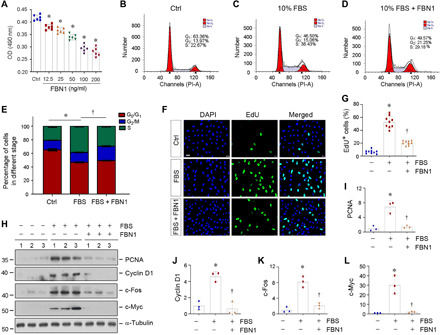
(A) Quantitative colorimetric MTT assay shows that FBN1 inhibited HUVEC proliferation in a dose-dependent manner. OD, optical density. HUVECs were incubated with different concentrations of FBN1 protein as indicated for 2 days. *P < 0.05 versus controls. (B to E) Flow cytometry shows the distribution of different phases in cell cycle in HUVECs after incubation with 10% FBS in the absence or presence of FBN1 (50 ng/ml) for 2 days. Representative flow cytometry histograms (B to D) and quantitative data (E) are shown. *P < 0.05 versus control group (n = 3), †P < 0.05 versus 10% FBS group (n = 3). (F and G) EdU incorporation assay shows that FBN1 (50 ng/ml) inhibited mitogen-mediated DNA synthesis by reducing EdU incorporation in HUVECs. Representative EdU incorporation assay (F) and quantitative data (G) are shown. *P < 0.05 versus control (n = 3), †P < 0.05 versus 10% FBS group (n = 3). (H) Representative Western blot analyses show that FBN1 inhibited the expression of numerous proliferation-related proteins in endothelial cells. HUVECs were incubated with FBN1 (50 ng/ml) in the absence or presence of 10% FBS for 2 days. Cell lysates were subjected to Western blot analyses for PCNA, cyclin D1, c-Fos, c-Myc, and α-tubulin. (I to L) Graphic presentation shows the relative levels (fold induction over the controls) of PCNA (I), cyclin D1 (J), c-Fos (K), and c-Myc (L) in different groups as indicated. *P < 0.05 versus controls (n = 3).
FBN1 activates integrin αvβ6/transforming growth factor–β signaling
To delineate the mechanism by which fibrotic KTS drives endothelial cell injury, we investigated the gene expression profile of endothelial cells cultured on different KTS from control and UUO kidneys by using an unbiased RNA sequencing (RNA-seq) transcriptome profiling approach. As shown in Fig. 4A, the mRNA clustering displayed substantial differences in gene expression between endothelial cells cultured on Ctrl-KTS versus UUO-KTS. By analyzing the differentially expressed genes in two groups, we found a total of 3340 differentially expressed mRNA. Among them, 2128 mRNAs were up-regulated in HUVECs cultured on UUO-KTS, whereas 1212 were down-regulated, compared with Ctrl-KTS (Fig. 4B). In particular, the expression of key apoptosis-related genes including CASP3 and FADD was up-regulated in HUVECs cultured on UUO-KTS. Integrin genes such as ITGAV and ITGB6 and TGFB1 were also induced in endothelial cells cultured on UUO-KTS (Fig. 4B).
Fig. 4. FBN1 activates integrin αvβ6/TGF-β1/Smad3 signal cascade in vitro.
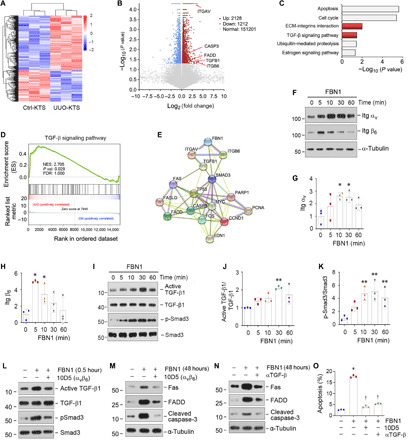
(A) Gene expression profiling by RNA-seq shows differential gene clustering of HUVECs when cultured on Ctrl-KTS or UUO-KTS for 24 hours. (B) Volcano plot shows the differentially expressed genes of two groups as indicated. (C) KEGG enrichment analysis reveals that several signaling pathways as indicated were enriched. (D) GSEA enrichment analysis shows that TGF-β signaling was enriched in HUVECs cultured on UUO-KTS. NES, normalized enrichment score; FDR, false discovery rate. (E) Protein interaction network analysis shows strong interaction and intricate connection among FBN1, ITGAV, ITGB6, TGFB1, and other effectors involved in apoptosis and proliferation. ITGAV, integrin αv; ITGB6, integrin β6; TGFB1, TGF-β1. (F to H) FBN1 induces integrin αvβ6 expression in vitro. HUVECs were treated with FBN1 (50 ng/ml). Western blots (F) and quantitative data (G and H) are presented. *P < 0.05 (n = 3). (I to K) FBN1 induces TGF-β1 and Smad3 activation in vitro. HUVECs were treated with FBN1 (50 ng/ml). Western blots (I) and quantitative data (J and K) are presented. **P < 0.01 (n = 3). (L) Blockade of integrin αvβ6 abolishes TGF-β/Smad3 activation. HUVECs were preincubated with neutralizing antibody (10D5; 100 μg/ml) for 1 hour, followed by treatment with FBN1 for 0.5 hour. (M) Blocking of integrin αvβ6 signaling abolishes FBN1-induced apoptotic proteins. HUVECs were preincubated with 10D5 (100 μg/ml) for 1 hour, followed by FBN1 for 2 days. (N) Blockade of TGF-β1 signaling abolishes FBN1-induced apoptotic proteins. HUVECs were preincubated with TGF-β1 antibody (αTGF-β; 50 μg/ml) for 1 hour, followed by treatment with FBN1 for 2 days. (O) Blockade of either integrin αvβ6 or TGF-β1 ameliorates endothelial cell apoptosis. Flow cytometry assay showed the percentage of cell apoptosis in different groups. *P < 0.05 versus controls; †P < 0.05 versus FBN1 (n = 3).
Kyoto Encyclopedia of Gene and Genomes (KEGG) enrichment analysis of the differentially expressed genes revealed that several signaling pathways were enriched, including apoptosis, cell cycle, ECM-integrin interaction, transforming growth factor–β (TGF-β) signaling, ubiquitin-mediated proteolysis, and estrogen signaling (Fig. 4C). In addition, we performed gene set enrichment analysis (GSEA) of the differentially expressed genes in two groups and identified an enriched TGF-β signaling in endothelial cells cultured on UUO-KTS (Fig. 4D). Gene interaction network analysis also indicated that the TGF-β pathway was at the central position in the network connecting FBN1, integrin αvβ6, Smad3, and various regulators of apoptosis and proliferation (Fig. 4E).
To experimentally confirm these bioinformatics findings, we further studied the integrins and TGF-β signaling in HUVECs after FBN1 treatment in vitro. As shown in Fig. 4 (F to H), FBN1 rapidly induced integrin αv and β6 expression in HUVECs. FBN1 also induced activation of TGF-β1 and Smad3 phosphorylation, although it did not affect TGF-β1 and Smad3 abundances (Fig. 4, I to K).
Integrin αvβ6/TGF-β signaling is required for FBN1-induced endothelial cell injury
To assess whether integrin αvβ6 and TGF-β signaling is required for mediating FBN1-triggered endothelial cell injury, we carried out experiments by preincubating HUVECs with 10D5, a specific monoclonal antibody that functionally inhibits integrin αvβ6 (22). As shown in Fig. 4L and fig. S4 (A and B), blockade of integrin αvβ6 activation by 10D5 abolished FBN1-triggered TGF-β1 and Smad3 activation. Furthermore, 10D5 also inhibited FBN1-induced Fas, FADD, and cleaved caspase-3 expression in HUVECs (Fig. 4M and fig. S4, C to E).
We found that TGF-β1 activation was required for FBN1-induced endothelial cell apoptosis. As shown in fig. S4 (F and G), a neutralizing TGF-β1 antibody (αTGF-β) effectively blocked Smad3 phosphorylation induced by FBN1 in HUVECs. Moreover, blockade of TGF-β1 signaling by αTGF-β inhibited FBN1-induced Fas, FADD, and cleaved caspase-3 expression in HUVECs (Fig. 4N and fig. S4, H to J). Similarly, blockade of either integrin αvβ6 or TGF-β signaling by 10D5 or αTGF-β also abolished the FBN1-induced HUVEC apoptosis, as demonstrated by flow cytometry (Fig. 4O and fig. S4K). Collectively, these results indicate that FBN1 causes endothelial apoptosis by activating integrin αvβ6/TGF-β1 signaling.
We also investigated the potential role of other integrins in mediating FBN1-induced endothelial cell injury. As shown in fig. S5 (A to D), FBN1 did not affect integrin β1 and β3 expression and only slightly induced β5 in HUVECs. Furthermore, blocking αvβ3 and αvβ5 signaling by corresponding antibodies neither affected FBN1-induced Fas, FADD, and cleaved caspase-3 expression nor inhibited TGF-β1 activation (fig. S5, E to P). These results suggest that αvβ6 plays a major role in mediating FBN1-induced TGF-β activation and endothelial cell apoptosis.
Depletion of FBN1 ameliorates kidney injury and fibrosis in vivo
To investigate the role of FBN1 in the pathogenesis of CKD, we sought to knock down FBN1 expression by short hairpin RNA (shRNA)–mediated strategy in vivo. Specifically, mice were injected intravenously with either control-shRNA or FBN1-shRNA plasmid vectors at 4 days after UIRI (Fig. 5A). As illustrated in Fig. 5 (B and C), renal expression of FBN1 protein was abolished in UIRI mice after intravenous injection of FBN1 shRNA. Immunostaining for FBN1 protein expression demonstrated similar results (Fig. 5D).
Fig. 5. Knockdown of FBN1 ameliorates kidney injury and fibrosis after UIRI.
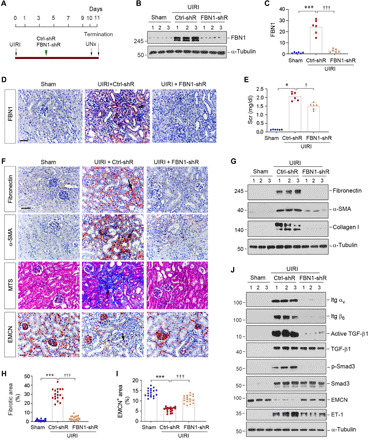
(A) Experimental design. Green arrow indicates the timing of injecting Ctrl-shR or FBN1-shR plasmids. Black arrows indicate the timing of IRI. UNx, unilateral nephrectomy. (B and C) Western blot analyses of renal FBN1 protein after UIRI. Representative Western blot (B) and quantitative data (C) are shown. ***P < 0.001; †††P < 0.001 (n = 6). (D) Micrographs show an effective knockdown of FBN1 protein in IRI kidney. Arrow indicates positive FBN1 expression. Scale bar, 50 μm. (E) Graphic presentation shows serum creatinine (Scr) levels in different groups. *P < 0.05 versus sham; †P < 0.05 versus Ctrl-shRNA (n = 6). (F) Micrographs show renal fibronectin, α-SMA, collagens, and EMCN at 11 days after UIRI in different groups. Scale bar, 50 μm. (G) Western blot analyses show renal expression of fibronectin, α-SMA, and collagen I proteins in different groups. (H) Graphic presentation of renal fibrotic lesions in different groups. Three images per kidney, and six mice per group, were assessed. ***P < 0.001 versus sham; †††P < 0.001 versus Ctrl-shRNA. (I) Graphic presentation of renal EMCN+ area in different groups. Three images per mouse kidney, and six mice per group, were assessed. ***P < 0.001 versus sham; †††P < 0.001 versus Ctrl-shRNA. (J) Western blot analyses show renal expression of integrin αv, integrin β6, active TGF-β1, TGF-β1, p-Smad3, Smad3, EMCN, and ET-1 proteins. Numbers (1 to 3) indicate each individual animal in a given group.
We next assessed the effects of FBN1 depletion on renal function and fibrotic lesions after UIRI. As shown in Fig. 5E, serum creatinine was increased at 11 days after UIRI, but FBN1 depletion reduced its levels. We further assessed the effects of FBN1 on the expression of several fibrosis-related proteins and kidney pathology (Fig. 5, F to I). Immunohistochemical staining and Western blotting showed that knockdown of FBN1 inhibited renal expression of fibronectin, α-smooth muscle actin (α-SMA), and collagen I in UIRI mice (Fig. 5, F and G, and fig. S6, A to C). Similar results were obtained when the mRNA abundance of renal fibronectin, α-SMA, and collagen I was assessed by qRT-PCR (fig. S6, D to F). As a result, FBN1 depletion also ameliorated collagen accumulation and fibrotic lesions in the kidney, as shown by Masson’s trichrome staining (MTS) (Fig. 5, F and H) and Sirius red staining (fig. S6, G and H). Therefore, these data indicate that FBN1 acts as a pathogenic mediator that promotes renal fibrosis.
Depletion of FBN1 inhibits integrin αvβ6/TGF-β1 signaling and mitigates microvascular rarefaction
To delineate the underlying mechanism of FBN1 action in vivo, we examined the role of integrin αvβ6/TGF-β1/Smad3 signal cascade in the pathogenesis of CKD. As shown in Fig. 5J and fig. S7 (A and B), renal expression of integrin αv and β6 was up-regulated in UIRI mice, whereas depletion of FBN1 abolished their induction. Similarly, both TGF-β1 and Smad3 were activated in the kidney after UIRI, which was abolished after FBN1 depletion (Fig. 5J and fig. S7, C and D). Depletion of FBN1 did not significantly affect integrin β1, β3, and β5 expression in vivo (fig. S7, E to H).
We next investigated the effects of FBN1 on renal endothelial injury in vivo. As shown in Fig. 5 (F to J) and fig. S7I, the expression of endothelial marker EMCN was inhibited in the kidney after UIRI, whereas knockdown of FBN1 largely restored its expression. Consistently, renal expression of ET-1 was induced in UIRI mice, and it was obliterated by FBN1 depletion (Fig. 5J and fig. S7J). Immunohistochemical staining revealed that compared with sham controls, EMCN-positive capillary endothelium was reduced in the kidney after UIRI (Fig. 5, F and I), illustrating microvascular rarefaction. Depletion of FBN1 largely restored EMCN expression and mitigated microvascular rarefaction (Fig. 5, I and J).
Serum FBN1 levels are associated with kidney injury and dysfunction in human CKD
To study the relevance of FBN1 in human CKD, we examined the expression of FBN1 protein in human kidney biopsies of various CKD by immunostaining. As shown in Fig. 6A, FBN1 was undetectable in the nontumor, normal kidney region adjacent to renal cell carcinoma. However, it was induced in renal biopsies of patients with various CKDs including immunoglobulin A nephropathy (IgAN) and membranous nephritis (MN) (Fig. 6A). FBN1 protein was predominantly localized in the tubular epithelium of diseased kidneys.
Fig. 6. Serum FBN1 levels are associated with kidney injury in human CKD.
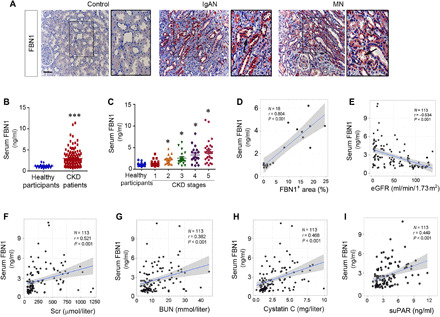
(A) Representative micrographs show the expression and localization of FBN1 protein in human CKD. Control, nontumor kidney section from patients with renal cell carcinoma; IgAN, immunoglobulin A nephropathy; MN, membranous nephritis. Arrows indicate positive staining. Boxed areas were enlarged. Scale bar, 50 μm. (B) Graphic presentation shows serum FBN1 protein levels in a cohort of patients with CKD (n = 113) and healthy participants (n = 22). Serum FBN1 levels are presented as nanograms per milliliter. ***P < 0.001. (C) Graphic presentation shows serum FBN1 protein levels in different stages of CKD. *P < 0.05 versus healthy participants. (D) Linear regression shows the correlation between serum FBN1 levels and renal FBN1 protein expression in patients with CKD. (E) Linear regression shows a negative correlation between serum FBN1 and estimated glomerular filtration rate (eGFR). (F to I) Linear regression shows a correlation of serum FBN1 with Scr (F), blood urea nitrogen (BUN) (G), cystatin C (H), and serum soluble urokinase-type plasminogen activator receptor (suPAR) (I).
We next quantitatively measured serum FBN1 levels in 22 healthy participants and a cohort of 113 patients with CKD using a specific enzyme-linked immunosorbent assay (ELISA). The demographic and clinical data of the patients are presented in table S1. As shown in Fig. 6B, serum FBN1 levels were elevated in patients with CKD, compared with healthy participants. Furthermore, serum level of FBN1 was closely associated with the severity and stages of CKD (Fig. 6C). Moreover, the circulating level of FBN1 was also correlated positively with its renal expression in 18 patients with CKD whose biopsies were available (Fig. 6D).
We further analyzed the relationship between serum FBN1 and kidney function. As shown in Fig. 6E, serum FBN1 levels were inversely associated with estimated glomerular filtration rate (eGFR) but positively correlated with serum creatinine (Fig. 6F), blood urea nitrogen (BUN) (Fig. 6G), cystatin C (Fig. 6H), and soluble urokinase-type plasminogen activator receptor (suPAR) (Fig. 6I). These results indicate the clinical relevance of FBN1 to human CKD as well.
DISCUSSION
Microvascular rarefaction is considered as one of the hallmarks of progressive CKD; however, its underlying mechanism remains largely elusive. In this study, we have demonstrated that extracellular FBN1 plays a crucial role in driving endothelial cell injury and vascular rarefaction in the setting of CKD. This conclusion is supported by several lines of evidence. First, we show that FBN1-enriched KTS is a hostile environment for endothelial cells, leading to their apoptosis and inhibiting their proliferation. Second, FBN1 is up-regulated in renal tubular epithelium in animal models of CKD induced by UIRI, UUO, and 5/6NX, as well as in kidney biopsies of human CKD. Third, FBN1 triggers endothelial cell injury and apoptosis through a cascade of events involving integrin αvβ6/TGF-β/Smad3 signaling in vitro. Last, targeted depletion of FBN1 ameliorates kidney injury and mitigates vascular rarefaction in vivo. These studies for the first time establish a fundamental role for extracellular microenvironment, rather than angiogenesis-regulatory soluble factors, in dictating endothelial cell fate after kidney injury. Our findings provide a conceptual advance in understanding the pathomechanism underlying vascular rarefaction and will have broad implication in developing future strategies to mitigate capillary loss in CKD.
FBN1 is a large, cysteine-rich ECM glycoprotein with size of approximately 350 kDa and serves as a major component of the calcium-binding microfibrils, which provide mechanical support in elastic and nonelastic connective tissues (21). Structurally, FBN1 contains multiple epidermal growth factor (EGF)–like motifs that are arranged in tandem, several domains homologous with the latent TGF-β binding protein (LTBP), and a proline-rich region (23). FBN1 is expressed in the wall of the aorta and is involved in vascular remodeling and hereditary diseases. Its structural and functional abnormalities are associated with the etiology of Marfan syndrome and aortic aneurysm (24). By using an unbiased proteomics profiling of the ECM proteins between normal and fibrotic kidneys, we have identified FBN1 as one of the most up-regulated proteins in the fibrotic KTS (Fig. 1), suggesting that it is a major component of the fibrotic niche in diseased kidney. It is worthwhile to point out that FBN1 is produced and secreted by injured kidney tubular epithelial cells in various animal models of CKD (Fig. 1) and in human biopsies from patients with CKD (Fig. 6). These results highlight that tubule-derived FBN1 participates in the formation of fibrotic niche, which, in turn, provides a hostile environment for endothelial cells. In essence, FBN1 mediates the cross-talk between injured tubules and peritubular capillary endothelium via building a unique extracellular microenvironment during CKD progression.
One notable finding in the present study is that FBN1 impairs endothelial cell survival by inducing apoptosis, leading to destruction of capillary integrity and microvascular rarefaction as seen in diseased kidney. When cultured on FBN1-enriched KTS or incubated with recombinant FBN1 protein or seeded on FBN1-coated plates, endothelial cells spontaneously express various proapoptotic proteins such as cleaved caspase-3, PARP-1, Fas, FasL, FADD, and p53 (figs. S1 and S3) and undergo apoptosis (Fig. 2). Meanwhile, FBN1 renders endothelial cells to lose their ability to proliferate in response to mitogen stimulation (Fig. 3). The combined effects of FBN1 on endothelial cell survival and proliferation make it an unreceptive foe that destructs the integrity of microvasculature. The detrimental effect of FBN1 appears to be specific to endothelial cells, as it only induces HUVEC and HRGEC apoptosis, but it does not injure HK-2 cells. Many previous studies have postulated numerous pathways that could contribute to the development of vascular rarefaction in CKD, including deficiency in angiogenic factors including VEGF, migration and loss of pericytes, and endothelial-mesenchymal transition (15, 25–27). The present study identifies a completely new mechanism by which changes in ECM composition and integrity orchestrate a hostile environment for endothelial cell survival and renewal, leading to vascular rarefaction. It should be noted that reduced peritubular capillary density will result in local hypoxia, hypoperfusion, and oxidative stress (28, 29), leading to secondary tubular injury and overproduction of FBN1 in the surrounding area. This scenario will create a vicious cycle between tubular injury and vascular rarefaction in CKD.
The present study also delineates the mechanism by which FBN1 impairs endothelial cells in great detail. Using an unbiased, transcriptomic profiling approach, we identify the changes in gene expression landscape of endothelial cells when cultured on Ctrl- and UUO-KTS (Fig. 4). Analyses of the differentially expressed genes uncover that several signal pathways implicated in apoptosis, cell cycle, integrin signaling, and TGF-β signaling are enriched (Fig. 4). These results not only confirm the imperative role of FBN1-enriched microenvironment in regulating endothelial cell apoptosis and proliferation but also suggest the potential involvement of integrin and TGF-β signaling. Incubation of endothelial cells with FBN1 rapidly induces integrin αvβ6 and TGF-β/Smad activation (Fig. 4), and blockade of either integrin αvβ6 or TGF-β abolishes FBN1-mediated endothelial cell apoptosis (Fig. 4). These data are supported by previous observations that FBN1 interacts with a variety of integrins (α5β1, α5β6, αvβ3, αvβ6, and α8β1) (30, 31), of which αvβ3, αvβ6, and α5β1 are expressed in endothelial cells (32, 33). FBN1 does not affect integrin β1 and β3 expression in HUVECs, and blockade of αvβ3 and αvβ5 signaling fails to inhibit FBN1-mediated TGF-β activation and endothelial cell apoptosis (fig. S5), suggesting that αvβ6 plays a predominant role in mediating FBN1 actions.
The signal cascade of FBN1/integrin αvβ6/TGF-β/Smad3 identified in the present study well explains for the intrinsic connection among FBN1, integrin αvβ6, TGF-β/Smad, and various effector molecules that are crucial for regulating endothelial cell apoptosis and proliferation. Protein interaction network analysis via the STRING database (https://string-db.org/) illustrates an intricate connection that links FBN1 to various effector proteins that regulate endothelial cell apoptosis and proliferation, including Fas, FasL, FADD, caspase-3, PARP-1, p53, PCNA, cyclin D1, c-Fos, and c-Myc (Fig. 4). Through interacting with integrin αvβ6, FBN1 is able to control the bioavailability and activation of TGF-β stored in extracellular space (34), without affecting TGF-β expression (Figs. 4 and 5). It is important to point out that because FBN1 is an ECM protein, the activation of TGF-β/Smad3 signaling triggered by FBN1 is spatially and precisely confined to a particular location in situ, which could be a critical step for attainment of signaling thresholds to trigger vascular rarefaction.
The significance and relevance of FBN1 in regulating vascular rarefaction are corroborated by depletion of FBN1 by shRNA-mediated strategy in vivo. In a mouse model of CKD induced by UIRI, knocking down the expression of FBN1 inhibits the expression of fibrosis-related proteins such as fibronectin, α-SMA, and collagen I and alleviates fibrotic lesions. This is accompanied by restoration of peritubular capillary density and mitigation of endothelial damage marker ET-1. FBN1 depletion also inhibits integrin αv and β6 and blocks TGF-β1 and Smad3 activation in diseased kidney, despite no effect on TGF-β1 and Smad3 expression (Fig. 5). These results suggest that endogenous FBN1 is a pathogenic mediator that activates integrin αvβ6/TGF-β1/Smad3 signaling and causes vascular rarefaction in CKD. Integrin αv and β6 expression in vivo (Fig. 5 and fig. S7) represents their levels in total kidney, which also include their expression in injured tubular epithelium. Consistent with the animal model, FBN1 is also induced in kidney biopsies of patients with various CKDs, and serum FBN1 levels are correlated with the stages and severity of CKD (Fig. 6). Furthermore, serum FBN1 is also correlated with several independent risk factors that predict kidney failure, such as serum creatinine, BUN, cystatin C, and suPAR (35, 36). Although more studies are needed, these observations imply that circulating FBN1 may be used as a new biomarker for vascular injury in CKD and for monitoring the progression of kidney disorders.
The present study has some limitations. In our ex vivo model, it remains uncertain whether endothelial cells are growing in the correct tissue compartment when seeded on the KTS. Furthermore, while FBN1 induces HUVEC and HRGEC apoptosis in vitro, its role in mediating vascular rarefaction in vivo needs to be further delineated. Although we propose the integrin αvβ6/TGF-β/Smad cascade as a principal pathway leading to endothelial cell injury, we cannot exclude the possibility that FBN1 may promote vascular rarefaction in vivo by other mechanisms as well. More studies are warranted in the future to address these issues.
In summary, by using a unique decellularized KTS ex vivo model and MS proteomics approach, we have identified FBN1 as a key mediator that triggers endothelial cell apoptosis leading to vascular rarefaction in CKD. We show that FBN1, derived from injured renal tubules, orchestrates the formation of a hostile extracellular microenvironment and induces endothelial cells to commit apoptosis via a cascade of signal events involving integrin αvβ6/TGF-β/Smad signaling. This study represents the first report to demonstrate a fundamental role of the tissue microenvironment in dictating endothelial cell fate and vascular rarefaction and should have broad implication in designing therapeutic strategies for the treatment of patients with CKD.
MATERIALS AND METHODS
Animal models
All animals were obtained from the Southern Medical University Animal Center (Guangzhou, China). Male Tibet mini-pigs and male BALB/c mice were subjected to UUO surgery (18). At 21 days after surgery, pigs were euthanized, whereas BALB/c mice were euthanized at 7 days after UUO. Kidney tissues were collected for subsequent analyses. Mice were also subjected to UIRI (19). At day 10 after IRI, the Ctrl intact kidney was removed. Mice were euthanized at 11 days after IRI, and serum and kidney tissues were collected for various analyses. In separate experiments, male CD1 mice were subjected to 5/6NX, as described previously (37). Briefly, renal ablation of the left kidney was produced by amputation of both renal poles. One week later, the mice were subjected to a right nephrectomy via a dorsal lumbotomy incision. After 8 weeks, the mice were euthanized and kidney tissues were collected. All animal studies were performed adhering to the National Institutes of Health Guide for the Care and Use of Laboratory Animals and approved by the Experimental Animal Committee at the Nanfang Hospital, Southern Medical University.
Preparation of KTS
KTS was prepared according to an established protocol (18). Briefly, at 21 days after UUO, Tibet mini-pigs were euthanized. Ctrl and obstructed kidneys were arterially perfused in situ using phosphate-buffered saline (PBS) to remove the blood. Each kidney was cut into 3- to 4-cm slices of same thickness along the sagittal plane. The kidney slices were then subjected to multiple steps of decellularization procedures as described (18). HUVECs were seeded on KTS and incubated for 2 days. After then, cell lysates were prepared and subjected to Western blot analyses.
MS proteomics analysis of the KTS
KTS from sham and UIRI kidneys was prepared according to the aforementioned method. Briefly, Male BALB/c mice were subjected to sham operation or UIRI. After euthanasia, kidneys were perfused in situ using PBS to remove blood. Kidney tissues were then decellularized as described above. Liquid chromatography–tandem MS (LC-MS/MS) analysis was performed on a Q-Exactive mass spectrometer (Thermo Fisher Scientific) that was coupled to Easy nLC (Proxeon Biosystems) for 120 min with the help provided by Shanghai Applied Protein Technology (Shanghai, China). MS/MS spectra were searched using MaxQuant software (version 1.5.3.17) against the UniProt proteome database (uniprot_Mouse_84433_20180102.fasta), and the label-free quantitation algorithm was performed for quantitative analysis. Quantifiable proteins were defined as those identified at least twice in the three biological replicates. Proteins with an adjusted P value <0.05 and abundance fold change >2 were assigned as differentially expressed between the KTS of sham and UIRI kidney (38).
Cell culture and treatment
HUVECs and human kidney proximal tubular epithelial cells (HK-2) were obtained from the American Type Culture Collection (Manassas, VA). HRGECs were obtained from Procell Life Science & Technology Co. Ltd. (Wuhan, China). HUVECs were treated with recombinant human FBN1 protein (R&D Systems, Minneapolis, MN) at different concentrations for various periods of time as indicated. In some experiments, HUVECs were pretreated with anti–integrin αvβ6 antibody (10D5), anti–integrin αvβ3 antibody, anti–integrin αvβ5 antibody, or anti–TGF-β antibody (αTGF-β) for 1 hour, followed by incubating with vehicle or FBN1 (50 ng/ml). HK-2 cells and HRGECs were treated with recombinant human FBN1 protein at 50 ng/ml for 2 days. The cells were then subjected to Western blot analyses.
FBN1-coating procedure
Cell culture plates were incubated with recombinant human FBN1 protein at a concentration of 50 ng/ml for 3 hours at 37°C. They were then washed with PBS, blocked for 1 hour with a solution of heat-denatured bovine serum albumin (1 mg/ml), and washed again. Uncoated wells were used as controls.
Cell proliferation assay
Cell mass was assessed by the MTT assay (39). MTT was added at the final concentration of 0.5 mg/ml to individual cultures for 4 hours at the end of the experiments. Tetrazolium was released by dimethyl sulfoxide, and the optical density was determined with an ELx800 Absorbance Reader (BioTek Instruments, Winooski, VT) at 570 nm.
EdU incorporation assay
EdU incorporation assay was performed according to an established protocol (40). Briefly, cells were seeded onto six-well plates and treated as indicated, and then, they were incubated with EdU (10 μM) for 48 hours. At the end of incubation, cells were fixed after removing the labeling medium, followed by incubating with the EdU reaction mixture for 30 min at room temperature. Hoechst reaction solution was then added to each well. Stained samples were viewed under an Eclipse E600 epifluorescence microscope equipped with a digital camera (Nikon, Tokyo, Japan).
Flow cytometry analysis
HUVECs were washed with cold PBS and then stained with the Cycletest Plus DNA Reagent Kit (Becton Dickinson, CA, USA) according to the manufacturer’s instructions. Cell cycle distribution was evaluated using a FACSCanto II Flow cytometry (Becton Dickinson, CA, USA). The results were analyzed using the ModFit LT3.3 software. For each experiment, 10,000 events per sample were recorded.
Apoptosis was detected by using a PE (phycoerythrin) Annexin V Apoptosis Detection Kit (Becton Dickinson, USA). HUVECs were incubated with a mixture of PE annexin V and 7-amino-actinomycin (7-AAD), and apoptosis was measured by flow cytometry.
TUNEL assay
The TUNEL staining was performed according to the instructions of the DeadEnd Fluorometric TUNEL System (#G3250, Promega, USA). Serum-starved HUVECs were treated with serum-free medium or FBN1 (50 ng/ml) for 48 hours and then fixed in 4% paraformaldehyde at room temperature. After that, incubation buffer mixture (including equilibration buffer, nucleotide mix, and rTdT enzyme) was added and incubated at 37°C for 1 hour. Cell nuclei were stained with 4′,6-diamidino-2-phenylindole (DAPI) for 15 min at 37°C. The cells were then washed by PBS for five times and observed under a fluorescence microscope (Olympus, Tokyo, Japan). Apoptosis was expressed as the percentage of TUNEL+ to total number of HUVECs.
RNA-seq analysis
HUVECs were inoculated in the KTS from control and UUO kidneys. After 24 hours of incubation, RNA-seq was performed to characterize the transcriptome of HUVECs cultured on Ctrl- and UUO-KTS. TRIzol reagent (Invitrogen, Carlsbad, CA) was used to isolate the total RNA of each sample. The purity, concentration, and integrity of RNA were checked using the NanoPhotometer spectrophotometer (IMPLEN, Westlake Village, CA), the Qubit RNA Assay Kit in Qubit 2.0 Fluorometer (Life Technologies, Carlsbad, CA), and the RNA Nano 6000 Assay Kit of the Bioanalyzer 2100 System (Agilent Technologies, Santa Clara, CA), respectively. In this study, a total of six cDNA libraries were constructed, i.e., three for HUVECs cultured on Ctrl-KTS and another three for HUVECs cultured on UUO-KTS. Ribosomal RNA was removed from each RNA extraction using the Epicentre Ribo-Zero rRNA Removal Kit (Epicentre, Madison, WI). The RNA-seq libraries were performed on a cBot Cluster Generation System using the TruSeq PE Cluster Kit v3-cBot-HS (Illumina), the libraries were sequenced at the Novogene Bioinformatics Institute (Beijing, China) on an Illumina NovaSeq 6000 sequencers, and 150–base pair paired-end reads were generated. Sequencing reads were mapped to hg19 using HISAT2 v2.0.5 with default values for the parameters (41). The mappable reads were assembled by cufflinks v2.2.1, and individual transcriptome assemblies were then merged into a comprehensive assembly using cuff merge with default parameters (42). FPKM (fragments per kilobase per million mapped reads) values were called using Cufflinks. Differential gene expression was performed by using the cuffdiff. Adjusted P < 0.05 was considered as a significantly differential expression.
Western blot analyses
Protein expression was analyzed by Western blot analysis as described previously (39). The primary antibodies are summarized and presented in table S2.
Quantitative real-time reverse transcription polymerase chain reaction
Total RNA was isolated using the TRIzol RNA purification system (Thermo Fisher Scientific, Waltham, MA). qRT-PCR was performed on an ABI PRISM 7000 Sequence Detection System (Applied Biosystems, Foster City, CA) as described previously (43). The mRNA levels of different genes were calculated after normalization with β-actin. The sequences of primer pairs are presented in table S3.
Histology, immunostaining, and confocal microscopy
Paraffin-embedded mouse kidney sections were prepared by a routine procedure. The sections were subjected to MTS and Sirius red staining. Immunohistochemical staining was performed as described previously (39). Immunofluorescence stained slides were viewed under a Leica TCS-SL confocal microscope equipped with a digital camera. Antibodies used are summarized in table S2.
Knockdown of FBN1 in vivo
Knockdown of FBN1 expression in vivo was performed using an shRNA-mediated approach, as reported in (18, 19). The efficiency of transgene transfection after hydrodynamics-based gene transfer was confirmed by injecting plasmid vector encoding HA-tagged Wnt1 fusion protein, as recently reported (44). Male C57/BL6 mice were divided into three groups (n = 6 in each group): (i) sham-operated mice, (ii) UIRI mice injected with control shRNA, and (iii) UIRI mice injected with FBN1-shRNA. Four days after IRI, mice were injected with either pLVX-shFBN1 or control (pLVX-control) plasmids via tail vein injection. Mice were euthanized at 11 days after IRI, and serum and kidney tissues were analyzed.
Human serum and kidney biopsies specimens
Human serum and kidney biopsies specimens were obtained from diagnostic renal biopsies performed at the Nanfang Hospital, Southern Medical University. Some serum samples were also collected from healthy volunteers. All the studies involving human samples were approved by the Ethic Committee on Human Subjects at the Nanfang Hospital, Southern Medical University.
FBN1 ELISA
Human FBN1 Assay Kit was purchased from the Enzyme-linked Biotechnology Company (ml960041-2, Shanghai, China). Serum FBN1 level was measured according to the assay procedures specified by the manufacturer. Serum FBN1 levels were expressed as nanogram per milliliter.
suPAR ELISA
Human suPARnostic Elisa Kit was purchased from ViroGates (Birkerod, Denmark). Serum suPAR level was measured according to the assay procedures specified by the manufacturer. Serum suPAR levels were expressed as nanogram per milliliter.
Statistical analyses
All data examined were expressed as means ± SEM. Statistical analysis of the data was carried out using IBM SPSS Statistics (SPSS Inc., Chicago, IL). Comparisons between groups were made by t test or using one-way analysis of variance (ANOVA), followed by Fisher’s least significant difference test or Dunnett T3 test. Spearman correlation analysis was used to assess the relationship between serum FBN1 and other variables. P < 0.05 was considered significant.
Acknowledgments
Funding: This work was supported by the National Natural Science Foundation of China (grants 81920108007, 81521003, 81770715, 81770737, and 81970587) and the Guangzhou Regenerative Medicine and Health Guangdong Laboratory (grants 2018GZR110104001 and 2018GZR0201003). Author contributions: Y.L. and H.F. conceived and designed the experiments. L.L., J.L., and Q.Y. implemented the experiments. X.H. and J.L. completed the ELISA. Y.P. developed the Tibet mini-pigs model. M.H. and M.Z. completed immunohistochemical staining. H.Z. and J.L. prepared KTS samples for MS proteomics analysis. L.L., F.F.H., H.F., and Y.L. performed data analysis and interpretation. H.F. supervised the experiments. L.L. and Y.L. drafted the manuscript. All authors contributed to the manuscript preparation and approved submission. Competing interests: The authors declare that they have no competing interests. Data and materials availability: All data needed to evaluate the conclusions in the paper are present in the paper and/or the Supplementary Materials. Additional data related to this paper may be requested from the authors.
SUPPLEMENTARY MATERIALS
Supplementary material for this article is available at http://advances.sciencemag.org/cgi/content/full/7/5/eabc7170/DC1
REFERENCES AND NOTES
- 1.Wang F., Yang C., Long J., Zhao X., Tang W., Zhang D., Bai K., Su Z., Gao B., Chu H., Wang J., Sun X., Wang S., Zuo L., Wang Y., Yu F., Wang H., Zhang L., Zhao M. H., Executive summary for the 2015 annual data report of the china kidney disease network (CK-NET). Kidney Int. 95, 501–505 (2019). [DOI] [PubMed] [Google Scholar]
- 2.McCullough K. P., Morgenstern H., Saran R., Herman W. H., Robinson B. M., Projecting ESRD incidence and prevalence in the United States through 2030. J. Am. Soc. Nephrol. 30, 127–135 (2019). [DOI] [PMC free article] [PubMed] [Google Scholar]
- 3.Zeisberg M., Neilson E. G., Mechanisms of tubulointerstitial fibrosis. J. Am. Soc. Nephrol. 21, 1819–1834 (2010). [DOI] [PubMed] [Google Scholar]
- 4.Basile D. P., Friedrich J. L., Spahic J., Knipe N., Mang H., Leonard E. C., Changizi-Ashtiyani S., Bacallao R. L., Molitoris B. A., Sutton T. A., Impaired endothelial proliferation and mesenchymal transition contribute to vascular rarefaction following acute kidney injury. Am. J. Physiol. Renal Physiol. 300, F721–F733 (2011). [DOI] [PMC free article] [PubMed] [Google Scholar]
- 5.Liu Y., Cellular and molecular mechanisms of renal fibrosis. Nat. Rev. Nephrol. 7, 684–696 (2011). [DOI] [PMC free article] [PubMed] [Google Scholar]
- 6.Humphreys B. D., Mechanisms of renal fibrosis. Annu. Rev. Physiol. 80, 309–326 (2018). [DOI] [PubMed] [Google Scholar]
- 7.Afsar B., Afsar R. E., Dagel T., Kaya E., Erus S., Ortiz A., Covic A., Kanbay M., Capillary rarefaction from the kidney point of view. Clin. Kidney J. 11, 295–301 (2018). [DOI] [PMC free article] [PubMed] [Google Scholar]
- 8.Kida Y., Tchao B. N., Yamaguchi I., Peritubular capillary rarefaction: A new therapeutic target in chronic kidney disease. Pediatr. Nephrol. 29, 333–342 (2014). [DOI] [PMC free article] [PubMed] [Google Scholar]
- 9.Sturtzel C., Endothelial cells. Adv. Exp. Med. Biol. 1003, 71–91 (2017). [DOI] [PubMed] [Google Scholar]
- 10.Fliser D., Perspectives in renal disease progression: The endothelium as a treatment target in chronic kidney disease. J. Nephrol. 23, 369–376 (2010). [PubMed] [Google Scholar]
- 11.Ishii Y., Sawada T., Kubota K., Fuchinoue S., Teraoka S., Shimizu A., Injury and progressive loss of peritubular capillaries in the development of chronic allograft nephropathy. Kidney Int. 67, 321–332 (2005). [DOI] [PubMed] [Google Scholar]
- 12.Ballermann B. J., Obeidat M., Tipping the balance from angiogenesis to fibrosis in CKD. Kidney Int. Suppl. 4, 45–52 (2014). [DOI] [PMC free article] [PubMed] [Google Scholar]
- 13.Doi K., Noiri E., Fujita T., Role of vascular endothelial growth factor in kidney disease. Curr. Vasc. Pharmacol. 8, 122–128 (2010). [DOI] [PubMed] [Google Scholar]
- 14.Di Marco G. S., Reuter S., Hillebrand U., Amler S., Konig M., Larger E., Oberleithner H., Brand E., Pavenstadt H., Brand M., The soluble VEGF receptor sFlt1 contributes to endothelial dysfunction in CKD. J. Am. Soc. Nephrol. 20, 2235–2245 (2009). [DOI] [PMC free article] [PubMed] [Google Scholar]
- 15.Leonard E. C., Friedrich J. L., Basile D. P., VEGF-121 preserves renal microvessel structure and ameliorates secondary renal disease following acute kidney injury. Am. J. Physiol. Renal Physiol. 295, F1648–F1657 (2008). [DOI] [PMC free article] [PubMed] [Google Scholar]
- 16.Engel J. E., Williams E., Williams M. L., Bidwell G. L. III, Chade A. R., Targeted VEGF (vascular endothelial growth factor) therapy induces long-term renal recovery in chronic kidney disease via macrophage polarization. Hypertension 74, 1113–1123 (2019). [DOI] [PMC free article] [PubMed] [Google Scholar]
- 17.Maeshima Y., Makino H., Angiogenesis and chronic kidney disease. Fibrogenesis Tissue Repair 3, 13 (2010). [DOI] [PMC free article] [PubMed] [Google Scholar]
- 18.Fu H., Tian Y., Zhou L., Zhou D., Tan R. J., Stolz D. B., Liu Y., Tenascin-C is a major component of the fibrogenic niche in kidney fibrosis. J. Am. Soc. Nephrol. 28, 785–801 (2017). [DOI] [PMC free article] [PubMed] [Google Scholar]
- 19.Zhu H., Liao J., Zhou X., Hong X., Song D., Hou F. F., Liu Y., Fu H., Tenascin-C promotes acute kidney injury to chronic kidney disease progression by impairing tubular integrity via αvβ6 integrin signaling. Kidney Int. 97, 1017–1031 (2020). [DOI] [PMC free article] [PubMed] [Google Scholar]
- 20.Guan Z., VanBeusecum J. P., Inscho E. W., Endothelin and the renal microcirculation. Semin. Nephrol. 35, 145–155 (2015). [DOI] [PMC free article] [PubMed] [Google Scholar]
- 21.Handford P. A., Fibrillin-1, a calcium binding protein of extracellular matrix. Biochim. Biophys. Acta 1498, 84–90 (2000). [DOI] [PubMed] [Google Scholar]
- 22.Jiang X., Teng M., Guo X., Zhang D., Zhang Q., Zhang J., Huang Y., Switch from αvβ5 to αvβ6 integrin is required for CD9-regulated keratinocyte migration and MMP-9 activation. FEBS Lett. 588, 4044–4052 (2014). [DOI] [PubMed] [Google Scholar]
- 23.Robertson I., Jensen S., Handford P., TB domain proteins: Evolutionary insights into the multifaceted roles of fibrillins and LTBPs. Biochem. J. 433, 263–276 (2011). [DOI] [PubMed] [Google Scholar]
- 24.Schrenk S., Cenzi C., Bertalot T., Conconi M. T., Di Liddo R., Structural and functional failure of fibrillin‑1 in human diseases (Review). Int. J. Mol. Med. 41, 1213–1223 (2018). [DOI] [PubMed] [Google Scholar]
- 25.Zeisberg E. M., Potenta S. E., Sugimoto H., Zeisberg M., Kalluri R., Fibroblasts in kidney fibrosis emerge via endothelial-to-mesenchymal transition. J. Am. Soc. Nephrol. 19, 2282–2287 (2008). [DOI] [PMC free article] [PubMed] [Google Scholar]
- 26.Kramann R., Wongboonsin J., Chang-Panesso M., Machado F. G., Humphreys B. D., Gli1+ pericyte loss induces capillary rarefaction and proximal tubular injury. J. Am. Soc. Nephrol. 28, 776–784 (2017). [DOI] [PMC free article] [PubMed] [Google Scholar]
- 27.McCurley A., Alimperti S., Campos-Bilderback S. B., Sandoval R. M., Calvino J. E., Reynolds T. L., Quigley C., Mugford J. W., Polacheck W. J., Gomez I. G., Dovey J., Marsh G., Huang A., Qian F., Weinreb P. H., Dolinski B. M., Moore S., Duffield J. S., Chen C. S., Molitoris B. A., Violette S. M., Crackower M. A., Inhibition ofαvβ5 integrin attenuates vascular permeability and protects against renal ischemia-reperfusion injury. J. Am. Soc. Nephrol. 28, 1741–1752 (2017). [DOI] [PMC free article] [PubMed] [Google Scholar]
- 28.Kooman J. P., Kotanko P., Schols A. M., Shiels P. G., Stenvinkel P., Chronic kidney disease and premature ageing. Nat. Rev. Nephrol. 10, 732–742 (2014). [DOI] [PubMed] [Google Scholar]
- 29.Tanaka S., Tanaka T., Nangaku M., Hypoxia as a key player in the AKI-to-CKD transition. Am. J. Physiol. Renal Physiol. 307, F1187–F1195 (2014). [DOI] [PubMed] [Google Scholar]
- 30.Jovanovic J., Takagi J., Choulier L., Abrescia N. G., Stuart D. I., van der Merwe P. A., Mardon H. J., Handford P. A., αVβ6 is a novel receptor for human fibrillin-1. Comparative studies of molecular determinants underlying integrin-rgd affinity and specificity. J. Biol. Chem. 282, 6743–6751 (2007). [DOI] [PubMed] [Google Scholar]
- 31.Marek I., Volkert G., Hilgers K. F., Bieritz B., Rascher W., Reinhardt D. P., Hartner A., Fibrillin-1 and alpha8 integrin are co-expressed in the glomerulus and interact to convey adhesion of mesangial cells. Cell Adh. Migr. 8, 389–395 (2014). [DOI] [PMC free article] [PubMed] [Google Scholar]
- 32.Post A., Wang E., Cosgriff-Hernandez E., A review of integrin-mediated endothelial cell phenotype in the design of cardiovascular devices. Ann. Biomed. Eng. 47, 366–380 (2019). [DOI] [PMC free article] [PubMed] [Google Scholar]
- 33.Tabata T., Kawakatsu H., Maidji E., Sakai T., Sakai K., Fang-Hoover J., Aiba M., Sheppard D., Pereira L., Induction of an epithelial integrin alphavbeta6 in human cytomegalovirus-infected endothelial cells leads to activation of transforming growth factor-beta1 and increased collagen production. Am. J. Pathol. 172, 1127–1140 (2008). [DOI] [PMC free article] [PubMed] [Google Scholar]
- 34.Isogai Z., Ono R. N., Ushiro S., Keene D. R., Chen Y., Mazzieri R., Charbonneau N. L., Reinhardt D. P., Rifkin D. B., Sakai L. Y., Latent transforming growth factor β-binding protein 1 interacts with fibrillin and is a microfibril-associated protein. J. Biol. Chem. 278, 2750–2757 (2003). [DOI] [PubMed] [Google Scholar]
- 35.Iversen E., Houlind M. B., Kallemose T., Rasmussen L. J. H., Hornum M., Feldt-Rasmussen B., Hayek S. S., Andersen O., Eugen-Olsen J., Elevated suPAR is an independent risk marker for incident kidney disease in acute medical patients. Front. Cell Dev. Biol. 8, 339 (2020). [DOI] [PMC free article] [PubMed] [Google Scholar]
- 36.Hayek S. S., Leaf D. E., Samman Tahhan A., Raad M., Sharma S., Waikar S. S., Sever S., Camacho A., Wang X., Dande R. R., Ibrahim N. E., Baron R. M., Altintas M. M., Wei C., Sheikh-Hamad D., Pan J. S., Holliday M. W. Jr., Januzzi J. L., Weisbord S. D., Quyyumi A. A., Reiser J., Soluble urokinase receptor and acute kidney injury. N. Engl. J. Med. 382, 416–426 (2020). [DOI] [PMC free article] [PubMed] [Google Scholar]
- 37.Zhou L., Mo H., Miao J., Zhou D., Tan R. J., Hou F. F., Liu Y., Klotho ameliorates kidney injury and fibrosis and normalizes blood pressure by targeting the renin-angiotensin system. Am. J. Pathol. 185, 3211–3223 (2015). [DOI] [PMC free article] [PubMed] [Google Scholar]
- 38.Cox J., Hein M. Y., Luber C. A., Paron I., Nagaraj N., Mann M., Accurate proteome-wide label-free quantification by delayed normalization and maximal peptide ratio extraction, termed MaxLFQ. Mol. Cell. Proteomics 13, 2513–2526 (2014). [DOI] [PMC free article] [PubMed] [Google Scholar]
- 39.Zhou D., Li Y., Zhou L., Tan R. J., Xiao L., Liang M., Hou F. F., Liu Y., Sonic hedgehog is a novel tubule-derived growth factor for interstitial fibroblasts after kidney injury. J. Am. Soc. Nephrol. 25, 2187–2200 (2014). [DOI] [PMC free article] [PubMed] [Google Scholar]
- 40.Limsirichaikul S., Niimi A., Fawcett H., Lehmann A., Yamashita S., Ogi T., A rapid non-radioactive technique for measurement of repair synthesis in primary human fibroblasts by incorporation of ethynyl deoxyuridine (EdU). Nucleic Acids Res. 37, e31 (2009). [DOI] [PMC free article] [PubMed] [Google Scholar]
- 41.Kim D., Langmead B., Salzberg S. L., HISAT: A fast spliced aligner with low memory requirements. Nat. Methods 12, 357–360 (2015). [DOI] [PMC free article] [PubMed] [Google Scholar]
- 42.Trapnell C., Roberts A., Goff L., Pertea G., Kim D., Kelley D. R., Pimentel H., Salzberg S. L., Rinn J. L., Pachter L., Differential gene and transcript expression analysis of RNA-seq experiments with TopHat and Cufflinks. Nat. Protoc. 7, 562–578 (2012). [DOI] [PMC free article] [PubMed] [Google Scholar]
- 43.Zhou L., Chen X., Lu M., Wu Q., Yuan Q., Hu C., Miao J., Zhang Y., Li H., Hou F. F., Nie J., Liu Y., Wnt/β-catenin links oxidative stress to podocyte injury and proteinuria. Kidney Int. 95, 830–845 (2019). [DOI] [PMC free article] [PubMed] [Google Scholar]
- 44.Tian X. J., Zhou D., Fu H., Zhang R., Wang X., Huang S., Liu Y., Xing J., Sequential Wnt agonist then antagonist treatment accelerates tissue repair and minimizes fibrosis. iScience 23, 101047 (2020). [DOI] [PMC free article] [PubMed] [Google Scholar]
Associated Data
This section collects any data citations, data availability statements, or supplementary materials included in this article.
Supplementary Materials
Supplementary material for this article is available at http://advances.sciencemag.org/cgi/content/full/7/5/eabc7170/DC1