



Abstract
Aim: The importance of sarcopenia in cardiovascular diseases has been recently demonstrated. This study aims to examine whether skeletal muscle mass (SMM), an important component of sarcopenia, is associated with an increased risk of poor outcome in patients after ST-segment elevation myocardial infarction (STEMI).
Methods: We measured SMM in 387 patients with STEMI using dual-energy X-ray absorptiometry. Patients were divided into low- and high-appendicular skeletal mass index (ASMI: appendicular SMM divided by height squared (kg/m2)) groups using the first quartile of ASMI (≤ 6.64 kg/m2 for men and ≤ 5.06 kg/m2 for women). All patients were followed up for the primary composite outcome of all-cause death, nonfatal myocardial infarction, nonfatal ischemic stroke, hospitalization for congestive heart failure, and unplanned revascularization.
Results: Low-ASMI group was older and had a more complex coronary lesion, a lower left ventricular ejection fraction, and a higher prevalence of Killip classification ≥ 2 than high-ASMI group. During a median follow-up of 33 months, the event rate was significantly higher in low-ASMI group than in high-ASMI group (24.7% vs 13.4%, log-rank p = 0.001). Even after adjustment for patients' background, low ASMI was independently associated with the high risk of primary composite events (adjusted hazard ratio 2.06, 95% confidence interval 1.01–4.19, p = 0.04). In the subgroup analyses of male patients (n = 315), the optimal cutoff point of ASMI for predicting primary composite outcome was 6.75 kg/m2, which was close to its first quartile value.
Conclusions: Low ASMI is independently associated with poor outcome in patients with STEMI.
Keywords: Skeletal muscle mass, Sarcopenia, ST-segment elevation myocardial infarction
See editorial vol. 27: 1257–1260
Due to the progressive aging in numerous countries, there has been an increasing interest in sarcopenia, a geriatric syndrome characterized by age-related decline in skeletal muscle mass and low muscle strength1–2). Muscle function as assessed by gait speed and hand grip strength are the most important factors in determining sarcopenia. These two simple and inexpensive measurements have been known to be strong prognostic markers of cardiovascular diseases3–5), and we previously showed that slow gait speed was associated with increased risk of cardiovascular events in patients after ST-segment elevation myocardial infarction (STEMI)6). The loss of skeletal muscle mass is another primordial factor in determining sarcopenia; however, the prognostic value of skeletal muscle mass in patients with STEMI is still unknown. As a method of measuring muscle mass, dual-energy X-ray absorptiometry (DXA) scan is considered to be a gold standard based on the cost, safety, and accuracy7). Therefore, this study aims to examine whether low appendicular skeletal muscle mass as assessed by DXA scan is associated with an increased risk of poor outcome in patients with STEMI.
Methods
Study Population
This was an observational cohort study of patients with STEMI. Between April 2013 and July 2018, 559 consecutive patients who were hospitalized for STEMI at the Yokohama City University Medical Center were recruited for this study. The diagnosis of STEMI included continuous typical chest pain lasting > 30 min, the presence of electrocardiographic ST-segment elevation > 0.1 mV in ≥ 2 continuous leads, and elevation of serum levels of cardiac troponin with at least one value above the 99th percentile upper reference limit. Coronary angiography was performed and SYNTAX (SYNergy between PCI with TAXUS and Cardiac Surgery) score was calculated to assess coronary plaque complexity8). The main exclusion criteria were as follows: patients with a history of coronary artery bypass grafting (CABG) (n = 1), treated with CABG this time (n = 17), on hemodialysis (n = 7), who died during hospitalization (n = 22), and who did not undergo coronary angiography (n = 6) and DXA (n = 119). Thus, 387 patients were included in the final analysis (Fig. 1) and were enrolled in the cardiac rehabilitation (CR) program during hospitalization according to the Japanese Circulation Society guidelines for rehabilitation in patients with acute coronary syndrome9). The CR during hospitalization were performed under the supervision of a physical therapist. The Borg scale was used to determine the intensity of rehabilitation. Each exercise program lasted about 1 h, beginning with a warm-up phase, followed by 20 to 30 min of aerobic activity using either walking in a hallway or walking on a treadmill and 10 min of cool down. Instruction about the CR was done by an attending physician at an individual during hospitalization. This study was approved by the institutional review board and was conducted in accordance with the guidelines of our institutional ethics committees and the provisions of the Declaration of Helsinki.
Fig. 1.
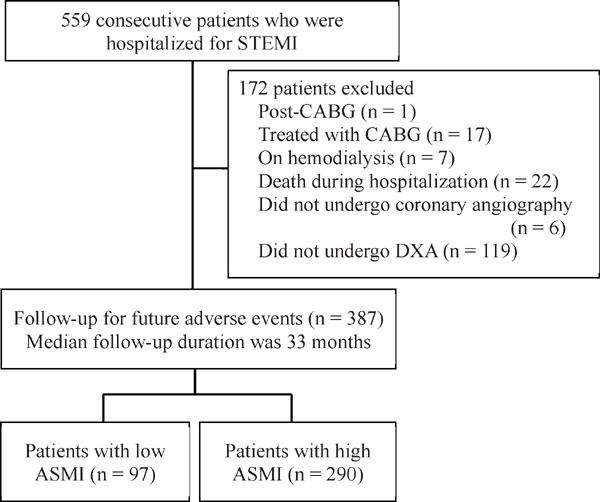
Study flowchart
STEMI, ST-segment elevation myocardial infarction; CABG, coronary artery bypass grafting; DXA, dual-energy X-ray absorptiometry; ASMI, appendicular skeletal muscle mass index
Clinical and Laboratory Measurement
Blood biochemistry data were obtained at the time of hospital admission, at 3-h intervals during the first day, daily for the next 5 days, and then every 2–3 days until discharge. Peak levels of creatine kinase were measured. Echocardiography was performed with standard parasternal and apical views in the emergency department.
Body Composition Analysis
DXA scan (Discovery, Hologic Japan Inc., Tokyo, Japan) was used to measure appendicular skeletal muscle mass and body fat. The patients underwent DXA as a screening of osteoporosis according to each patient's risk of fracture. DXA scan was performed before discharge, and at the same time, body weight and height were measured. Appendicular skeletal muscle mass was defined as the sum of the lean soft tissue masses in the extremities, and appendicular skeletal muscle mass index (ASMI) was calculated as appendicular skeletal muscle mass divided by height squared (kg/m2)2, 10). We dichotomized ASMI into low- and high-ASMI groups using the first quartile of ASMI (≤ 6.64 kg/m2 for men and ≤ 5.06 kg/m2 for women). The cutoff values of ASMI determined by the Asian Working Group for Sarcopenia (AWGS) (≤ 7.00 kg/m2 for men and ≤ 5.40 kg/m2 for women)10) were also used.
Follow-Up and Clinical Outcomes
All studied patients were followed up for clinical outcomes from a review of medical records of the hospital or information sent from the introduced hospital or direct contact with the patients, their families, and physicians. The primary outcome was a composite of the first occurrence of death from any causes, nonfatal myocardial infarction, nonfatal ischemic stroke, hospitalization for congestive heart failure, and unplanned revascularization. The secondary hard outcome was defined as a composite that excluded unplanned revascularization from the primary outcome. Cardiovascular death was defined as a death caused by myocardial infarction and congestive heart failure or documented sudden death without apparent noncardiovascular causes. Nonfatal myocardial infarction was diagnosed by increase or decrease in cardiac biomarkers with at least one value above the 99th percentile of the reference range upper limit and at least one of the following symptoms: ischemia, electrocardiogram changes (new ST-T changes or left bundle branch block or development of pathological Q wave), or imaging evidence of new viable myocardium loss or new regional wall motion abnormality. Nonfatal ischemic stroke was diagnosed with the documented focal neurologic deficit and clinically relevant radiological evidence of brain infarction. Congestive heart failure was defined as a condition that required intravenous drug administration with typical heart failure symptoms and pulmonary edema or congestion by chest X-ray.
Statistical Analysis
Data for continuous variables were expressed as the mean ± standard deviation (SD) with normal distribution or as median (25th–75th percentile) with skewed distribution. Data for categorical variables were expressed as numbers and percentage. We analyzed the baseline clinical characteristics using Student's t-test for continuous variables with normal distribution, Mann-Whitney test for continuous variables with skewed distribution, and chi-squared tests or Fisher's exact test for categorical variables. To estimate the cumulative incidence of an event, we used Kaplan-Meier time-to-event curves according to low- and high-ASMI groups using the log-rank test. Cox-proportional hazard models were performed to investigate the association between low ASMI and clinical outcomes (adjusted by age, gender, dyslipidemia, diabetes mellitus, past history of myocardial infarction, hemoglobin, serum creatinine, high-sensitivity C-reactive protein (CRP), peak creatine kinase, Killip classification, left ventricular ejection fraction (LVEF), SYNTAX score, prevalence of statin use at discharge, body mass index, and body fat percentage). Due to a low number of female patients in this cohort, the discriminative ability of ASMI for the primary outcome in male patients was assessed by means of receiver operating characteristic curves, and the area under the curve was calculated. Optimal cutoff point was obtained by determining the maximum Youden index. All statistical tests were two-tailed, and a P value < 0.05 was considered statistically significant. All analyses were carried out by using JMP Pro software 12 (SAS Institute Inc.).
Results
Study Population
A total of 387 patients with STEMI (age 66 ± 13 years, male 81.4%) were enrolled in the final analysis of this study (Fig. 1). The ASMI ranged from 3.17 to 14.19, with a mean ± SD of 7.35 ± 1.16 in men and 5.66 ± 0.85 in women (Fig. 2A and 2B).
Fig. 2.
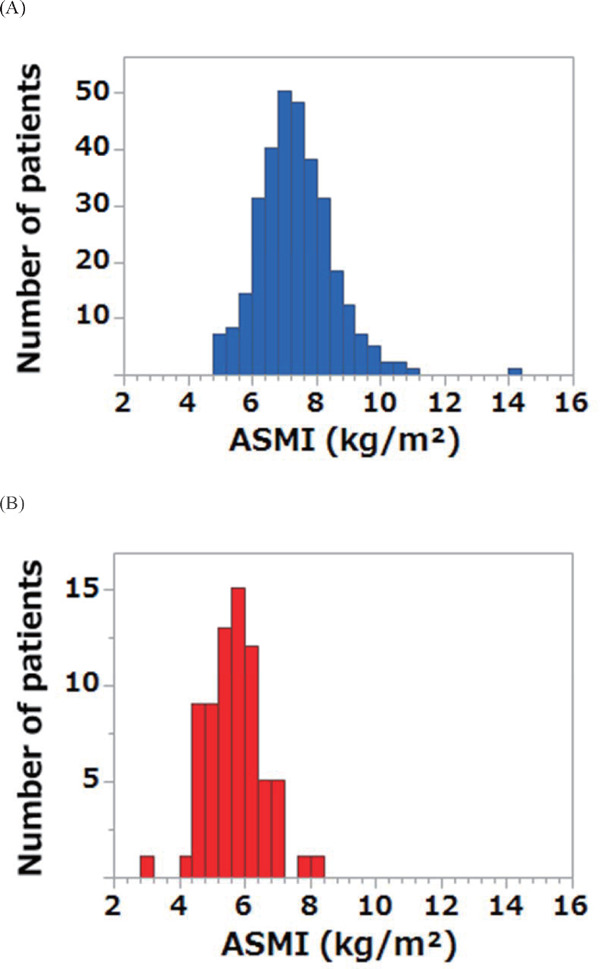
The distribution of ASMI
Fig. 2A shows the distribution of ASMI in male.
Fig. 2B shows the distribution of ASMI in female.
ASMI, appendicular skeletal muscle mass index
Patient Characteristics according to Low- and High-ASMI Groups
Baseline clinical characteristics of patients stratified by low- and high-ASMI groups are shown in Table 1. STEMI patients with low ASMI were older and had shorter height, lower weight, and body mass index than those with high ASMI. There were no significant differences in the prevalence of smoking history, hypertension, and diabetes mellitus between the two groups. The low-ASMI group had lower triglyceride, hemoglobin, and albumin levels and higher BNP and hsCRP level than the high-ASMI group. The low-ASMI group had more multivessel coronary artery disease, higher SYNTAX score, and lower LVEF and was more likely to have Killip classification ≥ 2 than the high-ASMI group, although infarct size as assessed by peak creatine kinase levels was similar between the two groups. Administration of a statin, beta blocker, and angiotensin-converting enzyme inhibitor or angiotensin II receptor blocker at hospital discharge was less in patients with low ASMI than those with high ASMI.
Table 1. Baseline clinical characteristics of patients stratified by low- and high-ASMI groups.
| Overall | Low-ASMI group | High-ASMI group | P | |
|---|---|---|---|---|
| (n = 97) | (n = 290) | |||
| Age, years | 66 (13) | 74 (9) | 63 (13) | < 0.001 |
| Male sex, n (%) | 315 (81.4) | 79 (81.4) | 236 (81.4) | 0.99 |
| Height, cm | 164 (9) | 163 (9) | 165 (9) | 0.04 |
| Weight, kg | 65 (13) | 56 (8) | 69 (13) | < 0.001 |
| Body mass index, kg/m2 | 24.0 (3.9) | 20.9 (2.2) | 25.1 (3.7) | < 0.001 |
| Smoker, n (%) | 307 (79.3) | 79 (81.4) | 228 (78.6) | 0.55 |
| Hypertension, n (%) | 222 (57.4) | 55 (56.7) | 167 (57.6) | 0.88 |
| Diabetes mellitus, n (%) | 121 (31.3) | 32 (33.0) | 89 (30.7) | 0.67 |
| Dyslipidemia, n (%) | 305 (78.8) | 69 (71.1) | 236 (81.4) | 0.03 |
| LDL cholesterol, mg/dL | 128 (37) | 123 (38) | 129 (36) | 0.13 |
| HDL cholesterol, mg/dL | 48 (18) | 51 (20) | 47 (18) | 0.06 |
| Triglyceride, mg/dL | 111 [72–176] | 90 [57–127] | 119 [80–196] | < 0.001 |
| Creatinine, mg/dL | 0.8 [0.7–1.0] | 0.8 [0.7–1.1] | 0.8 [0.7–1.0] | 0.46 |
| Albumin, g/dL | 4.2 (0.5) | 3.9 (0.5) | 4.3 (0.4) | < 0.001 |
| Hemoglobin, g/dL | 14.2 (2.0) | 13.4 (2.1) | 14.4 (1.8) | < 0.001 |
| High-sensitivity CRP, mg/dL | 0.17 [0.08–0.36] | 0.25 [0.08–0.46] | 0.16 [0.08–0.35] | 0.04 |
| BNP, pg/mL | 50 [20–124] | 90 [43–254] | 39 [17–103] | < 0.001 |
| Killip classification ≥ 2, n (%) | 76 (19.6) | 29 (29.9) | 47 (16.2) | 0.003 |
| LVEF, % | 46 (11) | 43 (12) | 47 (11) | 0.002 |
| Peak CK, 103 IU/L | 2.0 [0.9–3.7] | 2.2 [0.7–3.5] | 2.0 [1.0–3.8] | 0.60 |
| Infarct-related artery | 0.52 | |||
| LMT, n (%) | 7 (1.8) | 2 (2.0) | 5 (1.7) | |
| LAD, n (%) | 190 (49.1) | 48 (49.5) | 142 (49.0) | |
| LCX, n (%) | 49 (12.7) | 16 (16.5) | 33 (11.4) | |
| RCA, n (%) | 141 (36.4) | 31 (32.0) | 110 (37.9) | |
| Multivessel disease, n (%) | 188 (48.6) | 59 (60.8) | 129 (44.5) | 0.005 |
| SYNTAX score | 15.9 (8.3) | 19.6 (9.4) | 14.6 (7.6) | < 0.001 |
| Total body fat, % | 24.3 (6.2) | 23.8 (6.5) | 24.5 (6.1) | 0.37 |
| Medication at discharge | ||||
| Aspirin, n (%) | 380 (98.2) | 95 (97.9) | 285 (98.3) | 0.83 |
| HMG-CoA RI, n (%) | 372 (96.1) | 86 (88.7) | 286 (98.6) | < 0.001 |
| Beta blocker, n (%) | 275 (71.1) | 61 (62.9) | 214 (73.8) | 0.04 |
| ACE-I or ARB, n (%) | 322 (83.2) | 72 (74.2) | 250 (86.2) | 0.006 |
Data are presented as the mean (standard deviation), median [25th–75th percentile range], or number (percentage). P values represent comparisons of low-ASMI group versus high-ASMI group.
ASMI: appendicular skeletal muscle mass index, LDL: low-density lipoprotein, HDL: high-density lipoprotein, CRP: C-reactive protein, CK: creatine kinase, LVEF: left ventricular ejection fraction, LMT: left main trunk, LAD: left anterior descending artery, LCX: left circumflex artery, RCA: right coronary artery, HMG-CoA RI: hydroxymethylglutaryl-CoA reductase reductase inhibitor, ACE-I: angiotensin converting enzyme inhibitor, ARB: angiotensin II receptor blocker.
Association between Low ASMI and Future Adverse Outcome
During follow-up (median 33 months [interquartile range 12–47 months]), 63 patients experienced primary composite outcome (13 all-cause death, 11 nonfatal myocardial infarction, 6 nonfatal ischemic stroke, 10 hospitalization for congestive heart failure, and 23 unplanned revascularization). The causes of death were as follows: cardiovascular (four), pneumonia (two), cancer (two), chronic obstructive pulmonary disease (one), and unknown (four). Patients with low ASMI developed significantly more adverse events (n = 24, 24.7%) than those with high ASMI (n = 39, 13.4%) during the follow-up period (log-rank p = 0.001, Table 2 and Fig. 3A). Of the primary composite outcome, the incidence of death from any cause (all-cause death 7.2% vs 2.1%, p = 0.01, cardiovascular death 3.1% vs 0.3%, p = 0.02) was significantly higher in patients with low ASMI than those with high ASMI. Patients with low ASMI had a higher risk of the primary composite outcome than those with high ASMI (unadjusted hazard ratio [HR] 2.25, 95% confidence interval [CI] 1.33–3.71, p = 0.003). Even after adjustment for patients' background, low ASMI was independently and significantly associated with the primary outcome (adjusted HR 2.06, 95% CI 1.01– 4.19, p = 0.04, Table 3 and Fig. 3A). When the AWGS criteria were used, patients with low ASMI had a higher risk for primary composite outcome than those with high ASMI, and the multivariate Cox-proportional hazard models showed a similar trend, although it did not reach the significant level (unadjusted HR 1.83, 95% CI 1.11–3.02, p = 0.01 and adjusted HR 1.69, 95% CI 0.84–3.45, p = 0.14).
Table 2. Cumulative events after STEMI according to low- or high-ASMI groups.
| All patients | Low-ASMI group | High-ASMI group | p value | |
|---|---|---|---|---|
| (n = 387) | (n = 97) | (n = 290) | ||
| Primary composite outcome | 63 (16.3) | 24 (24.7) | 39 (13.4) | 0.001 |
| All-cause death | 13 (3.4) | 7 (7.2) | 6 (2.1) | 0.01 |
| Cardiovascular death | 4 (1.0) | 3 (3.1) | 1 (0.3) | 0.02 |
| Nonfatal myocardial infarction | 11 (2.8) | 2 (2.1) | 9 (3.1) | 0.69 |
| Nonfatal ischemic stroke | 6 (1.6) | 3 (3.1) | 3 (1.0) | 0.12 |
| Hospitalization for congestive heart failure | 10 (2.6) | 4 (4.1) | 6 (2.1) | 0.23 |
| Unplanned revascularization | 23 (5.9) | 8 (8.2) | 15 (5.2) | 0.18 |
Data are expressed as counts (percentage). Significance was assessed by the log-rank test.
ASMI: appendicular skeletal muscle mass index
Fig. 3.
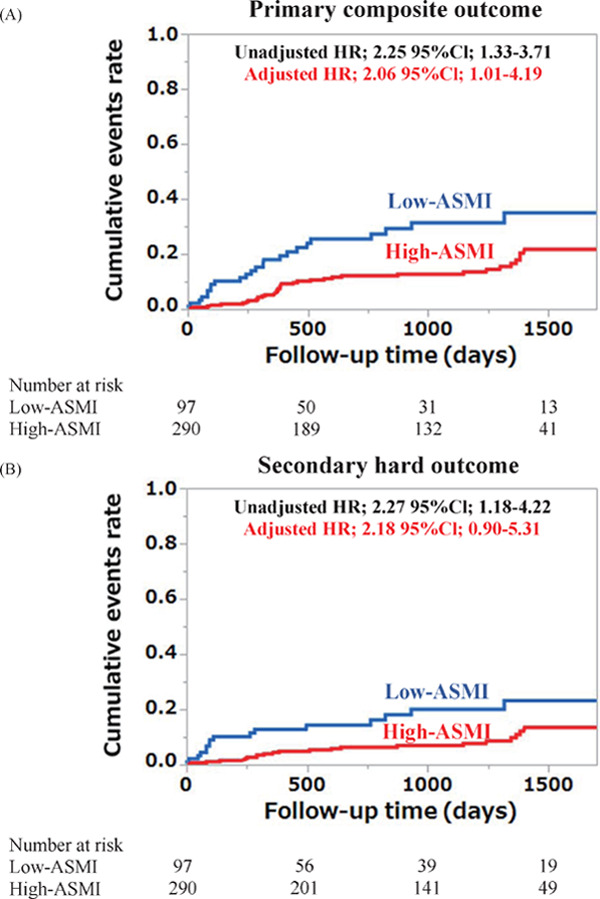
Kaplan-Meier estimates of the cumulative incidence of future adverse events according to low- and high-ASMI groups
Fig. 3A shows the Kaplan-Meier time-to-event curve for primary composite outcome (death from any causes, nonfatal myocardial infarction, nonfatal ischemic stroke, hospitalization for congestive heart failure, and unplanned revascularization).
Fig. 3B shows the Kaplan-Meier time-to-event curve for secondary hard outcome (death from any causes, nonfatal myocardial infarction, nonfatal ischemic stroke, hospitalization for congestive heart failure). HR, hazard ratio; CI, confidence interval; ASMI, appendicular skeletal muscle mass index
Table 3. Univariate and multivariate Cox-proportional hazards analysis for primary composite outcome and secondary hard outcome.
| Primary composite outcome |
Secondary hard outcome |
|||||
|---|---|---|---|---|---|---|
| HR | 95%-Cl | p value | HR | 95%-Cl | p value | |
| Univariate model | 2.25 | 1.33–3.71 | 0.003 | 2.27 | 1.18–4.22 | 0.009 |
| Model 1 | ||||||
| Adjusted by age, gender, dyslipidemia, DM, past history of MI | 1.95 | 1.10–3.42 | 0.02 | 1.58 | 0.77–3.17 | 0.21 |
| Model 2 | ||||||
| Adjusted by Model 1 variables + Hb, serum creatinine, hsCRP, peak CK, Killip classification, LVEF, SYNTAX score | 1.86 | 1.01–3.35 | 0.04 | 1.60 | 0.75–3.36 | 0.21 |
| Model 3 | ||||||
| Adjusted by Model 2 variables + prevalence of statin use at discharge, body mass index, body fat percentage | 2.06 | 1.01–4.19 | 0.04 | 2.18 | 0.90–5.31 | 0.08 |
HR: hazard ratio, CI: confidence interval, DM: diabetes mellitus, MI: myocardial infarction, Hb: hemoglobin, hsCRP: high-sensitivity C-reactive protein, CK: creatine kinase, LVEF: left ventricular ejection fraction.
Concerning the secondary hard outcome, there was a significant difference in the occurrence of adverse events between the low- and high-ASMI groups (log-rank p = 0.009, Fig. 3B), and patients with low ASMI also had a substantially higher risk of the adverse event than those with high ASMI (unadjusted HR 2.27, 95% CI 1.18–4.22, p = 0.01 and adjusted HR 2.18, 95% CI 0.90–5.31, p = 0.08, Table 3 and Fig. 3B).
Subgroup Analyses of Male Patients for the Primary Composite Outcome
Due to a small number of female patients in this cohort (n = 72), we investigated the optimal cutoff value of ASMI in male patients (n = 315). The optimal cutoff value of ASMI obtained from the maximum Youden index to predict the primary composite outcome was 6.75 in male patients (Supplementary Fig. 1), which was close to its first quartile value. Low ASMI determined by maximum Youden index was independently and significantly associated with the primary composite outcome (adjusted HR 3.18, 95% CI 1.47–7.03, p = 0.003), although low ASMI using the AWGS criteria was not (adjusted HR 1.90, 95% CI 0.88–4.18, p = 0.10) (Supplementary Table 1 and Fig. 4).
Supplementary Fig. 1.
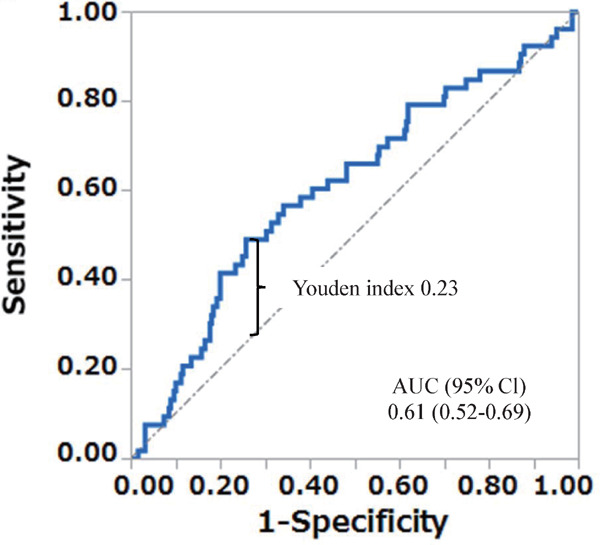
Receiving operating curve defining the optimal cut-off value of ASMI to predict primary composite outcome in male patients
ASMI: appendicular skeletal muscle mass index, AUC: area under the curve, CI: confidence interval.
Supplementary Table 1. Univariate and multivariate Cox-proportional hazards analysis for primary composite outcome in male patients.
| Definition of low-ASMI | Cut-off value of ASMI (kg/m2) | Univariate analysis |
Multivariate analysis |
||||
|---|---|---|---|---|---|---|---|
| HR | 95%-Cl | p value | HR | 95%-Cl | p value | ||
| The first quartile of ASMI | 6.64 | 2.67 | 1.53–4.60 | < 0.001 | 2.38 | 1.08–5.27 | 0.03 |
| Optimal cut-off point obtained by the Youden index | 6.75 | 3.05 | 1.77–5.24 | < 0.001 | 3.18 | 1.47–7.03 | 0.003 |
| AWGS criteria | 7.00 | 2.28 | 1.33–4.00 | 0.003 | 1.90 | 0.88–4.18 | 0.10 |
ASMI: appendicular skeletal muscle mass index, HR: hazard ratio, CI: confidence interval, AWGS: Asian Working Group for Sarcopenia.
Fig. 4.
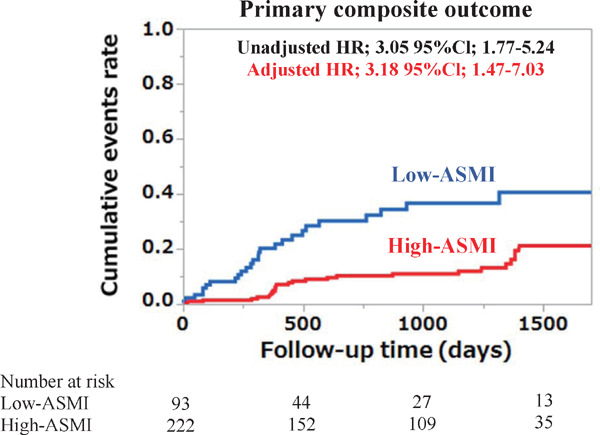
Kaplan-Meier estimates of the cumulative incidence of the primary composite outcome after STEMI in male patients
Low ASMI was defined using the optimal cutoff value determined by the Youden index.
ASMI, appendicular skeletal muscle mass index
Discussion
Our study first shows that STEMI patients with low ASMI had a significantly higher risk for future adverse events than those with high ASMI. Of note, low-ASMI patients manifested significantly increased risk for all-cause death after STEMI. The association between patients with low ASMI and future adverse events was also significant after adjustment for clinically important variables such as age, gender, dyslipidemia, diabetes mellitus, past history of myocardial infarction, hemoglobin, renal function, inflammation level, infarct size, Killip classification, LVEF, coronary plaque complexity, prevalence of statin use at discharge, body mass index, and body fat percentage. These findings suggest that skeletal muscle mass might be a useful measure for risk stratification in patients after STEMI.
Sarcopenia is characterized by a progressive loss of skeletal muscle mass and muscle strength beyond physiological aging10). In European and Asian working groups, the diagnosis of sarcopenia requires measurements of muscle strength evaluated by gait speed and/or hand grip strength and skeletal muscle mass2, 10). The negative association between decreased hand grip strength and the consecutive occurrence of cerebrovascular disease and cardiovascular mortality has already been reported11). In patients after STEMI, we previously reported that slow gait speed was significantly associated with an increased risk of cardiovascular events, even after adjusting for multiple coronary risk factors6). However, the clinical significance of skeletal muscle mass in patients with STEMI has not been elucidated. We first reported the negative association between skeletal muscle mass and future adverse events after STEMI. Our study also showed that compared with AWGS criteria which determine sarcopenia in Asian general population10), a lower cutoff value may be better for predicting primary composite outcome in male patients with STEMI, partly because AWGS criteria was made with reference to some reports whose criteria were calculated based on two SDs below the mean of young adult. Further studies are needed to elucidate clinical significance and optimal cutoff point of skeletal muscle mass in patients with cardiovascular disease.
There is growing evidence that obesity is a major risk factor for most cardiovascular diseases12). However, in many recent studies, it has been shown that patients with overweight and obesity have a better prognosis than lean patients with the same cardiovascular diseases13–14). This paradoxical process is called the “obesity paradox,” and Lavie et al. have reported the inverse relationship between lean body mass index and their prognosis in a study of patients with stable coronary heart disease14). A variety of mechanisms, such as cardiorespiratory fitness, muscle strength, muscle mass, effect of smoking, and age of onset, are considered as reasons for the obesity paradox15–16). Our study shows that ASMI, independent from body mass index, was associated with increased risk of poor future adverse outcome in patients after STEMI. Decreased muscle mass may be an important component in the obesity paradox.
Mechanisms underlying the association between muscle mass and poor outcomes in STEMI patients remain not fully understood, yet several causes might be suggested. First, the skeletal muscle is a main organ on which insulin acts and that consumes glucose17–18), and some recent studies have indicated that the loss of skeletal muscle mass could cause insulin resistance and diabetes mellitus19–21), which may harmfully affect the clinical course of STEMI. In the present study, however, the prevalence of diabetes mellitus was similar between the low- and high-ASMI groups. In addition, we could not evaluate glucose metabolism such as insulin secretory ability and insulin resistance. Second, hormonal alteration and inflammation can commonly result in low ASMI and poor prognosis after STEMI. It has been demonstrated that endocrine alterations such as testosterone22), growth hormone, thyroid hormone1, 23), and myokine24) play key roles in the process of myogenesis. Inflammation has also been considered a significant contributor to the process of muscle decline25–26) and cardiac dysfunction/remodeling, which may cause progression of heart failure or sudden cardiac death27–28). Indeed, our data showed a significantly higher high-sensitivity CRP levels at admission in the low-ASMI group than in the high-ASMI group. Third, some studies have indicated an association between the loss of skeletal muscle mass and atherosclerosis29–31). Ochi et al. indicated the negative relation between thigh muscle mass and brachial-ankle pulse wave velocity and carotid intima-media thickness in men, hypothesizing that common underlying factors may exist, such as increasing age, loss of physical activity, and malnutrition, in the two conditions, which can affect each other32). In our study, there were significantly higher rate of multivessel coronary artery disease and higher SYNTAX score in the low-ASMI group than in the high-ASMI group.
Study Limitation
Our present study has several limitations. First, this study was observational design, and we could not determine the causality between ASMI and prognosis after STEMI. Second, this study included a relatively small number of patients from a single center in Japan. The number of some specific event was also small and insufficient to carry out statistical analysis. Multicenter, multi-ethnic studies with a larger sample size are required to confirm our results. Third, we did not have data regarding the patients' initial activity levels, nutritional states, or hormonal changes. Skeletal muscle mass is affected by various factors such as age, daily activity, nutritional state33), hormonal change, inflammation, and muscle strength. Additional studies that comprehensively assess not only muscle mass but also muscle strength, nutrition status, inflammatory biomarkers, and endocrinal function are needed to elucidate the mechanisms underlying the association between decreased muscle mass and poor outcomes in STEMI patients.
Conclusions
Our study shows that low ASMI is significantly associated with poor future adverse outcomes in patients with STEMI. Skeletal muscle mass might be a useful measure for risk stratification in patients after STEMI.
Funding
This research received no specific grant from any funding agency in the public, commercial, or not-for-profit sectors.
Disclosure
Kiyoshi Hibi has been a paid consultant to or receiving fees for speaking from Daiichi-Sankyo, Terumo, Sanofi, Boston Scientific Japan, Amgen Astellas BioPharma, and Kowa Pharmaceutical. Stephan von Haehling has been a paid consultant to Vifor Pharma, Amgen, AstraZeneca, Bayer, Boehringer Ingelheim, Brahms, Chugai Pharma, Roche, and Novartis. Stefan D. Anker has been a paid consultant to or receiving fees for speaking from Bayer, Boehringer Ingelheim, Thermo Fisher Scientific, Novartis, Servier, and Vifor Pharma; and his institution has received a research grant from Vifor Pharma and Abbott Vascular. Kazuo Kimura has been a paid consultant to or receiving fees for speaking from MSD, AstraZeneca, Daiichi-Sankyo and Bayer; and his institution has received a reserch grant from Kowa Pharmaceutical, Phyzer, MSD, Ono, Takeda, Eisai, Tanabe Mitsubishi, Daiichi-Sankyo, Bayer, AstraZeneca, Abbott Vascular Japan, Goodman, St. Jude Medical Japan, SOLVE, Teijin Pharma, and Medtronic Japan. Other authors declare that they have no conflicts of interest in the publication of this manuscript.
References
- 1). Ryall JG, Schertzer JD, Lynch GS: Cellular and molecular mechanisms underlying age-related skeletal muscle wasting and weakness. Biogerontology, 2008; 9: 213-228 [DOI] [PubMed] [Google Scholar]
- 2). Cruz-Jentoft AJ, Baeyens JP, Bauer JM, Boirie Y, Cederholm T, Landi F, Martin FC, Michel JP, Rolland Y, Schneider SM, Topinkova E, Vandewoude M, Zamboni M, European Working Group on Sarcopenia in Older P : Sarcopenia: European consensus on definition and diagnosis: Report of the European Working Group on Sarcopenia in Older People. Age Ageing, 2010; 39: 412-423 [DOI] [PMC free article] [PubMed] [Google Scholar]
- 3). Kamiya K, Hamazaki N, Matsue Y, Mezzani A, Corra U, Matsuzawa R, Nozaki K, Tanaka S, Maekawa E, Noda C, Yamaoka-Tojo M, Matsunaga A, Masuda T, Ako J: Gait speed has comparable prognostic capability to six-minute walk distance in older patients with cardiovascular disease. Eur J Prev Cardiol, 2018; 25: 212-219 [DOI] [PubMed] [Google Scholar]
- 4). Lo AX, Donnelly JP, McGwin G, Jr., Bittner V, Ahmed A, Brown CJ: Impact of gait speed and instrumental activities of daily living on all-cause mortality in adults >/= 65 years with heart failure. Am J Cardiol, 2015; 115: 797-801 [DOI] [PMC free article] [PubMed] [Google Scholar]
- 5). Izawa KP, Watanabe S, Osada N, Kasahara Y, Yokoyama H, Hiraki K, Morio Y, Yoshioka S, Oka K, Omiya K: Handgrip strength as a predictor of prognosis in Japanese patients with congestive heart failure. Eur J Cardiovasc Prev Rehabil, 2009; 16: 21-27 [DOI] [PubMed] [Google Scholar]
- 6). Matsuzawa Y, Konishi M, Akiyama E, Suzuki H, Nakayama N, Kiyokuni M, Sumita S, Ebina T, Kosuge M, Hibi K, Tsukahara K, Iwahashi N, Endo M, Maejima N, Saka K, Hashiba K, Okada K, Taguri M, Morita S, Sugiyama S, Ogawa H, Sashika H, Umemura S, Kimura K: Association between gait speed as a measure of frailty and risk of cardiovascular events after myocardial infarction. J Am Coll Cardiol, 2013; 61: 1964-1972 [DOI] [PubMed] [Google Scholar]
- 7). Buckinx F, Landi F, Cesari M, Fielding RA, Visser M, Engelke K, Maggi S, Dennison E, Al-Daghri NM, Allepaerts S, Bauer J, Bautmans I, Brandi ML, Bruyere O, Cederholm T, Cerreta F, Cherubini A, Cooper C, Cruz-Jentoft A, McCloskey E, Dawson-Hughes B, Kaufman JM, Laslop A, Petermans J, Reginster JY, Rizzoli R, Robinson S, Rolland Y, Rueda R, Vellas B, Kanis JA: Pitfalls in the measurement of muscle mass: a need for a reference standard. J Cachexia Sarcopenia Muscle, 2018; 9: 269-278 [DOI] [PMC free article] [PubMed] [Google Scholar]
- 8). Sianos G, Morel M-A, Kappetein A-P, Morice M-C, Colombo A, Dawkins KD, van den Brand M, van Dyck N, Russell ME, Serruys PW: The SYNTAX Score: an angiographic tool grading the complexity of coronary artery disease. EuroIntervention, 2005; 1: 219-227 [PubMed] [Google Scholar]
- 9). Kimura K, Kimura T, Ishihara M, Nakagawa Y, Nakao K, Miyauchi K, Sakamoto T, Tsujita K, Hagiwara N, Miyazaki S, Ako J, Arai H, Ishii H, Origuchi H, Shimizu W, Takemura H, Tahara Y, Morino Y, Iino K, Itoh T, Iwanaga Y, Uchida K, Endo H, Kongoji K, Sakamoto K, Shiomi H, Shimohama T, Suzuki A, Takahashi J, Takeuchi I, Tanaka A, Tamura T, Nakashima T, Noguchi T, Fukamachi D, Mizuno T, Yamaguchi J, Yodogawa K, Kosuge M, Kohsaka S, Yoshino H, Yasuda S, Shimokawa H, Hirayama A, Akasaka T, Haze K, Ogawa H, Tsutsui H, Yamazaki T, Japanese Circulation Society Joint Working G : JCS 2018 Guideline on Diagnosis and Treatment of Acute Coronary Syndrome. Circ J, 2019; 83: 1085-1196 [DOI] [PubMed] [Google Scholar]
- 10). Chen LK, Liu LK, Woo J, Assantachai P, Auyeung TW, Bahyah KS, Chou MY, Chen LY, Hsu PS, Krairit O, Lee JS, Lee WJ, Lee Y, Liang CK, Limpawattana P, Lin CS, Peng LN, Satake S, Suzuki T, Won CW, Wu CH, Wu SN, Zhang T, Zeng P, Akishita M, Arai H: Sarcopenia in Asia: consensus report of the Asian Working Group for Sarcopenia. J Am Med Dir Assoc, 2014; 15: 95-101 [DOI] [PubMed] [Google Scholar]
- 11). Leong DP, Teo KK, Rangarajan S, Lopez-Jaramillo P, Avezum A, Orlandini A, Seron P, Ahmed SH, Rosengren A, Kelishadi R, Rahman O, Swaminathan S, Iqbal R, Gupta R, Lear SA, Oguz A, Yusoff K, Zatonska K, Chifamba J, Igumbor E, Mohan V, Anjana RM, Gu H, Li W, Yusuf S: Prognostic value of grip strength: findings from the Prospective Urban Rural Epidemiology (PURE) study. The Lancet, 2015; 386: 266-273 [DOI] [PubMed] [Google Scholar]
- 12). Sehested TS, Hansen TW, Olsen MH, Abildstrom SZ, Rasmussen S, Ibsen H, Torp-Pedersen C, Madsbad S, Jeppesen J: Measures of overweight and obesity and risk of cardiovascular disease: a population-based study. Eur J Cardiovasc Prev Rehabil, 2010; 17: 486-490 [DOI] [PubMed] [Google Scholar]
- 13). Zafrir B, Jaffe R, Rubinshtein R, Karkabi B, Flugelman MY, Halon DA: Influence of Body Mass Index on Long-Term Survival After Cardiac Catheterization. American Journal of Cardiology, 2018; 121: 113-119 [DOI] [PubMed] [Google Scholar]
- 14). Lavie CJ, De Schutter A, Patel DA, Romero-Corral A, Artham SM, Milani RV: Body composition and survival in stable coronary heart disease: impact of lean mass index and body fat in the “obesity paradox”. J Am Coll Cardiol, 2012; 60: 1374-1380 [DOI] [PubMed] [Google Scholar]
- 15). Lavie CJ, McAuley PA, Church TS, Milani RV, Blair SN: Obesity and cardiovascular diseases: implications regarding fitness, fatness, and severity in the obesity paradox. J Am Coll Cardiol, 2014; 63: 1345-1354 [DOI] [PubMed] [Google Scholar]
- 16). Konishi M, von Haehling S: The need for re-defining cut-off values in heart failure: From obesity to iron deficiency. Exp Gerontol, 2017; 87: 1-7 [DOI] [PubMed] [Google Scholar]
- 17). Egger A, Niederseer D, Diem G, Finkenzeller T, Ledl-Kurkowski E, Forstner R, Pirich C, Patsch W, Weitgasser R, Niebauer J: Different types of resistance training in type 2 diabetes mellitus: effects on glycaemic control, muscle mass and strength. Eur J Prev Cardiol, 2013; 20: 1051-1060 [DOI] [PubMed] [Google Scholar]
- 18). Shulman GI, Rothman DL, Jue T, Stein P, DeFronzo RA, Shulman RG: Quantitation of muscle glycogen synthesis in normal subjects and subjects with non-insulin-dependent diabetes by 13C nuclear magnetic resonance spectroscopy. N Engl J Med, 1990; 322: 223-228 [DOI] [PubMed] [Google Scholar]
- 19). Kim KS, Park KS, Kim MJ, Kim SK, Cho YW, Park SW: Type 2 diabetes is associated with low muscle mass in older adults. Geriatr Gerontol Int, 2014; 14 Suppl 1: 115-121 [DOI] [PubMed] [Google Scholar]
- 20). Aleman-Mateo H, Lopez Teros MT, Ramirez FA, Astiazaran-Garcia H: Association between insulin resistance and low relative appendicular skeletal muscle mass: evidence from a cohort study in community-dwelling older men and women participants. J Gerontol A Biol Sci Med Sci, 2014; 69: 871-877 [DOI] [PubMed] [Google Scholar]
- 21). Lee SW, Youm Y, Lee WJ, Choi W, Chu SH, Park YR, Kim HC: Appendicular skeletal muscle mass and insulin resistance in an elderly korean population: the korean social life, health and aging project-health examination cohort. Diabetes Metab J, 2015; 39: 37-45 [DOI] [PMC free article] [PubMed] [Google Scholar]
- 22). Skinner JW, Otzel DM, Bowser A, Nargi D, Agarwal S, Peterson MD, Zou B, Borst SE, Yarrow JF: Muscular responses to testosterone replacement vary by administration route: a systematic review and meta-analysis. J Cachexia Sarcopenia Muscle, 2018; 9: 465-481 [DOI] [PMC free article] [PubMed] [Google Scholar]
- 23). Sakuma K, Yamaguchi A: Sarcopenia and age-related endocrine function. Int J Endocrinol, 2012; 2012: 127362. [DOI] [PMC free article] [PubMed] [Google Scholar]
- 24). Lee MJ, Lee SA, Nam BY, Park S, Lee SH, Ryu HJ, Kwon YE, Kim YL, Park KS, Oh HJ, Park JT, Han SH, Ryu DR, Kang SW, Yoo TH: Irisin, a novel myokine is an independent predictor for sarcopenia and carotid atherosclerosis in dialysis patients. Atherosclerosis, 2015; 242: 476-482 [DOI] [PubMed] [Google Scholar]
- 25). Toth MJ, Ades PA, Tischler MD, Tracy RP, LeWinter MM: Immune activation is associated with reduced skeletal muscle mass and physical function in chronic heart failure. Int J Cardiol, 2006; 109: 179-187 [DOI] [PubMed] [Google Scholar]
- 26). Norman K, Stobaus N, Kulka K, Schulzke J: Effect of inflammation on handgrip strength in the non-critically ill is independent from age, gender and body composition. Eur J Clin Nutr, 2014; 68: 155-158 [DOI] [PubMed] [Google Scholar]
- 27). Halade GV, Jin YF, Lindsey ML: Matrix metalloproteinase (MMP)-9: a proximal biomarker for cardiac remodeling and a distal biomarker for inflammation. Pharmacol Ther, 2013; 139: 32-40 [DOI] [PMC free article] [PubMed] [Google Scholar]
- 28). Shenasa M, Shenasa H: Hypertension, left ventricular hypertrophy, and sudden cardiac death. Int J Cardiol, 2017; 237: 60-63 [DOI] [PubMed] [Google Scholar]
- 29). Kohara K, Okada Y, Ochi M, Ohara M, Nagai T, Tabara Y, Igase M: Muscle mass decline, arterial stiffness, white matter hyperintensity, and cognitive impairment: Japan Shimanami Health Promoting Program study. J Cachexia Sarcopenia Muscle, 2017; 8: 557-566 [DOI] [PMC free article] [PubMed] [Google Scholar]
- 30). Sampaio RA, Sewo Sampaio PY, Yamada M, Yukutake T, Uchida MC, Tsuboyama T, Arai H: Arterial stiffness is associated with low skeletal muscle mass in Japanese community-dwelling older adults. Geriatr Gerontol Int, 2014; 14 Suppl 1: 109-114 [DOI] [PubMed] [Google Scholar]
- 31). Park J, Kwon Y, Park H: Effects of 24-Week Aerobic and Resistance Training on Carotid Artery Intima-Media Thickness and Flow Velocity in Elderly Women with Sarcopenic Obesity. J Atheroscler Thromb, 2017; 24: 1117-1124 [DOI] [PMC free article] [PubMed] [Google Scholar]
- 32). Ochi M, Kohara K, Tabara Y, Kido T, Uetani E, Ochi N, Igase M, Miki T: Arterial stiffness is associated with low thigh muscle mass in middle-aged to elderly men. Atherosclerosis, 2010; 212: 327-332 [DOI] [PubMed] [Google Scholar]
- 33). Holecek M: Beta-hydroxy-beta-methylbutyrate supplementation and skeletal muscle in healthy and muscle-wasting conditions. J Cachexia Sarcopenia Muscle, 2017; 8: 529-541 [DOI] [PMC free article] [PubMed] [Google Scholar]