

Abstract
Objective
SARS-CoV-2 is a worldwide health emergency with unrecognized clinical features. This paper aims to review the most recent medical imaging techniques used for the diagnosis of SARS-CoV-2 and their potential contributions to attenuate the pandemic. Recent researches, including artificial intelligence tools, will be described.
Methods
We review the main clinical features of SARS-CoV-2 revealed by different medical imaging techniques. First, we present the clinical findings of each technique. Then, we describe several artificial intelligence approaches introduced for the SARS-CoV-2 diagnosis.
Results
CT is the most accurate diagnostic modality of SARS-CoV-2. Additionally, ground-glass opacities and consolidation are the most common signs of SARS-CoV-2 in CT images. However, other findings such as reticular pattern, and crazy paving could be observed. We also found that pleural effusion and pneumothorax features are less common in SARS-CoV-2. According to the literature, the B lines artifacts and pleural line irregularities are the common signs of SARS-CoV-2 in ultrasound images. We have also stated the different studies, focusing on artificial intelligence tools, to evaluate the SARS-CoV-2 severity. We found that most of the reported works based on deep learning focused on the detection of SARS-CoV-2 from medical images while the challenge for the radiologists is how to differentiate between SARS-CoV-2 and other viral infections with the same clinical features.
Conclusion
The identification of SARS-CoV-2 manifestations on medical images is a key step in radiological workflow for the diagnosis of the virus and could be useful for researchers working on computer-aided diagnosis of pulmonary infections.
Abbreviations: AI, Artificial intelligence; CNN, Convolutional neural network; CT, Computed tomography; CXR, Chest X-ray; DNN, Deep neural network; GAN, Generative adversarial network; GGO, Ground-glass opacities
Keywords: SARS-CoV-2, Medical imaging techniques, Artificial intelligence, Clinical findings, Chest CT
1. Introduction
The emergence of a novel coronavirus SARS-CoV-2 in china has affected more than 213 countries and nearly 49 million peoples worldwide.1 The World Health Organization (WHO) has considered this virus as a global pandemic and several control measures have been taken to attenuate the spread of this outbreak.2 The SARS-CoV-2 infection is a member of the “coronaviruses” family. It belongs especially to the beta group, which contains the highly pathogenic viruses in humans, such as SARS-CoV and MERS-CoV.3 Although there is a strong similarity between SARS-CoV-2 and SARS-CoV, the origin and the transmission mechanism of this newly emerged virus are still unknown.4 Thus, The SARS-CoV-2 continues to spread rapidly over the world with the absence of a vaccine or specific treatment.5
2. Clinical characteristics of SARS-CoV-2
While the highly pathogenic virus mainly affects peoples through respiratory droplets, it can be transmitted by way of environmental contact.6 , 7 Other studies8 , 9 suggested that, unlike the other respiratory viruses, the SARS-CoV-2 could be transmitted via the oral-fecal route. A recent study, carried out by Xia et al.,10 on stool specimens of 71 patients with SARS-CoV-2, demonstrated that 39 patients were tested positives for fecal SARS-CoV-2 RNA which support the hypothesis that fecal-oral transmission could be an additional route for the spread of the virus. The commonly SARS-CoV-2 symptoms are fever, cough and fatigue.[11], [12], [13] Other gastrointestinal symptoms could be observed in the infected peoples such as diarrhea, nausea and loss of appetite.14 , 15 It is also imported to note, that the virus transmission could occur without any symptom; therefore, the asymptomatic persons are a potential source of virus transmission. For this reason, strict adherence to the environment, hand hygiene and contact isolation are required to ensure a viral control. The angiotensin-converting enzyme 2 (ACE2) is the cell receptor for SARS-CoV-2 and other severe respiratory syndrome viruses.16 It plays an essential role in the regulation of intestinal inflammation and the control of cardiac physiology. However, it has been reported that the ACE2 is the cell-surface receptor for the virus, which facilitates viral RNA entry in the lungs.17 , 18
3. The role of medical imaging techniques in the diagnosis of SARS-CoV-2
The reverse-transcription polymerase chain reaction (RT-PCR) is the commonly used technique for the detection of SARS-CoV-2. This biochemical reaction uses Ribo Nucleic Acids (RNA) instead of Deoxyribo Nucleic Acids (DNA) as a first template.19 In the reverse transcription process, the reverse transcriptase enzyme uses the RNA to produce a complementary single-stranded DNA. Then the new complementary single DNA is converted into double-stranded DNA before its use as a template for a PCR reaction.20 , 21
Although many efforts have been conducted to maximize the number of PCR tests per day, this technique still suffers from some limitations, among them, we can note the high rate of false-negative detected in patients presenting SARS-CoV-2, the non-availability of PCR reagent and kits and the relatively long time process of this technique.22 In such a setting, other more accurate techniques or methods are needed to help in the diagnosis of persons with suspected SARS-CoV-2.
In this context, medical imaging techniques play an important role in the stratifying of patients selected from first-line clinical triage and in the characterization of pulmonary involvement of SARS-CoV-2. In the following of this section, the role of medical imaging in combating the outbreak of SARS-CoV-2 and obtained results of each imaging techniques are discussed.
3.1. Chest X-ray
Considering the high number of clinical suspicions of SARS-CoV-2, the Chest X-ray (CXR) technique could be a useful tool for the detection of the virus, since its availability compared to CT devices. In some countries like Spain, CXR is the first imaging modality used for the diagnosis of patients with suspected infection.23
3.1.1. CXR findings
The main features observed in radiographic images of patients with SARS-CoV-2 were ground-glass opacities (GGO), pulmonary nodules and interstitial changes.24 , 25
The GGO were defined as hazy areas with increased lung density without obscuration of bronchial structures and vessels (see Fig. 1 ).26
Fig. 1.
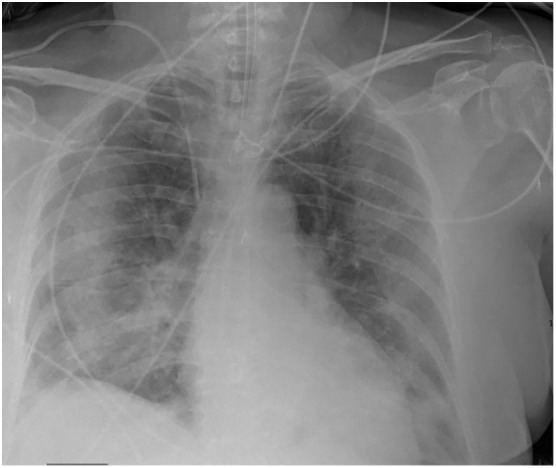
A 71-year-old female, with SARS-CoV-2, CXR shows extensive parenchymal peripheral opacities in all pulmonary lobes.
In a recent study, carried out by Wong et al.27 on 64 patients with confirmed SARS-CoV-2, the consolidation and GGO features were present in CXR images associated with 51 patients. Another finding of this study is that the peripheral and lower zones are the most common location of these abnormalities, which could be explained by the fact that cells in those areas express more ACE2.28 Similarly, a retrospective study established by Weinstock et al.29 based on a database of 718 patients with SARS-COV-2, showed that 33.8% of pulmonary abnormalities were identified in the lower lobe. In another study, including 99 patients with confirmed SARS-COV-2, bilateral pneumonia was identified in 75% of CXR images.30 Yoon et al.31 demonstrated that GGO and post-inflammatory focal atelectasis were frequently found in the chest radiography of SARS-COV-2 patients and 80% of the opacities were identified in the peripheral lungs.
A comparative study between Chest X-ray and Computed Tomography (CT) findings for COVID-affected patients was introduced by NG et al.32 Authors showed several cases of normal CXR, which present pulmonary abnormities on the CT thorax. This finding highlights the less specificity of CXR in comparison with CT.
Furthermore, other studies reported that a proportion of patients with positive RT-PCR test had initially a normal CXR or CT findings,33 , 34 which support the hypothesis that radiological findings of SARS-CoV-2 correlate with disease stage.
Given the increased number of suspected cases, the use of CXR could play a discriminable role. It may prevent the need for CT examination, particularly in the countries with limited access to the RT-PCR technique. However, in the case of highly clinically suspected, an RT-PCR test or CT should be performed.
3.2. Chest computed tomography (CT)
According to recent clinical experience, Chest Computed Tomography (CT) is considered as the most accurate diagnostic modality of SARS-CoV-2 infection.35 Although the presence of other early diagnosis tests of viral diseases such as RT-PCR and biomarkers,36 , 37 The CT images provide more evidence of virus progression and it is recommended mainly for asymptomatic patients with negative nucleic acid testing.38 In fact, sensitivity of chest CT is greater than RT-PCR in the identification of SARS-CoV-2 infection as shown in Fang et al.39 works. and as was demonstrated in a study that covered 1014 patients with positive RT-PCR test that showed a sensitivity of 97% of chest CT in the detection of SARS-CoV-2.40
3.2.1. Chest CT findings
Several studies in literature showed that GGO and consolidation are the most common signs of SARS-CoV-2 in CT images.41 , 42 Li et al.43 conducted a study on 51 patients with SARS-CoV-2 confirmed by RT-PCR and they reported that 96.1% of CT images reveal GGO or consolidation sign.
Chen et al.44 reported that 75% of SARS-CoV-2 patients had bilateral pneumonia on CT images. Other interesting features were also found in CT images of SARS-COV-2 patients; among them, we can note the reticular pattern, which manifests as a collection of small linear opacities in the lung (see Fig. 2 ).45 , 46 Another common CT finding is the crazy-paving pattern that consists of linear patterns superimposed on a background of GGO (see Fig. 3 ).47 , 48 Other atypical features were demonstrated in CT images such as pleural effusion,49 , 50 lung fibrosis (see Fig. 4 ) and airway changes.51 , 52
Fig. 2.
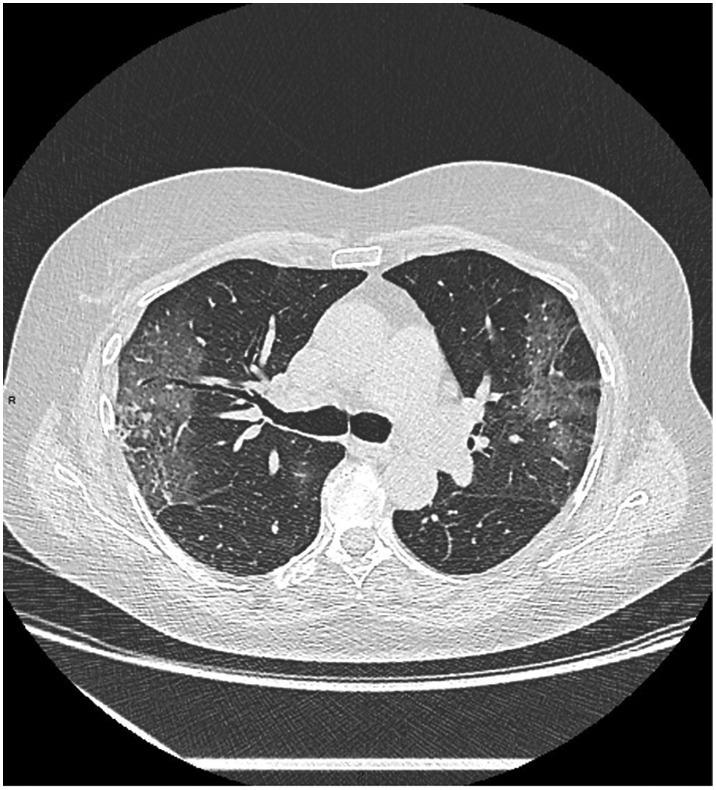
A 73-year-old female, with SARS-CoV-2, presenting fever and worsening cough. Axial non-enhanced CT scan shows GGO and initial fine linear reticulations in the left and right lobes.
Fig. 3.

A 57 year-old male with SARS-CoV-2: (a) CT scan demonstrated an initial consolidation in the superior left lobe and a reticular pattern superimposed on the GGO, which the sign of crazy paving pattern, (b) Sagittal view non-enhanced CT scan reveals peripheral focal ground glass opacity in the left upper lobe; (c) 3 days after admission, a follow-up CT scan shows worsening multifocal GGO with extensive interlobular thickening.
Fig. 4.

A 63-year-old male with SARS-CoV-2: (a) CT scan shows mosaic distribution of GGO in all pulmonary lobes (b) after three weeks of intubation, a follow-up CT scan shows extensive peripheral fibrosis linear pattern.
3.2.2. Differential diagnosis
Although the characterization of SARS-CoV-2 features plays a critical role in the identification of the disease and follow-up, the CT manifestations are still nonspecific and the disease is difficult to isolate in the case of other severe pneumonia diseases such as SARS and MERS infections.53
In fact, multifocal GGO and consolidation are seen in patients with SARS, MERS and more recently in patients with SARS-CoV-2. Some works report that bilateral lung involvement is observed in patients with SARS-CoV-2, while SARS and MERS are characterized by unilateral chest abnormalities.54 Furthermore, pleural effusion and pneumothorax features are less common in SARS-CoV-2 and SARS while they are more common in MERS infection.55 , 56 Since the symptoms of SARS-CoV-2 are very similar to those of other viral infections, the association between CT imaging findings and epidemiological histories is needed to improve the diagnosis and to control the pandemic.
Although the importance of CT clinical features in the diagnosis and the monitoring of the virus, the CT examination still time-consuming in comparison with the other rapid tests.57 In addition, the CT scan is relatively less available because of the high volume of examination per day.
3.3. Chest ultrasound
While most published papers focused on the role of CXR and chest CT findings in the diagnosis of SARS-CoV-2, less attention was paid to the thoracic ultrasound imaging and their possible contributions to the identification of the virus. A preliminary study carried out by Peng et al. showed that thoracic ultrasound findings were similar to those of CT scans.58
3.3.1. Chest ultrasound findings
The screening of lung diseases is based on ultrasound artifacts interpretation arising from the pleural surface and the chest wall. According to Volpicelli et al.'s study, the B lines artifacts with their different forms are a common sign of SARS-CoV-2 in chest ultrasound images,59 particularly for subjects with middle severity. This artifact has gained a growing interest as a discriminative feature of pulmonary diseases and it is defined as discrete long wide bands that arise from the pleural line and moving synchronously with lung sliding.60 Additionally, pleural line irregularities can be seen as another sign of SARS-CoV-2 in ultrasound images. In normal lungs, the horizontal lines under the pleural line are separated by regular distance. For the patient with SARS-CoV-2, these pleural lines present an irregularity, discontinuity, and increased thickness.
Ultrasound modality could be useful to assess the presence of the new virus, given its availability and its low cost. Nevertheless, this technique is not able to examine the deep field of the lung due to several artifacts such as ring-down artifacts, mirroring, and acoustic shadowing. In clinical practice, the chest ultrasound is reserved for the screening of peripheral pulmonary abnormalities.61 Besides, most results on the characterization of SARS-CoV-2 using chest ultrasound are still preliminary and further studies should be conducted to confirm the role of this technique in the diagnosis of the virus. The main advantages and limitations of each medical technique used for the diagnosis of SARS-CoV-2 are summarized in Table 1 :
Table 1.
A summary of clinical SARS-CoV-2 features of chest CXR, chest CT and ultrasound techniques with main advantages and disadvantages.
| Medical imaging techniques for the diagnosis of SARS-CoV-2 | Main clinical SARS-CoV-2 features | Advantages | Disadvantages |
|---|---|---|---|
| Chest CXR |
|
|
|
| Chest CT |
|
|
|
| Chest Ultrasound |
|
|
|
4. The clinical impact of medical imaging based on artificial intelligence on the diagnosis of SARS-CoV-2
With the aim of dealing with the pandemic of SARS-CoV-2, the majority of countries adopted the strategy of isolation at home for suspected people which develop mild or moderate complications. The hospitalization is only required for subjects with severe complications like respiratory failure, cardiac injury, and severe pneumonia. However, this strategy resulted in a very high mortality rate compared to the number of affected subjects. The increase in mortality rate can be explained by the rapid health deterioration of subjects with SARS-CoV-2 and the lack of oxygen support.62 The majority of people with COVID-19 come to the emergency room with very serious complications.63 , 64
The use of medical imaging techniques in conjunction with artificial intelligence (AI) systems could play an important role by providing a fast and early identification tool of patients with severe diseases. Additionally, AI could be suitable to identify the main risk factors associated with the quick development of severe complications for patients with SARS-CoV-2, which will allow the optimization of the treatment plan. Based on intelligent scanning, some studies have already been conducted to detect SARS-CoV-2 and assess its severity using various medical imaging techniques.
Many machine learning algorithms, especially those based on deep learning, have been very successful in classification, segmentation, and quantification of pulmonary diseases. In fact, the main steps to detect lung abnormalities using deep learning approaches include a selection of the lung, extraction of image features from the region of interest and the use of the deep learning model to detect pulmonary abnormalities or infection. A state of the art on the different deep learning techniques used in the processing of SARS-CoV-2 patient images is presented. The main keywords used for identifying the relevant papers are the following: deep learning, artificial intelligence, SARS-COV-2, CT images, CXR images, COVID 19, prediction, feature extraction. All the returned results have been carefully reviewed and filtered. In the following section, we describe only the papers from literature that explicitly used deep learning models to predict SARS-CoV-2 from chest CT and CXR images. The recent studies including machine-learning approaches were not considered in this review.
It is important to note that computerized tomography is the most used medical imaging technique for the diagnosis of SARS-CoV-2 in many countries. This frequent use has made databases available to researchers. Recently, Li et al.65 developed a new fully automatic algorithm called COV-Net, able to detect SARS-CoV-2. The algorithm is based on the ResNet-50 for the selection of SARS-CoV-2 features. In their study, they used a large dataset of chest CT images including community-acquired pneumonia (CAP) and other non-pneumonia CT exams. The GGO, consolidation and bilateral involvement were used as features in the training stage to predict whether the virus infection is confirmed or not. Although the COV-Net algorithm can accurately identify the SARS-CoV-2 in CT images, it is not able to assess the level of severity of this infection. For the same purpose, Jin et al.66 used another algorithm based on 2D Convolutional Neural Network (CNN) to classify 10,250 CT images into four categories: SARS-CoV-2, non-pneumonia, CAP, and Influenza A/B. The dataset was collected from different centers and from publicly available datasets. The algorithm achieved a sensitivity of 90.19% and a specificity of 95.76%. However, its performance is still highly dependent on infection size. Additionally, the CNN classification algorithm focuses on some clinical features while others are ignored which could result in a misclassification between different categories. Another study, including 35,355 CT images, used UNet++ to detect viral pneumonia and specifically the SARS-CoV-2 infection.67 The average time to predict the presence of infection using this architecture is 41.34 s per patient and the algorithm includes the following CT features of SARS-CoV-2: GGO, paving and consolidation. It reached a sensitivity of 94.34% and a specificity of 99.16%. The main drawback of this classification algorithm is the use of manual annotation of training segmentation, which is prone to inter-observer variability.
To overcome this limitation, Zheng et al.68 used a weakly supervised algorithm based on 3D deep neural network (DNN) to reduce radiologist's annotation efforts. The DNN algorithm is able to predict the probability of SARS-CoV-2 infection with a sensitivity of 90.7% and a specificity of 91.1%. Since the algorithm has been tested on a limited number of training CT volumes, other studies based on larger datasets should be conducted to validate its performance. Similarly, Xu al.69 used a 3D CNN to classify CT images into three categories: SARS-CoV-2, influenza viral pneumonia and no infection. In their algorithm, they used nodules, focal opacities, and the detection of larger-sized diffuse opacities as features to differentiate between SARS-CoV-2 and other influenza viral pneumonia. The findings of their study reported an area under the ROC curve (AUC) of 0.86.
Ying et al.70 developed a new algorithm called “Details Relation Extraction neural network (DRE-Net)” to discriminate between patients with SARS-CoV-2 and bacteria pneumonia infected patients. As a result, they achieved a sensitivity of 96% but this study is still preliminary since they only used GGO abnormality as SARS-CoV-2 feature. More recently, Gozes et al.71 used the Unet model combined with ResNet-50 to classify the lung as normal or infected with SARS-CoV-2. The main advantage of this technique is the integration of new metric score based on the size of patient lung as criteria of SARS-CoV-2 severity.
While many researches have reported promising results based on AI for the diagnosis of SARS-CoV-2 using CT Images, a few studies have focused on the detection of this virus using CXR images.72 , 73 Among them, we can point out the study of Abbas et al.74 that applied the CNN model on 1764 CXR images to detect SARS-CoV-2 infection. Although they achieved a sensitivity of 97.91% and a specificity of 91.87%, the algorithm performance is still constrained by the irregularities of the CXR data. Similarly, another study, conducted on 13,800 CXR images, used a DNN algorithm for the same purpose.75 The main specificity of this algorithm is that a human specified design requirement was added to optimize the microarchitecture design and to accurately identify the positive SARS-CoV-2. In addition to the methods described above, Narin et al.76 established a comparison between five pre-trained CNN based models for the detection of the SARS-CoV-2 virus: ResNet-50, inception V3, ResNet-101, ResNet-152 and Inception-ResNet2. In their study, they demonstrated that the ResNet-50 gives the highest accuracy (98%). However, this study was conducted on 7406 CXR images including only 341 with SARS-CoV-2 while the remaining images are associated to healthy, viral, and bacterial pneumonia cases.
The detection of SARS-CoV-2 infection using CXR is very challenging, especially with the limited availability of large datasets and annotated data. To overcome this issue, some works have attempted to use Generative Adversarial Network (GAN) combined with other deep learning models to overcome the limited number of CXR dataset.77 The GAN algorithm can be defined as a data augmentation approach able to increase the number of training images, even with limited data.78 Table 2 shows an overview of the literature on this topic, where the deep learning technique used to detect SARS-CoV-2, the imaging modality, the number of images studied, and the sensitivity, specificity and AUC are summarized:
Table 2.
A summary of existing deep learning approaches applied for the detection of SARS-CoV-2 infection using CT and CXR images.
| Selected works | Algorithm name | Type of data | Number of images (N) | Data source | Data distribution | Application | Performances |
|---|---|---|---|---|---|---|---|
| Li et al.65 | ResNet-50 | CT | N = 4352 30% SARS-CoV-2 40% CAP 30% non-pneumonia. |
Six hospitals in China | Training. = 90% Testing =10% |
Prediction of the presence or not of the virus infection | AUC: 0.96 Specificity: 96% Sensitivity: 90% |
| Chen et al.67 | UNet++ | CT | N = 35,355 60% SARS-CoV-2 40% controls |
Renmin Hospital of Wuhan University, China | Training. = 80% Testing =20% |
Detection of SARS-CoV-2 infection | Specificity: 99.16% Sensitivity: 94.34% Accuracy:98.85% PPV:88.37% NPV:99.61% |
| Jin et al.66 | 2D CNN | CT | N = 10,250 | Random distribution | Detection of SARS-CoV-2 | AUC: 0.97 Specificity: 95.76% Sensitivity: 90.19% |
|
| Zheng et al.68 | 3D DNN | CT | N = 630 58% SARS-CoV-2 42% controls |
Three hospitals from Wuhan, China | Training = 80% Testing =20% |
Prediction of the probability of SARS-CoV-2 infection | AUC: 0.95 Specificity: 91.1% Sensitivity: 90.7% |
| Xu et al.69 | 3D CNN | CT | N = 618 35.4% SARS-CoV-2 36.2% Influenza viral pneumonia 28.3% controls |
Three hospitals from Zhejiang, China | Training+ validation =85% Testing =14.6% |
Classification of the lung into three categories:
|
AUC: 0.86 |
| Ying et al.70 | Details Relation Extraction neural network (DRE-Net) | CT | N = 1990 39% SARS-CoV-2 25.37% bacteria pneumonia 35.57% controls |
Renmin Hospital of Wuhan and two affiliated hospitals of Sun Yat-sen University, China | Training. = 60% Testing =30% Validation = 10% |
Discrimination between SARS-CoV-2 patients and bacteria pneumonia infected patients | AUC: 0.95 Sensitivity: 96% |
| Gozes et al.71 | UNet architecture and ResNet-50 | CT | N = 1865 44.45% SARS-CoV-2 55.54% controls |
|
Random distribution | Classification of the lung as normal or abnormal (SARS-CoV-2) | AUC: 0.94 |
| Javaheri et al.82 | UNet architecture | CT | N = 89,145 36.1% SARS-CoV-2 28.8% CAP or other viral infections 35% controls |
Five hospitals from Iran | Training. = 90% Testing =10% |
Classification of the lung into three categories:
|
AUC: 0.96 Specificity: 94% Sensitivity: 87.5% |
| Wang et al.83 | Transfer learning neural network based on the inception network | CT | N = 1065 30.5% SARS-CoV-2 69.5% controls |
Three hospitals from China | Random distribution | Identification of viral pneumonia images | AUC: 0.93 Specificity: 88% Sensitivity: 87% |
| Abbas et al.74 | CNN | CXR | N = 1764 |
|
Training. = 70% Testing =30% |
Detection of SARS-CoV-2 infection | AUC: 0.93 Specificity: 91.87% Sensitivity: 97.91% |
| Ozturk et al.85 | Modified CNN model called “Darknet” | CXR | 1125 11.1% SARS-CoV-2 44.4% Pneumonia 44.4% No finding |
Two publicly database84,86 | Training + validation. = 80% Testing =20% |
Classification of CXR images in two categories:
|
Specificity: 95.3% Sensitivity: 95.13% Accuracy: 98.08% |
Classification of CXR images into three categories:
|
Specificity: 92.15% Sensitivity: 85.35% Accuracy: 87.02% |
||||||
| Wang et al.72 | DNN | CXR | 13,800 2.56% SARS-CoV-2 57.7% Pneumonia 39.6% healthy |
Five publicly database84,87., 88., 89., 90. | Training. = 80% Testing =20% |
Classification of the lung into three categories:
|
Sensitivity: 91% Accuracy: 93.3% PPV: 91.9% |
| Zhang et al.91 | CNN | CXR | 43,637 | Two publicly database84,92 | Random distribution | Identification of SARS-CoV-2 | AUC: 0.951 Specificity: 97.97% Sensitivity: 72% |
5. Future works
While many studies based on AI have been conducted to diagnose SARS-CoV-2 using medical imaging, further clinical validation should be performed to support their inclusion in clinical practice. Several recent studies trained their deep learning algorithm on medical images, including advanced infections. Therefore, they are less sensitive to detect the early sign of the virus. Additionally, most of the reported works focused on the detection of SARS-CoV-2 from medical images while the main challenge for the radiologists is how to differentiate between SARS-CoV-2 and other viral infections with the same clinical features such as SARS and MERS infections. To address this issue, other future works are needed to extract the most relevant features and anatomical signatures able to differentiate between different viruses. Furthermore, large, manually labeled training data are required. Finally, more attention should be paid on how to predict patient outcomes and to track disease evolution.
6. Available datasets
CT open datasets can be found in their corresponding websites listed below:
- SARS-CoV-2 CXR Datasets
- A SARS-CoV-2 Mixed Datasets (CXR and CT)
7. Conclusions
Identification and localization of SARS-CoV-2 manifestations on medical images is a key step in radiological workflow for the diagnosis of the new virus. In this review, we highlight the main signs of SARS-CoV-2 in CXR, CT and US images. Most of the reported studies reveal that CT imaging findings play an important role in the diagnosis of a patient with suspected SARS-CoV-2 infection. Moreover, the development of computational algorithms based on deep learning models has shed new light on the detection of SARS-CoV-2 using medical images analysis. However, many efforts are still required to assess disease progression and futures multicenter studies on large datasets are needed to improve the diagnosis and to control the transmission. Beyond medical images analysis, other promising AI studies, including robotics, vaccine discovery, protein structure prediction and molecular modeling, could be used to fight against the virus.
Funding
The authors state that this research did not receive any specific grant from funding agencies in the public, commercial, or not-for-profit sectors.
Informed consent
Written informed consent was waived by the Institutional Review Board.
Ethical approval
Institutional Review Board approval was obtained by Military Hospital of Instruction of Tunis, Tunisia.
Declaration of competing interest
There is no conflict of interest.
References
- 1.World Health Organization. Coronavirus disease (COVID-19) outbreak, Geneva: WHO, Available at: https://www.who.int/emergencies/diseases/ novel-coronavirus-2019 2020 (Last accessed 06 November 2020).
- 2.World Health Organization. Coronavirus disease (COVID-19) outbreak, Geneva: WHO, Available at: https://www.who.int/emergencies/diseases/novel-coronavirus 2019/events-as-they-happen 2020 (Last accessed 13 October 2020).
- 3.Andersen K.G., Rambaut A., Lipkin W.I., Holmes E.C., Garry R.F. The proximal origin of SARS-CoV-2. Nat Med. 2020;26:450–452. doi: 10.1038/s41591-020-0820-9. [DOI] [PMC free article] [PubMed] [Google Scholar]
- 4.JS and Smith DW. COVID-19: a novel zoonotic disease caused by a coronavirus from China: what we know and what we don't. Microbiol Aust 2020. doi: 10.1071/MA20013. [DOI] [PMC free article] [PubMed]
- 5.Amanat F., Krammer F. SARS-CoV-2 vaccines: status report. Immunity. 2020;52(4):583–589. doi: 10.1016/j.immuni.2020.03.007. [DOI] [PMC free article] [PubMed] [Google Scholar]
- 6.Liu J, Liao X, Qian S, Yuan J, Wang F, Liu Y, Wang Z, Wang FS, Liu L, Zhang Z. Community transmission of severe acute respiratory syndrome coronavirus 2, Shenzhen, China, 2020. Emerg Infect Dis 2020. 10.3201/eid2606.200239. [DOI] [PMC free article] [PubMed]
- 7.Jiang F., Deng L., Zhang L., Cai Y., Cheung C.W., Xia Z. Review of the clinical characteristics of coronavirus disease 2019 (COVID-19) J Gen Intern Med. 2020 doi: 10.1007/s11606-020-05762-w. [DOI] [PMC free article] [PubMed] [Google Scholar]
- 8.Yeo C., Kaushal S., Yeo D. Enteric involvement of coronaviruses: is faecal-oral transmission of SARS-CoV-2 possible? Lancet Gastroenterol Hepatol. 2020;5(4):335–337. doi: 10.1016/S2468-1253(20)30048-0. [DOI] [PMC free article] [PubMed] [Google Scholar]
- 9.Gu J., Han B., Wang J. COVID-19: gastrointestinal manifestations and potential fecal-oral transmission. Gastroenterology. 2020;158(6):1518–1519. doi: 10.1053/j.gastro.2020.02.054. [DOI] [PMC free article] [PubMed] [Google Scholar]
- 10.Xu Y., Li X., Zhu B., et al. Characteristics of pediatric SARS-CoV-2 infection and potential evidence for persistent fecal viral shedding. Nat Med. 2020;26(4):502–505. doi: 10.1038/s41591-020-0817-4. [DOI] [PMC free article] [PubMed] [Google Scholar]
- 11.Fu L., Wang B., Yuan T., et al. Clinical characteristics of coronavirus disease 2019 (COVID-19) in China: a systematic review and meta-analysis. J Infect. 2020 doi: 10.1016/j.jinf.2020.03.041. [DOI] [PMC free article] [PubMed] [Google Scholar]
- 12.Pernazza A., Mancini M., Rullo E., et al. Early histologic findings of pulmonary SARS-CoV-2 infection detected in a surgical specimen. Virchows Arch. 2020 doi: 10.1007/s00428-020-02829-1. [DOI] [PMC free article] [PubMed] [Google Scholar]
- 13.Zhang R., Ouyang H., Fu L., et al. CT features of SARS-CoV-2 pneumonia according to clinical presentation: a retrospective analysis of 120 consecutive patients from Wuhan city. Eur Radiol. 2020:1–10. doi: 10.1007/s00330-020-06854-1. [DOI] [PMC free article] [PubMed] [Google Scholar]
- 14.Cholankeril G., Podboy A., Aivaliotis V.I., et al. High prevalence of concurrent gastrointestinal manifestations in patients with SARS-CoV-2: early experience from California. Gastroenterology. 2020 doi: 10.1053/j.gastro.2020.04.008. [DOI] [PMC free article] [PubMed] [Google Scholar]
- 15.Xiao F, Tang M, Zheng X, Liu Y, Li X, Shan H. Evidence for gastrointestinal infection of SARS-CoV-2. Gastroenterology 2020;158(6):1831–1833.e3. doi: 10.1053/j.gastro.2020.02.055. [DOI] [PMC free article] [PubMed]
- 16.Zhang H., Penninger J.M., Li Y., Zhong N., Slutsky A.S. Angiotensin-converting enzyme 2 (ACE2) as a SARS-CoV-2 receptor: molecular mechanisms and potential therapeutic target. Intensive Care Med. 2020;46(4):586–590. doi: 10.1007/s00134-020-05985-9. [DOI] [PMC free article] [PubMed] [Google Scholar]
- 17.Jia H.P., Look D.C., Shi L., et al. ACE2 receptor expression and severe acute respiratory syndrome coronavirus infection depend on differentiation of human airway epithelia. J Virol. 2005;79(23):14614–14621. doi: 10.1128/JVI.79.23.14614-14621.2005. [DOI] [PMC free article] [PubMed] [Google Scholar]
- 18.Misra D.P., Agarwal V., Gasparyan A.Y., Zimba O. Rheumatologists’ perspective on coronavirus disease 19 (COVID-19) and potential therapeutic targets. Clin Rheumatol. 2020 doi: 10.1007/s10067-020-05073-9. [DOI] [PMC free article] [PubMed] [Google Scholar]
- 19.Schrader A.J., Lauber J., Lechner O., Heidenreich A., Hofmann R., Buer J. Application of real-time reverse transcriptase-polymerase chain reaction in urological oncology. J Urol. 2003;169(5):1858–1864. doi: 10.1097/01.ju.0000047363.03411.6b. [DOI] [PubMed] [Google Scholar]
- 20.Carter M, Shieh J. Molecular cloning and recombinant DNA technology, in: Guide to research techniques in neuroscience (Second Edition), Academic Press, 2015.
- 21.Yan C., Cui J., Huang L., et al. Rapid and visual detection of 2019 novel coronavirus (SARS-CoV-2) by a reverse transcription loop-mediated isothermal amplification assay. Clin Microbiol Infect. 2020 doi: 10.1016/j.cmi.2020.04.001. [DOI] [PMC free article] [PubMed] [Google Scholar]
- 22.Xue H., Jin Z. The appropriate position of radiology in COVID-19 diagnosis and treatment—current status and opinion from China. Chinese Journal of Academic Radiology. 2020 doi: 10.1007/s42058-020-00030-6. [DOI] [PMC free article] [PubMed] [Google Scholar]
- 23.Marti M. Imaging of the coronavirus disease Covid-19. Available at: https://healthcare-in-europe.com/en/news/imaging-the-coronavirus-disease-covid-19.html, 2020.
- 24.Xu X., Yu C., Qu J., et al. Imaging and clinical features of patients with 2019 novel coronavirus SARS-CoV-2. Eur J Nucl Med Mol Imaging. 2020;47(5):1275–1280. doi: 10.1007/s00259-020-04735-9. [DOI] [PMC free article] [PubMed] [Google Scholar]
- 25.Jacobi A., Chung M., Bernheim A., Eber C. Portable chest X-ray in coronavirus disease-19 (COVID-19): a pictorial review. Clin Imaging. 2020;64:35–42. doi: 10.1016/j.clinimag.2020.04.001. [DOI] [PMC free article] [PubMed] [Google Scholar]
- 26.Gao JW, Rizzo S, Ma LH, Qiu XY, Warth A, Seki N, Hasegawa M, Zou JW, Li Q, Femia M, Lv TF, Song Y; written on behalf of the AME Lung Cancer Collaborative Group. Pulmonary ground-glass opacity: computed tomography features, histopathology and molecular pathology. Transl Lung Cancer Res 2020; 6(1) :68–75. doi: 10.21037/tlcr.2017.01.02. [DOI] [PMC free article] [PubMed]
- 27.Wong H.Y.F., Lam H.Y.S., Fong A.H., et al. Frequency and distribution of chest radiographic findings in COVID-19 positive patients. Radiology. 2020 doi: 10.1148/radiol.2020201160. [DOI] [PMC free article] [PubMed] [Google Scholar]
- 28.Verdecchia P., Cavallini C., Spanevello A., Angeli F. The pivotal link between ACE2 deficiency and SARS-CoV-2 infection. Eur J Intern Med. 2020 doi: 10.1016/j.ejim.2020.04.037. [DOI] [PMC free article] [PubMed] [Google Scholar]
- 29.Weinstock M.B., Echenique A., Russell J.W., et al. a normal chest X-ray is no guarantee; Journal of Urgent Care Medicine: 2020. Chest X-ray findings in 636 ambulatory patients with COVID-19 presenting to an urgent care center. [Google Scholar]
- 30.Chen N., Zhou M., Dong X., et al. Epidemiological and clinical, characteristics of 99 cases of 2019 novel coronavirus pneumonia in Wuhan, China: a descriptive study. Lancet. 2020;395:507–513. doi: 10.1016/S0140-6736(20)30211-7. [DOI] [PMC free article] [PubMed] [Google Scholar]
- 31.Yoon S.H., Lee K.H., Kim J.Y., et al. Chest radiographic and CT findings of the 2019 novel coronavirus disease (COVID-19): analysis of nine patients treated in Korea. Korean J Radiol. 2020;21(4):494–500. doi: 10.3348/kjr.2020.0132. [DOI] [PMC free article] [PubMed] [Google Scholar]
- 32.Ng MY, Lee E, Yang J. Imaging profile of the COVID-19 infection: radiologic findings and literature review. Radiol Cardiothorac Imaging 2020. doi: 10.1148/ryct.2020200034. [DOI] [PMC free article] [PubMed]
- 33.Tapé C., Byrd K.M., Aung S., Lonks J.R., Flanigan T.P., Rybak N.R. COVID-19 in a patient presenting with syncope and a normal chest X-ray. R I Med J. 2020;103(3):50–51. [PMC free article] [PubMed] [Google Scholar]
- 34.Liang T., Liu Z., Wu C.C., et al. Evolution of CT findings in patients with mild COVID-19 pneumonia. Eur Radiol. 2020 doi: 10.1007/s00330-020-06823-8. [DOI] [PMC free article] [PubMed] [Google Scholar]
- 35.Majidi H. Chest CT in patients suspected of COVID-19 infection: A reliable alternative for RT-PCR. Am J Emerg Med. 2020 doi: 10.1016/j.ajem.2020.04.016. [DOI] [PMC free article] [PubMed] [Google Scholar]
- 36.Mardani R., Vasmehjani A.A., Zali F., et al. Laboratory parameters in detection of COVID-19 patients with positive RT-PCR; a diagnostic accuracy study. Arch Acad Emerg Med. 2020;8(1) [PMC free article] [PubMed] [Google Scholar]
- 37.Li H., Xiang X., Ren H., Xu L., Zhao L., Chen X. SAA is a biomarker to distinguish the severity and prognosis of coronavirus disease 2019 (COVID-19) J Infect. 2020 doi: 10.1016/j.jinf.2020.03.035. [DOI] [Google Scholar]
- 38.Meng H., Xiong R., He R., et al. CT imaging and clinical course of asymptomatic cases with COVID-19 pneumonia at admission in Wuhan. China J Infect. 2020 doi: 10.1016/j.jinf.2020.04.004. [DOI] [PMC free article] [PubMed] [Google Scholar]
- 39.Fang Y., Zhang H., Xie J., et al. Sensitivity of chest CT for COVID-19: comparison to RT-PCR. Radiology. 2020 doi: 10.1148/radiol.2020200432. [DOI] [PMC free article] [PubMed] [Google Scholar]
- 40.Ai T., Yang Z., Hou H., et al. Correlation of chest CT and RT-PCR testing in coronavirus disease 2019 (COVID-19) in China: a report of 1014 cases. Radiology. 2020 doi: 10.1148/radiol.2020200642. [DOI] [PMC free article] [PubMed] [Google Scholar]
- 41.Cheng Z., Lu Y., Cao Q., et al. Clinical features and chest CT manifestations of coronavirus disease 2019 (COVID-19) in a single-center study in Shanghai. China AJR Am J Roentgenol. 2020 doi: 10.2214/AJR.20.22959. [DOI] [PubMed] [Google Scholar]
- 42.Shi H., Han X., Jiang N., et al. Radiological findings from 81 patients with COVID-19 pneumonia in Wuhan, China: a descriptive study. Lancet Infect Dis. 2020;20(4):45–434. doi: 10.1016/S1473-3099(20)30086-4. [DOI] [PMC free article] [PubMed] [Google Scholar]
- 43.Li Y., Xia L. Coronavirus disease 2019 (COVID-19): role of chest CT in diagnosis and management. AJR Am J Roentgenol. 2020 doi: 10.2214/AJR.20.22954. [DOI] [PubMed] [Google Scholar]
- 44.Chen N., Zhou M., Dong X., et al. Epidemiological and clinical characteristics of 99 cases of 2019 novel coronavirus pneumonia in Wuhan. China: A Descriptive Study Lancet. 2020;395(10223):507–513. doi: 10.1016/S0140-6736(20)30211-7. [DOI] [PMC free article] [PubMed] [Google Scholar]
- 45.Ye Z, Zhang Y, Wang Y, Huang Z, Song. Chest CT manifestations of new coronavirus disease 2019 (COVID-19): a pictorial review. Eur Radiol 2020. 10.1007/s00330-020-06801-0. [DOI] [PMC free article] [PubMed]
- 46.Oikonomou A, Prassopoulos P. Mimics in chest disease: interstitial opacities. Insights Imaging 2013; 4:9–27.DOI: 10.1007/s13244-012-0207-7. [DOI] [PMC free article] [PubMed]
- 47.Hani C., Trieu N.H., Saab I., et al. COVID-19 pneumonia: a review of typical CT findings and differential diagnosis. Diagn Interv Imaging. 2020;10(5):263–268. doi: 10.1016/j.diii.2020.03.014. [DOI] [PMC free article] [PubMed] [Google Scholar]
- 48.Wever W.D., Meersschaert J., Coolen J., Verbeken E., Verschakelen J.A. The crazy-paving pattern: a radiological-pathological correlation. Insights Imaging. 2013;2(2):117–132. doi: 10.1007/s13244-010-0060-5. [DOI] [PMC free article] [PubMed] [Google Scholar]
- 49.Zhou S., Wang Y., Zhu T., Xia L. CT features of coronavirus disease 2019 (COVID-19) pneumonia in 62 patients in Wuhan. China. AJR Am J Roentgenol. 2020 doi: 10.2214/AJR.20.22975. [DOI] [PubMed] [Google Scholar]
- 50.Abramowitz Y., Simanovsky N., Goldstein M.S. Hiller N Pleural effusion: characterization with CT attenuation values and CT appearance. AJR Am J Roentgenol. 2009;192(3):618–623. doi: 10.2214/AJR.08.1286. [DOI] [PubMed] [Google Scholar]
- 51.Lomoro P., Verde F., Zerboni F., et al. COVID-19 pneumonia manifestations at the admission on chest ultrasound, radiographs, and CT: single-center study and comprehensive radiologic literature review. Eur J Radiol Open. 2020 doi: 10.1016/j.ejro.2020.100231. [DOI] [PMC free article] [PubMed] [Google Scholar]
- 52.Tian S., Hu W., Niu L., Liu H., Xu H., Xiao S.Y. Pulmonary pathology of early phase 2019 novel corona-virus (COVID-19) pneumonia in two patients with lung cancer. J Thorac Oncol. 2020;15:700–704. doi: 10.1016/j.jtho.2020.02.010. [DOI] [PMC free article] [PubMed] [Google Scholar]
- 53.Lei J., Li J., Li X., Qi X. CT imaging of the 2019 novel coronavirus (2019-nCoV) pneumonia. Radiology. 2020;295(1):18. doi: 10.1148/radiol.2020200236. [DOI] [PMC free article] [PubMed] [Google Scholar]
- 54.Zhao X., Liu B., Yu Y., et al. The characteristics and clinical value of chest CT images of novel coronavirus pneumonia. Clin Radiol. 2020;75(5):335–340. doi: 10.1016/j.crad.2020.03.002. [DOI] [PMC free article] [PubMed] [Google Scholar]
- 55.Hosseiny M., Kooraki S., Gholamrezanezhad A., Reddy S., Myers L. Radiology perspective of coronavirus disease 2019 (COVID-19): lessons from severe acute respiratory syndrome and Middle East respiratory syndrome. Am J Roentgenol. 2020;214(5):1078–1082. doi: 10.2214/AJR.20.22969. [DOI] [PubMed] [Google Scholar]
- 56.Babyn P.S., Chu W.C.W., Tsou I.Y.Y., et al. Severe acute respiratory syndrome (SARS): chest radiographic features in children. Pediatr Radiol. 2004;34(1):47–58. doi: 10.1007/s00247-003-1081-8. [DOI] [PMC free article] [PubMed] [Google Scholar]
- 57.Li M. Chest CT features and their role in COVID-19. Radiol Infect Dis. 2020 doi: 10.1016/j.jrid.2020.04.001. [DOI] [PMC free article] [PubMed] [Google Scholar]
- 58.Peng Q., Wang X., Zhang L. Findings of lung ultrasonography of novel corona virus pneumonia during the 2019–2020 epidemic. Intensive Care Med. 2020 doi: 10.1007/s00134-020-05996-6. [DOI] [PMC free article] [PubMed] [Google Scholar]
- 59.Volpicelli G., Gargani L. Sonographic signs and patterns of COVID-19 pneumonia. Ultrasound J. 2020 doi: 10.1186/s13089-020-00171-w. [DOI] [PMC free article] [PubMed] [Google Scholar]
- 60.Gullett J., Donnelly J.P., Sinert R., et al. Interobserver agreemnt in the evaluation of b-lines using bedside. Ultrasound. 2015;30(6):1395–1399. doi: 10.1016/j.jcrc.2015.08.021. [DOI] [PubMed] [Google Scholar]
- 61.Dietrich C.F., Mathis G., Cui X.W., Ignee A., Hocke M., Hirche TO Ultrasound of the pleurae and lungs. Ultrasound Med Biol. 2015;41(2):351–365. doi: 10.1016/j.ultrasmedbio.2014.10.002. [DOI] [PubMed] [Google Scholar]
- 62.Deitrick K., Adams J., Davis J. Emergency nursing care of patients with novel coronavirus disease 2019. Emerg Nurs. 2020;46(6):748–759. doi: 10.1016/j.jen.2020.07.010. [DOI] [PMC free article] [PubMed] [Google Scholar]
- 63.Greenland J.R., Michelow M.D., Wang L., London M.J. 2020. COVID-19 infection implications for perioperative and critical care physicians anesthesiology. [DOI] [PMC free article] [PubMed] [Google Scholar]
- 64.World Health Organization: Clinical management of severe acute respiratory infection when novel coronavirus (nCoV) infection is suspected. Interim Guidance; Updated January 28, 2020. Available at:https://www.who.int/publications-detail/clinical-management-of-severe-acute-respiratory-infection-when-novel-coronavirus-(ncov)-infection-is-suspected (Last accessed 21 december 2020).
- 65.Li L., Qin L., Xu Z., et al. Artificial intelligence distinguishes covid-19 from community acquired pneumonia on chest ct. Radiology. 2020 doi: 10.1148/radiol.2020200905. [DOI] [PMC free article] [PubMed] [Google Scholar]
- 66.Jin C, Chen W, Cao Y, Xu Z, Zhang X, Deng L, Zheng C, Zhou J, Shi H, Feng J. Development and evaluation of an ai system for covid-19 diagnosis. medRxiv 2020. doi: 10.1101/2020.03.20.20039834. [DOI] [PMC free article] [PubMed]
- 67.Chen J, Wu L, Zhang J, Zhang L, Gong D, Zhao Y, Hu S, Wang Y, Hu X, Zheng B, Zhang K, Wu H, Dong Z, Xu Y, Zhu Y, Chen X, Yu L, Yu H. Deep learning-based model for detecting 2019 novel coronavirus pneumonia on high resolution computed tomography: a prospective study. medRxiv 2020. doi: 10.1101/2020.02.25.20021568. [DOI] [PMC free article] [PubMed]
- 68.Zheng C., Deng X., Fu Q., et al. Deep learning-based detection for COVID-19 from chest CT using weak label. MedRxiv. 2020 doi: 10.1101/2020.03.12.20027185. [DOI] [Google Scholar]
- 69.Xu X, Jiang X, Ma C, Du P, Li X, Lv S, Yu L, Chen Y, Su J, Lang G, Li Y, Zhao H, Xu K, Ruan L, Wu. Deep learning system to screen coronavirus disease 2019 pneumonia. ArXiv 2020, preprint arXiv:2002.09334. [DOI] [PMC free article] [PubMed]
- 70.Ying S., Zheng S., Li L., et al. Deep learning enables accurate diagnosis of novel coronavirus (COVID-19) with CT images. MedRxiv. 2020 doi: 10.1101/2020.02.23.20026930. [DOI] [PMC free article] [PubMed] [Google Scholar]
- 71.Gozes O, Frid-Adar M, Sagie N, Zhang H, Ji W, and Greenspan H. Coronavirus detection and analysis on chest CT with deep learning. ArXiv 2020, preprint arXiv:2004.02640.
- 72.Hall LO, Paul R, Goldgof DB and Goldgof GM. Finding Covid-19 from chest X-rays using deep learning on a small dataset. ArXiv 2020, preprint arXiv:2004.02060.
- 73.Apostolopoulos ID and Bessiana T. Covid-19: automatic detection from X-ray images utilizing transfer learning with convolutional neural networks. ArXiv 2020, preprint arXiv:2003.11617. [DOI] [PMC free article] [PubMed]
- 74.Abbas A, Abdelsamea MM, and Gaber MM. Classification of COVID-19 in chest X-ray images using DeTraC deep convolutional neural network. ArXiv 2020, preprint arXiv:2003.13815. [DOI] [PMC free article] [PubMed]
- 75.Wang L and Wong A. COVID-Net: a tailored deep convolutional neural network design for detection of COVID-19 cases from chest radiography images. ArXiv 2020, preprint arXiv:2003.09871, 2020. [DOI] [PMC free article] [PubMed]
- 76.Narin A, Kaya C, and Pamuk Z. Automatic detection of coronavirus disease (COVID-19) using X-ray images and deep convolutional neural networks, arXiv 2020, preprint arXiv:2003.10849. [DOI] [PMC free article] [PubMed]
- 77.Khalifa NEM, Taha MHN, Hassanien AE and Elghamrawy S. Detection of coronavirus (COVID-19) associated pneumonia based on generative adversarial networks and a fine-tuned deep transfer learning model using chest X-ray dataset. ArXiv 2020, preprint arXiv:2004.01184.
- 78.Wolterink JM, Kamnitsas K, Ledig C, Išgum I. Deep learning: generative adversarial networks and adversarial methods In: Handbook of medical image computing and computer assisted intervention, Academic Press 2020, pp. 547–574.
- 79.Armato S.G., 3rd, McLennan G., Bidaut L., et al. The lung image database consortium (LIDC) and image database resource initiative (IDRI): a completed reference database of lung nodules on CT scans. Med Phys. 2011;38:915–931. doi: 10.1118/1.3528204. [DOI] [PMC free article] [PubMed] [Google Scholar]
- 80.Tianchi Competition https://tianchi.aliyun.com/competition/entrance/ 231601/information (2017).
- 81.Zhang K., Liu X., Shen J., et al. Clinically applicable AI system for accurate diagnosis, quantitative measurements and prognosis of COVID-19 pneumonia using computed tomography. Cell. 2020;181:1423–1433. doi: 10.1016/j.cell.2020.04.045. [DOI] [PMC free article] [PubMed] [Google Scholar]
- 82.Javaheri T., Homayounfar M., Amoozga Z., et al. CovidCTNet: an open-source deep learning approach to identify Covid-19 using CT image. ArXiv. 2020 doi: 10.1038/s41746-021-00399-3. https://arxiv.org/abs/2005.03059 Available: [DOI] [PMC free article] [PubMed] [Google Scholar]
- 83.Wang S., Kang B., Ma J., et al. A deep learning algorithm using CT images to screen for corona virus disease (COVID-19) MedRxiv. 2020 doi: 10.1007/s00330-021-07715-1. [DOI] [PMC free article] [PubMed] [Google Scholar]
- 84.Cohen JP, Morrison P, Dao L. COVID-19 Image Data Collection, 2020. Available at: https://github.com/ieee 8023/COVID-chestxray-dataset.
- 85.Ozturk T., Talo M., Yildirim E.A., Baloglu U., Yildirim O., Acharya U.R. Automated detection of COVID-19 cases using deep neural networks with X-ray images. Comput Biol Med. 2020 doi: 10.1016/j.compbiomed.2020.103792. [DOI] [PMC free article] [PubMed] [Google Scholar]
- 86.Wang X, Peng Y, Lu L, Lu Z, Bagheri M, Summers RM. Chestx-ray8: hospital scale chest X-ray database and benchmarks on weakly-supervised classification and localization of common thorax diseases, in: Proceedings of the IEEE Conference on Computer Vision and Pattern Recognition 2017, pp. 2097–2106.
- 87.Chung A. Figure 1 COVID-19 chest X-ray data initiative. Available at: https://github.com/agchung/Figure1-COVID-chestxray-dataset (2020).
- 88.Chung A. Actualmed COVID-19 chest X-ray data initiative. Available at: https://github.com/agchung/Actualmed-COVID-chestxray-dataset (2020). 11/12.
- 89.Kaggle dataset, COVID-19 radiography database. Available at: https://www.kaggle.com/tawsifurrahman/COVID19-radiography-database (2019) (Last accessed 12 October 2020).
- 90.Kaggle dataset, RSNA pneumonia detection challenge. Available at: https://www.kaggle.com/c/rsna-pneumonia-detection-challenge/data (2019) (Last accessed 12 October 2020).
- 91.Zhang J., Xie Y., Li Y., Shen C., Xia Y. COVID-19 screening on chest X-ray images using deep learning based anomaly detection. ArXiv. 2020 [Google Scholar]
- 92.NIH Chest X-ray. Available at: https://openi.nlm.nih.gov/ (Last accessed 20 October 2020).