Abstract
Renal cell carcinoma (RCC) is one of the most common kidney cancers worldwide. Although great progressions have been made in the past decades, its morbidity and lethality remain increasing. Long noncoding RNAs (lncRNAs) are demonstrated to play significant roles in the tumorigenesis. This study aimed to investigate the detailed roles of lncRNA FTX in RCC cell proliferation and metastasis. Our results showed that the transcript levels of FTX in both clinical RCC tissues and the cultured RCC cells were significantly upregulated and associated with multiple clinical parameters of RCC patients, including familial status, tumor sizes, lymphatic metastasis, and TNM stages. With cell proliferation assays, colony formation assays, and cell cycle assays, we testified that knockdown of FTX in A498 and ACHIN cells with specific shRNAs inhibited cell proliferation rate, colony formation ability, and arrested cell cycle in the G0/G1 phase. FTX depletion also suppressed cell migration and invasion with Transwell assays and wound-healing assays. These data indicated the pro-oncogenic potential of FTX in RCC, which makes it a latent therapeutic target of RCC diagnosis and treatment in the clinic.
Key words: Long noncoding RNAs (lncRNAs), FTX, Proliferation, Metastasis, Renal cell carcinoma (RCC)
INTRODUCTION
Renal cell carcinoma (RCC) is among the most common forms of malignancies originating from the human kidneys1. Owing to the help of abdominal imaging, most RCC patients diagnosed at the early stages can be surgically cured1,2. However, despite this impressive progression made in the last few decades, the recovery rate for patients who are diagnosed with metastatic renal cancers remains very low, which makes RCC still a refractory disease worldwide. The classification of RCC has been recently updated according to morphology characteristics, cell of origin, growth pattern, and immunohistochemical staining3,4. Of note, molecular biomarkers (subtypes or loss-of-function mutations) are widely studied by investigators and clinical workers to find novel clues to diagnose RCC at the very early stage5,6.
Of the total human genome, only 2% of genes can be translated into proteins; however, approximately 80% of genes can be transcribed into RNAs7. Thus, RNAs that do not code for proteins (noncoding RNAs) are divided into two categories according to their sizes, namely, long noncoding RNAs (lncRNAs) and small noncoding RNAs, the latter of which contains microRNAs and small interfering RNAs8,9. Both lncRNAs and small noncoding RNAs are essential in the development of organisms. lncRNAs are a class of RNAs that are composed of more than 200 nucleotides in length and play significant roles in gene transcription10, translation11, posttranscriptional control12, and posttranslational modification13.
Recently, aggregating evidence has demonstrated that the aberrant expressions of various lncRNAs are associated with the tumorigenesis of RCC. Ellinger et al. found that the transcript level of lncRNA lnc-ZNF 180-2 was upregulated in advanced RCC tissues and associated with progression-free survival, cancer-specific survival, and overall survival in RCC patients14. Sakurai et al. showed that the higher expressions of lncRNA DRAIC were accordant with the longer disease-free survival in human RCC patients. Their group also identified another lncRNA, PCAT29, as a tumor suppressor in different cancer types15. However, the detailed mechanisms of how these lncRNAs regulate the progression of cancers remain unclear.
In the present study, we aimed to identify the role of another lncRNA, FTX, in RCC. The transcript levels of FTX from 150 RCC patients who underwent surgeries and cultured RCC cells were examined. Specific short hairpin RNAs (shRNAs) were also included to knock down the expression of FTX to further confirm the detailed effects of FTX on cell proliferation and metastasis in RCC cell lines A498 and ACHIN. Our results unraveled the pro-oncogenic potential of FTX in RCC, which makes it possible to serve for the clinical diagnosis and treatment of RCC patients.
MATERIALS AND METHODS
Human Samples
This study was approved by the ethics committee of Linyi People’s Hospital (Shandong Province, P.R. China). Samples from 150 patients with RCC who were admitted in the Department of Urology and had undergone surgeries between 2012 and 2015 were collected. No radiotherapies or chemotherapies were received before the surgeries for each patient. After the surgeries, RCC tissues together with their adjacent noncancerous tissues were dissected immediately and frozen into liquid nitrogen. All patients showed their full intentions to participate in our study, and written informed consents were also obtained.
Cell Culture and shRNA Transfection
The human RCC cell lines 786-O, A498, ACHIN, and SN12PM6 were purchased from the American Type Culture Collection (ATCC; Rockville, MD, USA), and the Caki-2 RCC cell line was commercially obtained from the Cell Bank of the Chinese Academy of Sciences (Shanghai, P.R. China). Epithelial cell line HKC from the human proximal renal tubules was also included as a counterpart. All of these cell lines were cultured in the recommended medium supplied with 10% fetal bovine serum (FBS; Gibco, Grand Island, NY, USA) at 37°C in a humidified 5% CO2 incubator. Specific shRNA against human FTX was designed and synthesized by Invitrogen (New York, NY, USA). Lentivirus containing specific shRNAs against Z38 was packaged and testified by GenePharma Co. (Shanghai, P.R. China).
RNA Isolation and Real-Time Polymerase Chain Reaction (RT-PCR)
Total RNAs from both clinical tissues and cultured RCC cells were extracted by TRIzol reagent (TaKaRa, Dalian, P.R. China) and quantified with NanoDrop 2000 (Thermo Scientific, USA) by collecting OD260 and OD280. cDNAs were obtained by reverse transcription with TaKaRa products. RT-PCR was then performed with SYBR Premis Ex Taq Kit (TaKaRa) in the ABI 7900 machine according to the manufacturer’s instructions. The primers used were synthesized by Shenggong Co. (Shanghai, P.R. China) and are as follows: FTX, 5′-TAT GCC ACC TAG CCT TTC TAC A-3′ (forward) and 5′-ATC TCT TCA AAA GCG GCA TAA T-3′ (reverse); GAPDH, 5′-CAA GGT CAT CCA TGA CAA CTT TG-3′ (forward) and 5′-GTC CAC CAC CCT GTT GCT GTA G-3′ (reverse). GAPDH was included here as an internal control.
Cell Proliferation
A498 and ACHIN cells (2,000 cells) were cultured with 100 μl of culture medium supplied with 10% FBS in 96-well plates and infected with lentivirus containing scramble shRNA or specific shRNAs against FTX for 72 h. Cell proliferation rate was assessed with cell counting kit-8 (CCK-8) following the manufacturer’s protocols (Promega, USA). Briefly, 10 μl of CCK-8 was added into each experimental well. Afterward, cells were incubated at 37°C for 1 h, and the absorbance at 450 nm was determined by a microplate reader (Thermo Scientific).
Colony Formation Assay
A498 and ACHIN cells were transfected with shRNAs and cultured for an additional 72 h. Afterward, cells were trypsinized to a single-cell suspension in culture medium supplied with 10% FBS as well as 0.3% agar and then seeded into six-well plates at a concentration of 3,000 cells/well. The plates were placed in a 37°C incubator with 5% CO2 for 14 days. Colonies that contained more than 50 cells were counted under a Nikon light microscope.
Cell Cycle Analysis
A498 and ACHIN cells were seeded into six-well plates with a density of 2 × 10⁵ cells/well and treated with shRNAs upon attachment. Cells were cultured for 72 h at 37°C and then washed with PBS three times and fixed with 70% ethanol overnight at 4°C. On the second day, a total of 100 μl of RNase was added to each well, and cells were allowed to incubate for another 30 min at 37°C. Afterward, 400 μl of propidium iodide dye was coincubated with the cells for an additional 30 min at 4°C. Cell cycle analysis was performed on the flow cytometer (BD Biosciences, USA), and the results were analyzed by the ModFit software (USA).
Transwell Assay
Cell migration and invasion were assessed by Transwell chambers (pore size: 8 μm; Corning Inc., Corning, NY, USA). Both A498 and ACHIN cells were infected with lentivirus containing specific shRNA against FTX or scramble shRNA and incubated for 72 h. Then cells were washed with PBS, trypsinized, and collected with low-speed centrifugation (1,000 rpm, 4°C for 5 min). Afterward, cells were resuspended in single-cell status with serum-free media, and a total of 5 × 10⁴ cells were seeded onto the upper chamber, and 600 μl of DMEM supplemented with 10% FBS was poured into the lower chamber. After incubation for 24 h, cells were fixed with ice-cold methanol and stained with crystal violet. The cells on the upper surface of the membrane were wiped off by cotton swabs. Cells that migrated through the membrane were photographed and counted with a light microscope (Nikon) with five random fields. For the invasion assay, the membranes were precoated with Matrigel (BD Biosciences) in a 37°C incubator for 6 h.
Wound-Healing Assay
A498 and ACHIN cells were seeded into six-well plates and infected with lentivirus containing shRNAs. Seventy-two hours posttreatment, cells were washed with prewarmed PBS three times. A straight line was drawn at the middle of each well with a 10-μl pipette tip. After washing with PBS, cells were photographed and placed back in the 37°C incubator for an additional 24 h. Afterward, images of A498 and ACHIN cells were captured under a Nikon microscope at a magnification of 100×.
Statistically Analysis
All data were presented as the means ± standard deviation (SD) unless otherwise stated. Student’s t-test was included to assess the statistical significance between variables. All statistical analyses were analyzed with the SPSS PASW Statistics 18.0 software (Chicago, IL, USA), and values of p < 0.05 were considered as statistically significant.
RESULTS
Long Noncoding RNA FTX Was Overexpressed and Associated With Multiple Factors in Human RCC
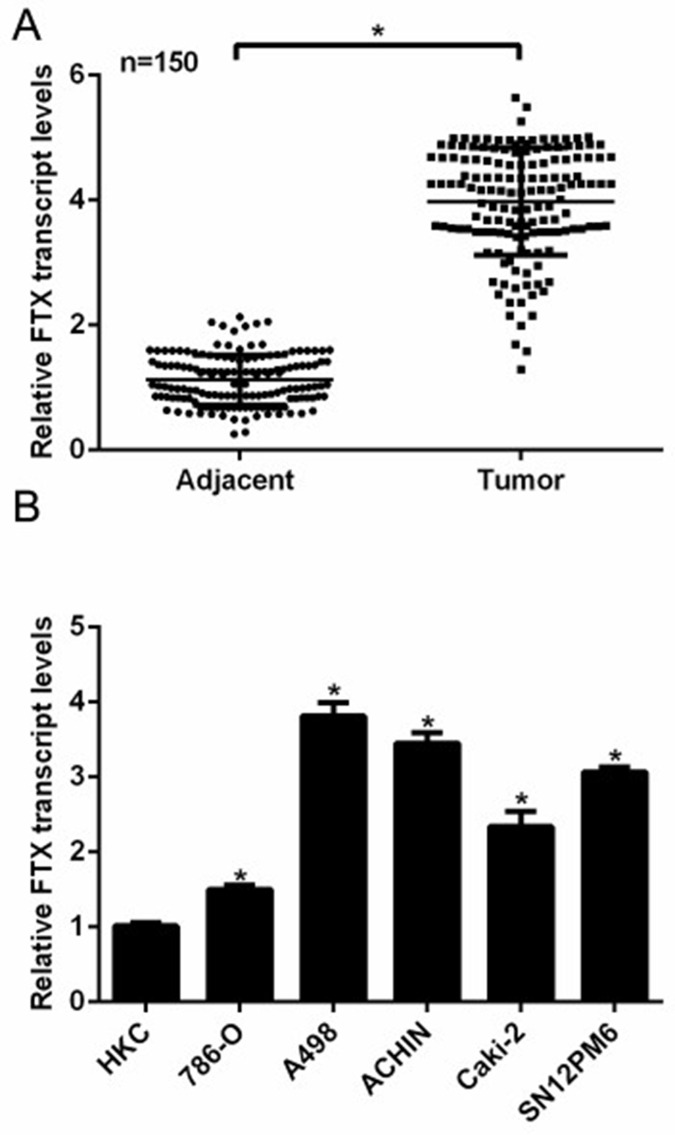
Total RNAs were extracted from 150 clinical patients and subjected to RT-PCR analysis to examine the expression of FTX. As shown in Figure 1A, the average transcript level of FTX in tumor tissues was approximately fourfold higher than that in adjacent noncancerous tissues. The expression of FTX was grouped as low and high according to the median level of FTX in the 150 clinical RCC patients; thus, the 150 patients were classified into two groups: FTXlow group (n = 68) and FTXhigh group (n = 82). Statistical analysis suggested that the high transcript level of FTX was remarkably associated with familial status, tumor size, lymphatic metastasis, and TNM stage, while no obvious correlations were observed between the expression of FTX and age, gender, marital status, and lymph node in RCC patients (Table 1). Next, five cell lines of RCC and a normal epithelial renal cell line were included. RT-PCR analysis revealed that the transcript levels of FTX were notably increased in all of the five RCC cell lines. It was also observed that A498 and ACHIN cells exhibited the highest expressions of FTX compared with the control HKC cells (Fig. 1B); thus, these two cell lines were selected for subsequent functional analysis. These data indicated that the expression of lncRNA FTX was significantly upregulated in human RCC and related with multiple clinical characteristics of RCC patients.
Figure 1.
Long noncoding RNA FTX was overexpressed in human renal cell carcinoma (RCC) tissues and cells. (A) Total RNAs were extracted from 150 clinical RCC tissues and their adjacent noncancerous tissues and subjected to real-time polymerase chain reaction (RT-PCR) analysis. The transcript level of FTX in the tumor tissues was fourfold higher than that in their noncancerous counterparts. *p < 0.05 versus Adjacent. (B) Five RCC cell lines and a control renal cell line HKC were included to assess the expression of FTX in RCC cells by RT-PCR assays. A498 and ACHIN showed the highest transcript levels of FTX, while other RCC cells also presented higher FTX expressions compared with HKC cells. *p < 0.05 versus HKC cells.
Table 1.
The Correlations Between the Transcript Level of FTX and the Clinical Parameters of RCC Patients
| Clinical Parameters | Cases | Transcript Level of FTX | p Value | |
|---|---|---|---|---|
| High (n = 82) | Low (n = 68) | |||
| Ages (years) | 0.092 | |||
| <65 | 99 | 59 | 40 | |
| ≥65 | 51 | 23 | 28 | |
| Gender | 0.669 | |||
| Male | 79 | 42 | 37 | |
| Female | 76 | 40 | 31 | |
| Marital status | 0.362 | |||
| Single | 10 | 4 | 6 | |
| Married | 99 | 54 | 45 | |
| Separated | 41 | 24 | 17 | |
| Familial status | <0.001 | |||
| Sporadic | 109 | 44 | 65 | |
| Familial | 41 | 38 | 3 | |
| Tumor size (cm) | <0.001 | |||
| ≤4 | 26 | 6 | 20 | |
| 4–7 | 44 | 18 | 26 | |
| ≥7 | 80 | 58 | 22 | |
| Lymph node | 0.062 | |||
| N0 | 54 | 35 | 19 | |
| N1 | 96 | 47 | 49 | |
| Lymphatic metastasis | <0.001 | |||
| Absence | 57 | 19 | 38 | |
| Presence | 93 | 63 | 30 | |
| TNM stage | <0.001 | |||
| I–II | 51 | 17 | 34 | |
| III–IV | 99 | 65 | 34 | |
Knockdown of FTX Inhibited Cell Proliferation in RCC Cells
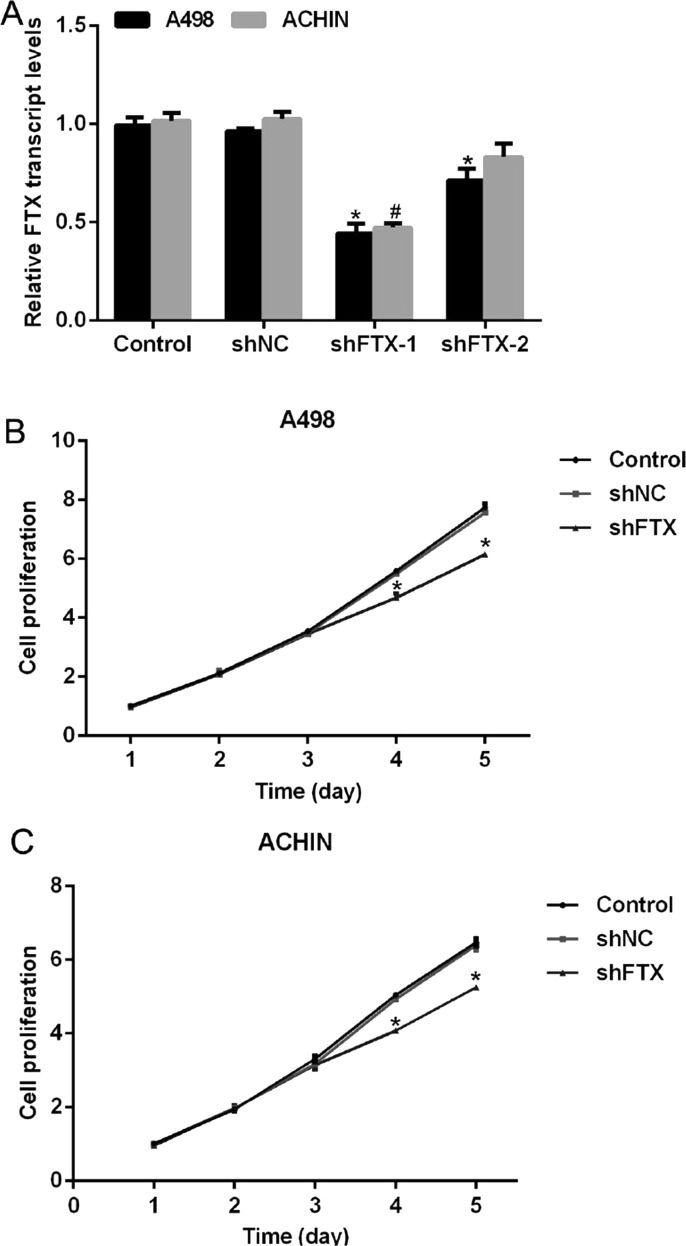
Next, we explored the detailed roles of FTX in RCC tumorigenesis. To this end, two specific shRNAs against FTX were synthesized and packaged into the lentivirus. A498 and ACHIN cells were infected with the lentivirus containing shFTX or scramble shRNA (shNC) and subjected to RT-PCR analysis. It was shown that the transcript levels of FTX were decreased when cells were transfected with shFTX-1 or shFTX-2; however, the inhibitory rates of shFTX-2 were only 26% and 17% in A498 and ACHIN cells, respectively (Fig. 2A). Therefore, shFTX-2 was omitted for the subsequent assays, and shFTX-1 was renamed as shFTX in the later study. Afterward, CCK-8 assays were performed to explore the effects of FTX on cell proliferation. There was no significant disparity among the three groups in the first 3 days; however, on the fourth day, cell proliferation rate in the shFTX-treated group was suppressed by 16% in A498 cells and 18.75% in ACHIN cells. Cell proliferation was further retarded on the fifth day in both cell lines by specific shRNA against FTX (Fig. 2B and C). These results suggested that knockdown of FTX in A498 and ACHIN cells inhibited cell proliferation rate via CCK-8 assays.
Figure 2.
Knockdown of FTX inhibited cell proliferation in RCC cells. (A) Two specific shRNAs were designed and transfected into A498 and ACHIN cells. The transcript level of FTX was significantly decreased by shFTX-1 in both cell lines; however, only little decline was observed by shFTX-2 transfection. *p < 0.05 versus Control in A498 cells. #p < 0.05 versus Control in ACHIN cells. (B) Transfection of shFTX suppressed cell proliferation rate in A498 cells on the fourth and fifth days. (C) Transfection of shFTX suppressed cell proliferation rate in ACHIN cells on the fourth and fifth days. *p < 0.05 versus Control.
Knockdown of FTX Inhibited Colony Formation and Arrested Cell Cycle in the G0/G1 Phase in RCC Cells
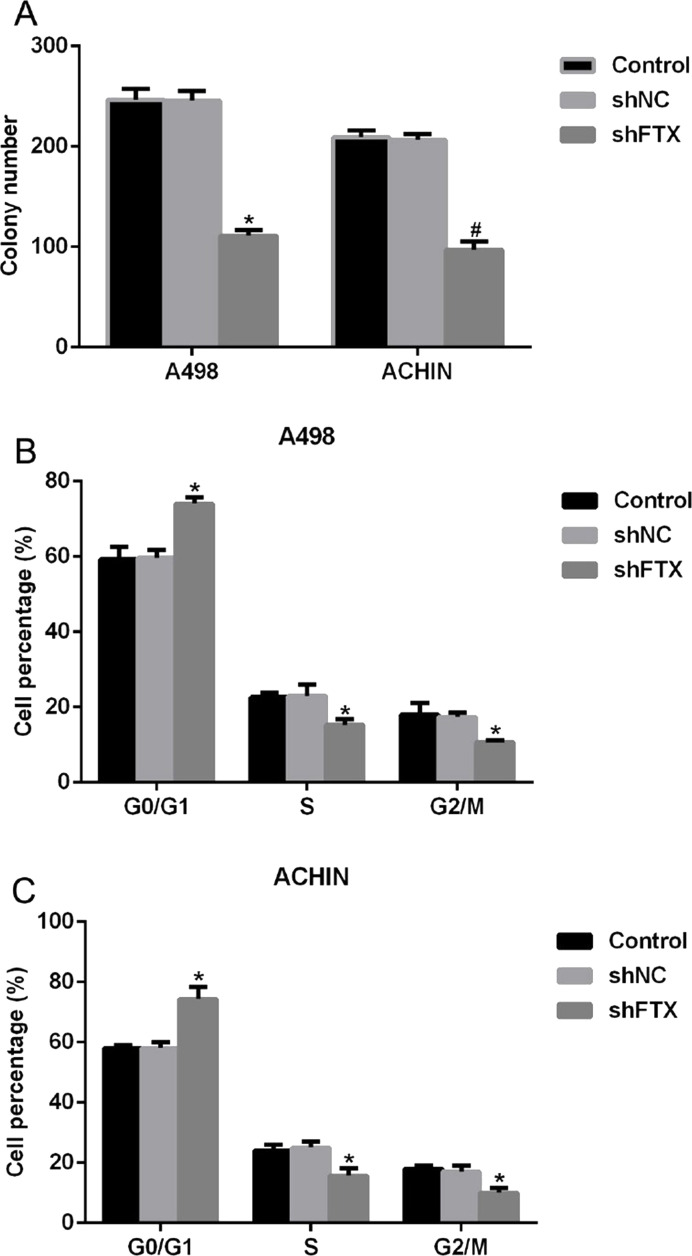
We further explored the role of FTX in RCC cells with colony formation assays and cell cycle assays. As shown in Figure 3A, a total of 248 colonies were formed in untreated A498 cells, while only 105 colonies were observed in shFTX-transfected A498 cells. A similar phenomenon was also shown in ACHIN cells, which suggested that FTX depletion inhibited the cell ability of colony formation for both A498 and ACHIN cells. Next, we found that treatment of shFTX in A498 cells shifted more than 17% cells from the S phase and G2/M phase to the G0/G1 phase (Fig. 3B). Likewise, cell percentage in the G0/G1 phase was enhanced by 17%, while 9% of cells of the S phase and 8% of cells of the G2/M phase were declined when ACHIN cells were infected with lentivirus containing shFTX (Fig. 3C). All of these results revealed that knockdown of FTX in RCC cell lines A498 and ACHIN suppressed the cell ability to form colonies and shifted cell cycles from the S phase and G2/M phase to the G0/G1 phase. Together with the above observation, a conclusion was drawn that FTX depletion inhibited cell proliferation in RCC cells.
Figure 3.
Knockdown of FTX inhibited colony formation and arrested cell cycle in the G0/G1 phase in RCC cells. (A) Colony formation assays showed that knockdown of FTX with specific shRNA inhibited the cell ability to form colonies in both A498 and ACHIN cells. *p < 0.05 versus Control in A498 cells. #p < 0.05 versus Control in ACHIN cells. (B) shFTX treatment in A498 cells shifted cell cycle from the S phase and G2/M phase to the G0/G1 phase. (C) Transfection of shFTX in ACHIN cells arrested cell cycle in the G0/G1 phase. *p < 0.05 versus Control.
Knockdown of FTX Suppressed Cell Migration and Invasion in RCC Cells
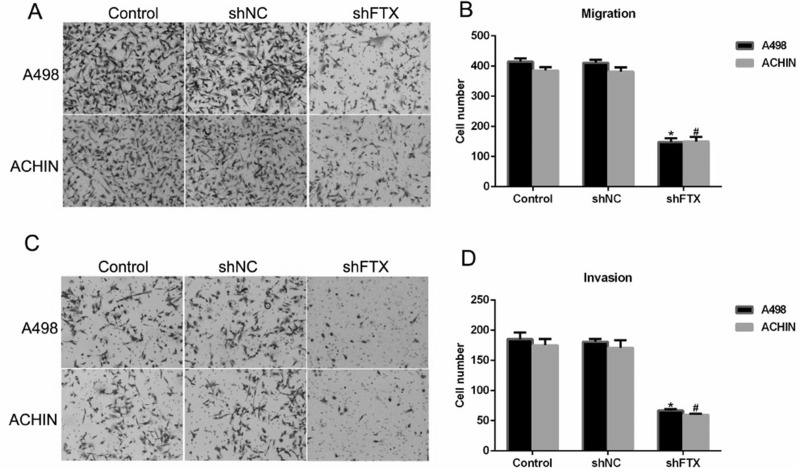
Since the transcript level of FTX was associated with the progressive clinical characteristics in RCC patients (Table 1), we next detected the role of FTX in cell metastasis in vitro. Our results showed that scramble RNA (shNC) caused little effect on FTX expression in both A498 and ACHIH cells. When cells were transfected with shFTX, more than 250 of A498 cells and 220 of ACHIN cells were retarded from migrating through the membrane (Fig. 4A and B). Similarly, approximately 180 of A498 cells and 170 cells of ACHIN invaded through the membrane in control cells, while only 70 of A498 cells and 62 of ACHIN cells invaded onto the lower surface of the membrane (Fig. 4C and D).
Figure 4.
Knockdown of FTX suppressed cell migration and invasion in RCC cells by Transwell assay. (A) Representative images of cells migrated through the membrane and stained on the lower surface of the membrane in A498 and ACHIN cells. (B) Quantification of cell migration assays revealed FTX depletion with shFTX inhibited the cell migration ability in A498 and ACHIN cells. *p < 0.05 versus Control in A498 cells. #p < 0.05 versus Control in ACHIN cells. (C) Representative images of cells that invaded through the membrane in A498 and ACHIN cells. (D) Quantification of cell invasion assays revealed FTX depletion with shFTX inhibited cell invasion ability in A498 and ACHIN cells. *p < 0.05 versus Control in A498 cells. #p < 0.05 versus Control in ACHIN cells.
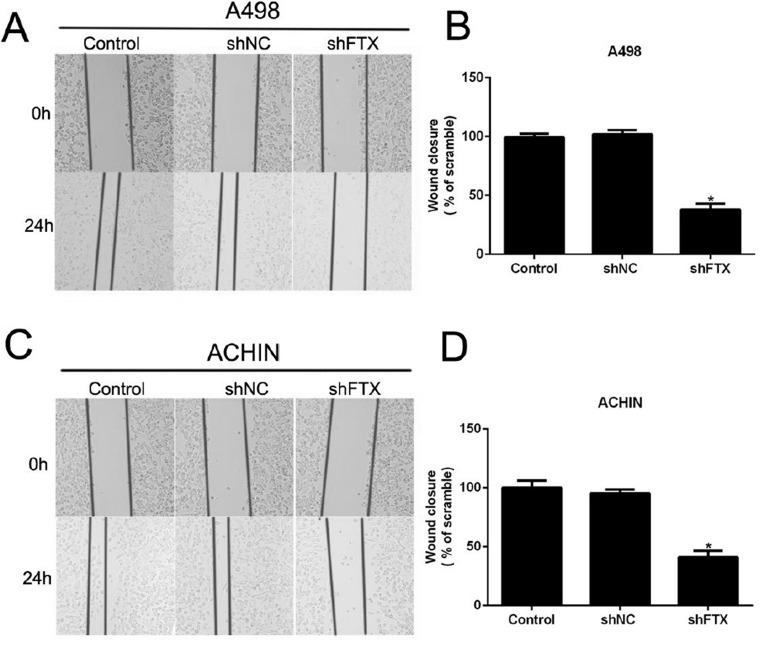
Afterward, wound-healing assay was also performed to further confirm the effects of FTX on cell metastasis in RCC cells. After 24 h posttransfection, wound closure for A498 cells was retarded by approximately 60% by FTX knockdown (Fig. 5A and B). Likewise, ACHIN cells were also suppressed to migrate in the shFTX-treated group (Fig. 5C and D). All of these data revealed that knockdown of FTX with specific shRNA suppressed cell migration and invasive potential in RCC cells.
Figure 5.
Knockdown of FTX suppressed cell migration and invasion in RCC cells by wound-healing assay. (A) Representative images of wound-healing assays in A498 cells. The pictures were captured 24 h posttransfection. (B) Quantification of wound-healing assay for A498 cells showed that more than 60% cells were retarded to migrate upon shFTX transfection. (C) Representative images of wound-healing assays in ACHIN cells. (D) Quantification of wound-healing assay suggested that more than 60% ACHIN cells were suppressed to migrate upon shFTX transfection. *p < 0.05 versus Control.
DISCUSSION
Cancer is a major health problem worldwide and the second leading cause of death, only behind cardiovascular disease. RCC will account for over 63,000 new cases and 14,000 deaths in the US in 201616. It was estimated that 5% (39,650) of newly diagnosed male cancer patients and 3% (23,050) of female new cases would be RCC. Although impressive progress has been made to extend the life span and life quality of RCC patients, the 5-year survival rates are 73% for patients in the very early stage and 8% for those in the late stage17,18. Thus, it is necessary to find novel molecular biomarkers to diagnose RCC in the very early stages.
lncRNA FTX is necessary for imprinted X-chromosome inactivation (XCI) and is located in the cis-acting regulatory domain of the imprinted XCI and expressed from inactive Xp19. Its importance has been shown in various types of cancers, including breast cancer20, colorectal cancer21, and HBV-related hepatocellular carcinoma (HCC)22,23. FTX is transcribed into multiple RNA isoforms and contains a cluster of two miRNAs (miR-374a and miR-545) in intron 12. These miRNAs are well conserved among different mammalians, and their expressions were shown to be positively related with that of FTX in HCC24,25. The FTX–miR-545 axis increases cell proliferation rate and cell cycle progression by activating the PI3K/Akt signaling pathway in human HCC cells23. However, we did not include the detailed mechanisms of how FTX regulated cell proliferation and metastasis in RCC cells. It would be another interesting story, which will be studied later in our group.
Our results showed that knockdown of FTX in A498 and ACHIN cells inhibited cell proliferation by CCK-8 assays and colony formation assays, as well as cell cycle analysis (Figs. 2 and 3). Cell proliferation is always associated with cell apoptosis; thus it is a pity that the role of FTX in RCC cell apoptosis remains to be elucidated. Moreover, the epithelial–mesenchymal transition (EMT) process is critical in cell metastasis. We revealed in our results that knockdown of FTX in RCC cells suppressed cell metastasis via Transwell assays and wound-healing assays; however, whether the EMT process was involved needed further explanations.
In all, our study suggested that the transcript level of lncRNA FTX was upregulated in clinical RCC patients and cultured RCC cells, and associated with familial status, tumor size, lymphatic metastasis, and TNM stages in RCC patients. Knockdown of FTX in A498 and ACHIN cells suppressed cell proliferation rate and cell metastasis. Our results indicated the pro-oncogenic potential of FTX, which might make it a therapeutic target for RCC diagnosis and treatment of RCC patients.
REFERENCES
- 1. Ho TH, Kapur P, Joseph RW, Serie DJ, Eckel-Passow JE, Parasramka M, Cheville JC, Wu KJ, Frenkel E, Rakheja D, Stefanius K, Brugarolas J, Parker AS. Loss of PBRM1 and BAP1 expression is less common in non-clear cell renal cell carcinoma than in clear cell renal cell carcinoma. Urol Oncol. 2015;33:23–9. [DOI] [PMC free article] [PubMed] [Google Scholar]
- 2. Lopez-Beltran A, Carrasco JC, Cheng L, Scarpelli M, Kirkali Z, Montironi R. 2009 update on the classification of renal epithelial tumors in adults. Int J Urol. 2009;16:432–43. [DOI] [PubMed] [Google Scholar]
- 3. Dalgliesh GL, Furge K, Greenman C, Chen L, Bignell G, Butler A, Davies H, Edkins S, Hardy C, Latimer C, Teague J, Andrews J, Barthorpe S, Beare D, Buck G, Campbell PJ, Forbes S, Jia M, Jones D, Knott H, Kok CY, Lau KW, Leroy C, Lin ML, McBride DJ, Maddison M, Maguire S, McLay K, Menzies A, Mironenko T, Mulderrig L, Mudie L, O’Meara S, Pleasance E, Rajasingham A, Shepherd R, Smith R, Stebbings L, Stephens P, Tang G, Tarpey PS, Turrell K, Dykema KJ, Khoo SK, Petillo D, Wondergem B, Anema J, Kahnoski RJ, Teh BT, Stratton MR, Futreal PA. Systematic sequencing of renal carcinoma reveals inactivation of histone modifying genes. Nature 2010;463:360–3. [DOI] [PMC free article] [PubMed] [Google Scholar]
- 4. Minardi D, Lucarini G, Milanese G, Di Primio R, Montironi R, Muzzonigro G. Loss of nuclear BAP1 protein expression is a marker of poor prognosis in patients with clear cell renal cell carcinoma. Urol Oncol. 2016;34:338.e11–8. [DOI] [PubMed] [Google Scholar]
- 5. Felsch M, Zaim S, Dicken V, Lehmacher W, Scheuring UJ. Comparison of central and local serial CT assessments of metastatic renal cell carcinoma patients in a clinical phase IIB study. Acta Radiol. 2016. [Epub ahead of print] [DOI] [PubMed] [Google Scholar]
- 6. Fan W, Huang J, Xiao H, Liang Z. MicroRNA-22 is downregulated in clear cell renal cell carcinoma, and inhibits cell growth, migration and invasion by targeting PTEN. Mol Med Rep. 2016;13:4800–6. [DOI] [PubMed] [Google Scholar]
- 7. Schmitt AM, Chang HY. Long noncoding RNAs in cancer pathways. Cancer Cell 2016;29:452–63. [DOI] [PMC free article] [PubMed] [Google Scholar]
- 8. Qureshi IA, Mehler MF. Emerging roles of non-coding RNAs in brain evolution, development, plasticity and disease. Nat Rev Neurosci. 2012;13:528–41. [DOI] [PMC free article] [PubMed] [Google Scholar]
- 9. Han LC, Chen Y. Small and long non-coding RNAs: Novel targets in perspective cancer therapy. Curr Genomics 2015;16:319–26. [DOI] [PMC free article] [PubMed] [Google Scholar]
- 10. Lopez-Pajares V. Long non-coding RNA regulation of gene expression during differentiation. Pflugers Arch. 2016;468:971–81. [DOI] [PubMed] [Google Scholar]
- 11. Schmitz SU, Grote P, Herrmann BG. Mechanisms of long noncoding RNA function in development and disease. Cell Mol Life Sci. 2016;73:2491–509. [DOI] [PMC free article] [PubMed] [Google Scholar]
- 12. Yu CY, Kuo HC. The trans-spliced long noncoding RNA tsRMST impedes human ESC differentiation through WNT5A-mediated inhibition of the epithelial-to-mesenchymal transition. Stem Cells 2016;34:2052–62. [DOI] [PubMed] [Google Scholar]
- 13. Kotake Y, Kitagawa K, Ohhata T, Sakai S, Uchida C, Niida H, Naemura M, Kitagawa M. Long non-coding RNA, PANDA, contributes to the stabilization of p53 tumor suppressor protein. Anticancer Res. 2016;36:1605–11. [PubMed] [Google Scholar]
- 14. Ellinger J, Alam J, Rothenburg J, Deng M, Schmidt D, Syring I, Miersch H, Perner S, Muller SC. The long non-coding RNA lnc-ZNF180-2 is a prognostic biomarker in patients with clear cell renal cell carcinoma. Am J Cancer Res. 2015;5:2799–807. [PMC free article] [PubMed] [Google Scholar]
- 15. Sakurai K, Reon BJ, Anaya J, Dutta A. The lncRNA DRAIC/PCAT29 locus constitutes a tumor-suppressive nexus. Mol Cancer Res. 2015;13:828–38. [DOI] [PMC free article] [PubMed] [Google Scholar]
- 16. Siegel RL, Miller KD, Jemal A. Cancer statistics, 2016. CA Cancer J Clin. 2016;66:7–30. [DOI] [PubMed] [Google Scholar]
- 17. Flanigan RC, Mickisch G, Sylvester R, Tangen C, Van Poppel H, Crawford ED. Cytoreductive nephrectomy in patients with metastatic renal cancer: A combined analysis. J Urol. 2004;171:1071–6. [DOI] [PubMed] [Google Scholar]
- 18. Heng DY, Wells JC, Rini BI, Beuselinck B, Lee JL, Knox JJ, Bjarnason GA, Pal SK, Kollmannsberger CK, Yuasa T, Srinivas S, Donskov F, Bamias A, Wood LA, Ernst DS, Agarwal N, Vaishampayan UN, Rha SY, Kim JJ, Choueiri TK. Cytoreductive nephrectomy in patients with synchronous metastases from renal cell carcinoma: Results from the International Metastatic Renal Cell Carcinoma Database Consortium. Eur Urol. 2014;66:704–10. [DOI] [PubMed] [Google Scholar]
- 19. Soma M, Fujihara Y, Okabe M, Ishino F, Kobayashi S. Ftx is dispensable for imprinted X-chromosome inactivation in preimplantation mouse embryos. Sci Rep. 2014;4:5181. [DOI] [PMC free article] [PubMed] [Google Scholar]
- 20. Reiche K, Kasack K, Schreiber S, Luders T, Due EU, Naume B, Riis M, Kristensen VN, Horn F, Borresen-Dale AL, Hackermuller J, Baumbusch LO. Long non-coding RNAs differentially expressed between normal versus primary breast tumor tissues disclose converse changes to breast cancer-related protein-coding genes. PLoS One 2014;9:e106076. [DOI] [PMC free article] [PubMed] [Google Scholar]
- 21. Guo XB, Hua Z, Li C, Peng LP, Wang JS, Wang B, Zhi QM. Biological significance of long non-coding RNA FTX expression in human colorectal cancer. Int J Clin Exp Med. 2015;8:15591–600. [PMC free article] [PubMed] [Google Scholar]
- 22. Zhao Q, Li T, Qi J, Liu J, Qin C. The miR-545/374a cluster encoded in the Ftx lncRNA is overexpressed in HBV-related hepatocellular carcinoma and promotes tumorigenesis and tumor progression. PLoS One 2014;9:e109782. [DOI] [PMC free article] [PubMed] [Google Scholar]
- 23. Liu Z, Dou C, Yao B, Xu M, Ding L, Wang Y, Jia Y, Li Q, Zhang H, Tu K, Song T, Liu Q. Ftx non coding RNA-derived miR-545 promotes cell proliferation by targeting RIG-I in hepatocellular carcinoma. Oncotarget 2016;7:25350–65. [DOI] [PMC free article] [PubMed] [Google Scholar]
- 24. Chureau C, Chantalat S, Romito A, Galvani A, Duret L, Avner P, Rougeulle C. Ftx is a non-coding RNA which affects Xist expression and chromatin structure within the X-inactivation center region. Hum Mol Genet. 2011;20:705–18. [DOI] [PubMed] [Google Scholar]
- 25. Romito A, Rougeulle C. Origin and evolution of the long non-coding genes in the X-inactivation center. Biochimie 2011;93:1935–42. [DOI] [PubMed] [Google Scholar]


