


Abstract
Sex-linked dwarf (SLD) chicken, which is caused by a recessive mutation of the growth hormone receptor (GHR), has been widely used in the Chinese broiler industry. However, it has been found that the SLD chicken has more abdominal fat deposition than normal chicken. Excessive fat deposition not only reduced the carcass quality of the broilers but also reduced the immunity of broilers to diseases. To find out the key genes and the precise regulatory pathways that were involved in the GHR mutation-induced excessive fat deposition, we used high-fat diet (HFD) and normal diet to feed the SLD chicken and normal chicken and analyzed the differentially expressed genes (DEGs) among the four groups. Results showed that the SLD chicken had more abdominal fat deposition and larger adipocytes size than normal chicken and HFD can promote abdominal fat deposition and induce adipocyte hypertrophy. RNA sequencing results of the livers and abdominal fats from the above chickens revealed that many DEGs between the SLD and normal chickens were enriched in fat metabolic pathways, such as peroxisome proliferator-activated receptor (PPAR) signaling, extracellular matrix (ECM)-receptor pathway, and fatty acid metabolism. Importantly, by constructing and analyzing the GHR-downstream regulatory network, we found that suppressor of cytokine signaling 2 (SOCS2) and cytokine-inducible SH2-containing protein (CISH) may involve in the GHR mutation-induced abdominal fat deposition in chicken. The ectopic expression of SOCS2 and CISH in liver-related cell line leghorn strain M chicken hepatoma (LMH) cell and immortalized chicken preadipocytes (ICP) revealed that these two genes can regulate fatty acid metabolism, adipocyte differentiation, and lipid droplet accumulation. Notably, overexpression of SOCS2 and CISH can rescue the hyperactive lipid metabolism and excessive lipid droplet accumulation of primary liver cell and preadipocytes that were isolated from the SLD chicken. This study found some genes and pathways involved in abdominal fat deposition of the SLD chicken and reveals that SOCS2 and CISH are two key genes involved in the GHR mutation-induced excessive fat deposition of the SLD chicken.
Keywords: sex-linked dwarf chicken, abdominal fat deposition, SOCS2, CISH, differentially expressed gene
Introduction
Broiler consumption accounts for a large part of global meat consumption. Sex-linked dwarf (SLD) chicken is caused by deletion or point mutations of the growth hormone receptor (GHR) gene located in the Z chromosome (Tahara et al., 2009). Compared with normal chicken, the SLD chicken has a variety of phenotypic and physiological alteration and has been widely used in broiler breeding due to lower basal metabolism, heat stress resistance, and higher feed conversion rate. Besides, homozygous SLD chicken has smaller muscle fiber diameter and higher intramuscular fat deposition, which plays an essential role in meat quality (Knížetová, 1993; Melesse et al., 2013; Ye et al., 2014; Ferdaus et al., 2016; Luo et al., 2016; Cui et al., 2019). Furthermore, the SLD chicken can be used as an important model organism to study human inherited diseases caused by GHR gene mutations. The symptoms of those diseases are similar to the SLD chicken, which has short shape, obesity, high level of serum growth hormone (GH), and low level of serum IGF-1 (Berg et al., 1993).
Excessive abdominal fat deposition is becoming more common in the broiler industry with the increase of growth rate and the popularization of large-scale production. Excessive fat has often been discarded because of processing difficulty and unhealthy diet. Additionally, excessive fat can also reduce feed conversion rate, carcass yield, and reproductive performance (Lagarrigue et al., 2006; Zhang et al., 2017, 2018). Therefore, reducing excessive fat deposition has become an important goal of broiler breeding. It is worth noting that mutation or abnormal expression of GHR often results in lipid metabolism disorder. The ablation of GHR mRNA, deletion, and mutations in the GHR exons are related to human obesity, such as the increase of abdominal fat and subcutaneous fat content (Erman et al., 2011; Glad et al., 2015). Moreover, patients with Laron syndrome caused by the GHR mutations have significant trunk obesity and body composition change (Ginsberg et al., 2009). Similar to Laron syndrome phenotype, global GHR knockout mice (GHR–/–) showed GH tolerant, obese, highly sensitive to insulin, enhanced glucose assimilation, and extended longevity (Masternak et al., 2012). The lipolytic/antilipogenic effect of GH is disrupted in GHR–/– mice, which is effective in suppressing fat consumption. The whole adipose tissue mass of GHR–/– mice was significantly increased compared with littermate negative control (Berryman et al., 2009). Different from the global GHR-KO mice, fat tissue specific GHR-knockout (FaGHR-KO) mice were larger than the control group. The white fat, brown fat, and adipocyte sizes were all significantly increased in the FaGHR-KO mice (List et al., 2019). Adipocyte specific-knockout mice showed increased sensitivity to dietary obesity and are able to protect the liver from high-fat diet (HFD)-induced liver injury by trapping free fatty acids (Ran et al., 2019). In addition, skeletal muscle specific GHR-KO mice increased insulin sensitivity in response to HFD intake, suggesting a link between the GHR signaling pathway in the skeletal muscle, liver, and adipose tissue (Vijayakumar et al., 2011).
The reaction of several downstream signaling pathways of the GH–GHR axis has been studied in case of GHR mutations or knockout. A trimolecular complex was formed when GH was bound to GHR, leading to GHR conformation transitions and activated downstream GHR-mediated signaling pathways. GHR mutations result in low effective or even abolished interaction of GH and GHR and further suppress secretion of IGF-1 by the GH–GHR–IGF-1 axis (Filopanti et al., 2011; Lin et al., 2018). GH binding to GHR would activate JAK2 and the members of the signal transducer and activator of transcription (STAT), STAT1, STAT3, and STAT5 (Dehkhoda et al., 2018). The mitogen-activated protein kinase (MAPK) pathway and the phosphoinositide-3 kinase (PI3K) and protein kinase B (AKT) pathway are also the downstream pathways of GH–GHR signaling (Rosenfeld et al., 2007; Lin et al., 2018). Targeted disruption of GHR eliminated STAT5a and STATb signal transduction (Rosenfeld et al., 2007). STAT5 cannot be activated in GHR-KO mice, causing the enhancement of lipogenesis and obesity (Chhabra et al., 2019). In the liver of fasted GHR-KO pigs, phosphorylation of STAT5 was significantly decreased, whereas the phosphorylation of glycogen synthase 3 beta, PI3K, and AKT was increased (Hinrichs et al., 2018). It was shown that AKT is an essential regulator of peroxisome proliferator-activated receptor (PPAR) γ (Peng, 2003). AKT can regulate adipogenesis by interacting with the mTOR pathway, and it can also inhibit FOXO members to increase PPARγ expression and promote adipocyte differentiation (Cai et al., 2016; Pan et al., 2017). mTOR is active in two compounds, mTORC1 and mTORC2. In several tissues of GHR-KO mice, mTORC1 was inhibited, whereas mTORC2 was elevated to regulate AKT and enhance lipid synthesis (Fang et al., 2018). Though it has been known that the chicken with GHR mutation or deletion has more abdominal fat deposition than normal chicken, the internal mechanism of GHR mutation-induced excessive fat deposition remains unknown. Therefore, the main purpose of this study was to find out the key genes and the precise regulatory pathways that were involved in the GHR mutation-induced excessive fat deposition in the SLD chickens.
Materials and Methods
Animal Experimental Procedures
A total of 12 female dwarf type Xinghua chickens (the SLD chicken, with GHR gene exon 5 a T/C mutation) were randomly distributed to the HFD group, which was fed a diet consisting of 40% carbohydrate, 25% fat, and 20% protein, and the normal diet group, which was fed a diet consisting of 41% carbohydrate, 5% fat, and 22% protein (n = 6 in each group). Those 8-week-old SLD chickens with similar body weight were fed for 2 weeks and weighed before slaughter. In addition, another 12 purebred female Xinghua chickens (normal chicken) were treated in the same way as the SLD chicken. Determination on abdominal fat weight and abdominal fat rate was carried out as described previously (Chen et al., 2019). The tissues of liver and abdominal fat were immediately frozen in liquid nitrogen and stored at −80°C until use. All animal work was approved and performed in accordance with the regulations and guidelines of the Institutional Animal Care and Use Committee of the South China Agricultural University (approval number: SCAU#0017; 21 November 2017).
H&E Staining and Adipocyte Size Calculation
Abdominal fat was fixed with 4% paraformaldehyde and embedded in paraffin, and 12-μm-thick serial sections were made. Then, sections were performed H&E staining according to standard protocols. Microscopic observation and photograph were taken with Leica DM2500 microscope (Leica, Wetzlar, Germany). At least five visual fields were randomly selected for each section, and at least 20 cells were selected for each visual field. The area and diameter of adipocyte were calculated using Nikon Eclipse Ti microscope and NIS-Elements BR software (Nikon, Tokyo, Japan).
Plasmid Construction and Small Interfering RNA
Suppressor of cytokine signaling 2 (SOCS2) and cytokine-inducible SH2-containing protein (CISH) coding sequences were amplified from chicken liver cDNA by PCR using specific primers (Supplementary File 1). The full-length coding regions of chicken SOCS2 and CISH were constructed into pcDNA3.1 vector (Invitrogen). Specific small interfering RNAs of SOCS2 and CISH were obtained from RiboBio, and non-specific siRNA was used as the control.
Cell Culture and Transfection
Liver-related cell line leghorn strain M chicken hepatoma (LMH) cell and immortalized chicken preadipocytes (ICP) were cultured in high-glucose Dulbecco’s modified Eagle’s medium (Gibco, Carlsbad, CA, United States) with 10% fetal bovine serum and 0.2% penicillin/streptomycin at the condition of 37°C with 5% CO2. ICP cells were induced to differentiation by adding 160 μM sodium oleate (Sigma Life Science, St. Louis, MO, United States). Plasmid DNA and siRNA transfection were carried out using the transfection reagent Lipofectamine 3000 (Invitrogen Corporation, Carlsbad, CA, United States) following the manufacturer’s protocol.
Quantitative Real-Time PCR
RNA from tissues or cells was isolated using RNAiso reagent (Takara, Otsu, Japan). Reverse-transcription reactions were using PrimeScript RT reagent Kit with gDNA Eraser (Takara). The relative mRNA expression levels of genes were determined by using real-time quantitative PCR (qPCR) with SYBR Green. The specific primers are shown in Supplementary File 1. The 2–ΔΔCt method was used to calculate gene expression with β-actin (for liver tissues and LMH cells) or GAPDH (for abdominal fats and ICP cells).
Gene Expression Profiling
Three livers and abdominal fats from each of the four treatment groups were selected for RNA sequencing. RNA quantity and quality were evaluated on an Agilent 2100 Bioanalyzer (Agilent Technologies, Waldbronn, Germany), and RNA integrity was further examined using agarose gel electrophoresis. High-throughput RNA-seq was performed on the BGISEQ-500 platform (BGI, Wuhan, China). Significance was accepted at adjusted | log2FC| ≥ 0.5, P ≤ 0.001. All the sequence data have been deposited in NCBI’s Gene Expression Omnibus (GEO1) and are accessible through GEO series accession numbers GSE129840 and GSE128340.
Oil Red O Staining and Quantification
After 48 h of transfection, Oil Red O staining was carried out in ICP cells. Briefly, cells were washed with PBS for 5 min and then fixed with 4% paraformaldehyde for 10 min. The cells were stained with Oil Red O working solution (Solarbio, Beijing, China). The cells were observed and photographed using a microscope (Leica). The Oil Red O dyes were isolated using isopropanol solution containing 4% Non-idet P-40. Concentration was quantified by Model 680 Microplate Reader (Bio-rad, CA, United States) at 510 nm.
Bioinformatics Analysis
The Venn diagram was calculated and drawn by a web-based software2. Gene ontology (GO) analysis of the enriched genes was performed using the web-based Metascape (a gene annotation and analysis resource3 (Zhou et al., 2019). Kyoto Encyclopedia of Genes and Genomes (KEGG) pathway analysis of differentially expressed genes (DEGs) was carried out for functional analyses4 (Kanehisa, 2000; Kanehisa et al., 2017).
Statistical Analysis
All data are reported as mean ± SEM. The difference between two groups was evaluated using independent sample t-test. The differences among multiple groups were evaluated using Duncan’s multiple range test. P < 0.05 was considered to be statistically significant. All experiments were carried out at least three times. All statistical analyses were performed using SPSS 18.0 for Windows (SPSS, Inc., Chicago, IL, United States).
Results
The SLD Chickens Have More Abdominal Fat Deposition and Larger Adipocytes Size Than Normal Chickens
To investigate the difference of abdominal fat deposition between the SLD and normal chickens and test the effect of HFD on these two kinds of chicken breeds, we fed the SLD chickens and normal chickens with HFD and normal diet. After 2 weeks of feeding, HFD fed SLD chicken (HD), HFD fed normal chicken (HN), normal diet fed SLD chicken (ND), and normal diet fed normal chicken (NN) were weighed and conducted carcass determination. Results showed that the body weight of the SLD chickens was significantly lower than that of normal chickens under the same diet, whereas the body weight of either chicken breeds was not significantly affected by HFD (Figure 1A). However, HFD can significantly increase the abdominal fat weight and abdominal fat rate of chickens, and the abdominal fat weight and abdominal fat rate of the SLD chicken were significantly higher than those of normal chicken under the same diet (Figures 1B,C). Next, we analyzed the adipocytes size between chickens. The HFD can significantly increase the adipocyte size of the SLD chicken and normal chicken (Figures 1D–F). Compared with normal chicken, larger adipocytes area was observed in the SLD chicken in both HFD and normal diet (Figures 1G,H). These results demonstrated that the SLD chickens have more abdominal fat deposition and larger adipocytes size than normal chickens, and that HFD can increase abdominal fat deposition and enlarge adipocytes size in chicken.
FIGURE 1.
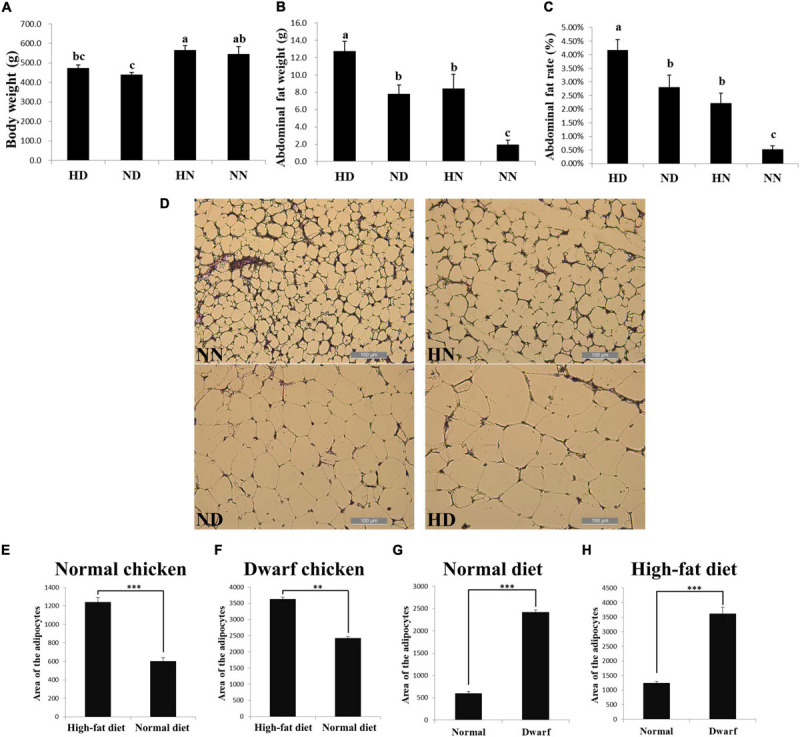
The sex-linked dwarf (SLD) chickens have more abdominal fat deposition and larger adipocytes size than normal chickens. (A) Body weight of the SLD chicken fed with high-fat diet (HD) and normal diet (ND) and normal chicken fed with high-fat diet (HN) and normal diet (NN). (B) Abdominal fat weight of the HD, ND, HN, and NN chickens. (C) Abdominal fat rate of the HD, ND, HN, and NN chickens. (D) Micrograph of abdominal fat cross-section from the NN, HN, ND, and HD chickens. Bar: 200 μm. (E) Adipocytes area of normal chicken fed with high-fat diet and normal diet. (F) Adipocytes area of the SLD chicken fed with high-fat diet and normal diet. (G) Adipocytes area from normal chicken and the SLD chicken fed with normal diet. (H) Adipocytes area from normal chicken and the SLD chicken fed with high-fat diet. The data are mean ± SEM with at least three samples (n ≥ 3/treatment group). The different lowercase letters above columns indicate significant differences among HD, HN, ND, and NN chickens (P < 0.05) by Duncan’s multiple range test. Independent sample t-test was used to analyze the statistical differences between two groups. ∗∗P < 0.01; ∗∗∗P < 0.001.
DEGs Analyses in the Liver Between the SLD Chicken and Normal Chicken
Considering that the liver is the main organ of lipid metabolism and plays an essential role in the digestion, absorption, synthesis, decomposition, and transportation of lipids, we collected the livers of HD, HN, ND, and NN chickens for RNA sequencing to find DEGs and signal pathways involved in GHR mutation-induced difference of lipid metabolism. A total of 1,040 genes were upregulated, and 610 genes were downregulated in ND chicken compared with NN chicken (Figure 2A and Supplementary File 2), whereas a total of 1,255 genes were upregulated, and 1,218 genes were downregulated in HD chicken compared with HN chicken (Figure 2B and Supplementary File 3). GO Enrichment Analysis showed that the DEGs between the SLD chicken and normal chicken were mainly related to the metabolic process and developmental process (Figures 2C,D). KEGG pathway analysis showed that the enriched pathways of DEGs between ND and NN chickens included many lipid metabolism and adipose deposition pathways, such as metabolic pathways, linoleic acid metabolism, fatty acid degradation, PPAR signaling pathway, steroid hormone biosynthesis, fatty acid biosynthesis, fatty acid metabolism, and steroid biosynthesis (Figure 2E). On the other hand, the DEGs between HD and HN chickens were also enriched in the pathways involved in lipid metabolism and adipocyte development, such as PPAR signaling pathway, fatty acid degradation, steroid hormone biosynthesis, calcium signaling pathway, and extracellular matrix (ECM)-receptor interaction (Figure 2F). Furthermore, we identified 737 genes differentially expressed between the two kinds of chicken breeds not only under the HFD but also under the normal diet (Figure 2G and Supplementary File 4). The functions of these 737 DEGs were largely related to lipid metabolism, such as lipid catabolic process and lipid modification (Figure 2H). A total of 911 genes were identified specific differentially expressed between the SLD chicken and normal chicken under normal diet, and the functions of these DEGs were mainly related to cell cycle and lipid biosynthetic process (Figure 2I). A total of 1,734 DEGs were specific differentially expressed between the SLD chicken and normal chicken under HFD, and their functions were mainly enriched in metabolic process and lipid transport (Figure 2J). Therefore, these results not only found the DEGs of the liver between the SLD chicken and normal chicken but also obtained the potential signaling pathways and cellular processes involved in the GHR mutation-induced liver lipid metabolism difference between the SLD chicken and normal chicken.
FIGURE 2.
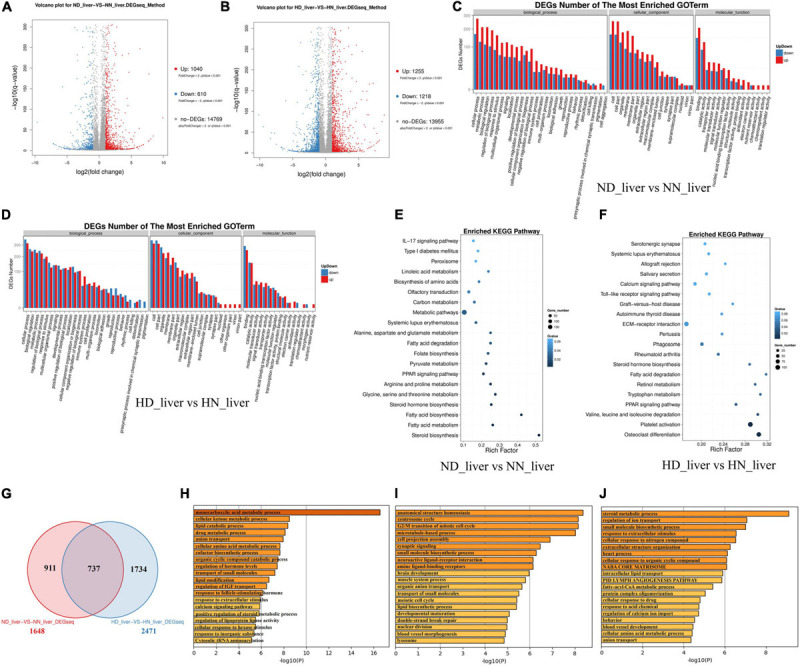
Differentially expressed genes (DEGs) analysis in the liver between the sex-linked dwarf (SLD) chicken and normal chicken. (A) Scatter plot of DEGs between normal diet fed SLD chicken (ND) and normal diet fed normal chicken (NN) in the liver. (B) Scatter plot of DEGs between high-fat diet fed SLD chicken (HD) and high-fat diet fed normal chicken (HN) in the liver. (C) Gene Ontology enrichment of DEGs between ND and NN chickens in the liver. (D) Gene Ontology enrichment of DEGs between HD and HN chickens in the liver. (E) Enriched Kyoto Encyclopedia of Genes and Genomes pathway of DEGs between ND and NN chickens in the liver. (F) Enriched Kyoto Encyclopedia of Genes and Genomes pathway of DEGs between HD and HN chickens in the liver. (G) Venn diagram analysis of DEGs in the liver between the SLD chicken and normal chicken under different diet conditions. (H) Metascape functional enrichment analysis of common DEGs between ND-vs-NN and HD-vs-HN chickens in the liver. (I) Metascape functional enrichment analysis of DEGs specific differentially expressed in ND_liver-VS-NN_liver (911 genes). (J) Metascape functional enrichment analysis of DEGs specific differentially expressed in HD_liver-VS-HN_liver (1,734 genes).
DEGs Analyses in the Abdominal Fat Between the SLD Chicken and Normal Chicken
In order to find DEGs involved in abdominal fat deposition and adipogenesis, we collected abdominal fat from HD, HN, ND, and NN chickens for RNA sequencing. A total of 536 genes were upregulated, and 1,044 genes were downregulated in fat between ND chicken and NN chicken (Figure 3A and Supplementary File 5). Under an HFD, a total of 622 genes were upregulated expression, and 643 genes were downregulated expression (Figure 3B and Supplementary File 6). GO analysis of DEGs between the SLD chicken and normal chicken under a normal diet found that these DEGs were related to metabolism process, developmental process, and growth (Figure 3C). DEGs under an HFD also exhibited similar biological process enrichment (Figure 3D). KEGG analysis of DEGs between ND and NN chickens showed that the mainly enriched pathways included metabolic pathway, cell adhesion molecules (CAMs), and fat digestion and absorption (Figure 3E), whereas calcium signaling pathway, ECM-receptor interaction, type I diabetes mellitus, and CAMs were included in the enriched KEGG pathways of DEGs between HD and HN chickens (Figure 3F). Furthermore, we identified 541 genes differentially expressed between the two kinds of chicken breeds not only under the HFD but also under the normal diet (Figure 3G and Supplementary File 7). The functions of these 541 DEGs were largely related to hormone metabolism and growth, such as sterol metabolic process, regulation of IGF transport, steroid biosynthesis, triglyceride metabolic process, and regulation of growth (Figure 3H). A total of 1,037 genes were identified specific differentially expressed between the two kinds of chicken breeds under the normal diet, and the functions of these DEGs were mainly involved in the cell proliferation and growth processes (Figure 3I). A total of 763 DEGs were specific differentially expressed between the two kinds of chicken breeds under HFD, and the functions of these DEGs were involved in signal transduction, development, and lipid transport (Figure 3J). Together, these results not only found the DEGs of the abdominal fat between the SLD chicken and normal chicken but also obtained the potential signaling pathways and cellular processes involved in the GHR mutation-induced fat deposition and adipogenesis.
FIGURE 3.

Differentially expressed genes analyses in the abdominal fat between the sex-linked dwarf (SLD) chicken and normal chicken. (A) Scatter plot of differentially expressed genes (DEGs) between normal diet fed SLD chicken (ND) and normal diet fed normal chicken (NN) in the abdominal fat. (B) Scatter plot of DEGs between high-fat diet fed SLD chicken (HD) and high-fat diet fed normal chicken (HN) in the abdominal fat. (C) Gene Ontology enrichment of DEGs between ND and NN chickens in the abdominal fat. (D) Gene Ontology enrichment of DEGs between HD and HN chickens in the abdominal fat. (E) Enriched Kyoto Encyclopedia of Genes and Genomes pathway of DEGs between ND and NN chickens in the abdominal fat. (F) Enriched Kyoto Encyclopedia of Genes and Genomes pathway of DEGs between HD and HN chickens in the abdominal fat. (G) Venn diagram analysis of DEGs in the abdominal fat between the SLD chicken and normal chicken under different diet conditions. (H) Metascape functional enrichment analysis of common DEGs between ND-vs-NN and HD-vs-HN chickens in the abdominal fat. (I) Metascape functional enrichment analysis of DEGs specific differentially expressed in ND_fat-VS-NN_fat (1,037 genes). (J) Metascape functional enrichment analysis of DEGs specific differentially expressed in HD_fat-VS-HN_fat (763 genes).
Integrative Analyses Reveal DEGs Involved in HFD-Induced Fat Deposition
To further analyze the different effects of HFD on the SLD chicken and normal chicken, we screened out the common and specific DEGs between the SLD chicken and normal chicken. In the liver, we found a total of 191 common DEGs (Figure 4A and Supplementary File 8), which mean that HFD induces the differential expression of these genes not only in the SLD chickens but also in normal chickens. The functions of these common DEGs were involved in transport of small molecules, hemostasis, and cell cycle (Figure 4B). We also found that 606 DEGs were specific differentially expressed between HD and ND chickens (Figure 4A), and that the functions of these DEGs were related to metabolic processes and hepatocyte differentiation (Figure 4C). Besides, a total of 880 DEGs were specific differentially expressed between HN and NN chickens, and these DEGs were mainly enriched in cell cycle process (Figure 4D).
FIGURE 4.

Integrative analyses reveal differentially expressed genes involved in high-fat diet (HFD)-induced fat deposition. (A) Specific and common differentially expressed genes (DEGs) between the sex-linked dwarf (SLD) chicken and normal chicken under the HFD and the normal diet (HD-vs-ND compared with HN-vs-NN) in the liver. (B) Metascape functional enrichment analysis of the common DEGs between HD-vs-ND and HN-vs-NN. (C) Metascape functional enrichment analysis of DEGs specific differentially expressed in the HD-vs-ND group. (D) Metascape functional enrichment analysis of DEGs specific differentially expressed in HN-vs-NN group. (E) Specific and common DEGs between the SLD chicken and normal chicken (HN-vs-NN compared with HD-vs-ND) in the abdominal fat. (F) Metascape functional enrichment analysis of the common DEGs between HN-vs-NN and HD-vs-ND. (G) Metascape functional enrichment analysis of DEGs specific differentially expressed in HN-vs-NN. (H) Metascape functional enrichment analysis of DEGs specific differentially expressed in HD-vs-ND. (I) Venn diagram analysis of DEGs among HD-vs-ND, ND-vs-NN, HN-vs-NN, and HD-vs-HN in the liver. (J) Venn diagram analysis of DEGs among HD-vs-ND, ND-vs-NN, HN-vs-NN, and HD-vs-HN in the abdominal fat. (K) The expression of six genes selected from the 66 common DEGs was determined by RNA-sequence. (L) The expression of six genes selected from the 48 common DEGs was determined by RNA-sequence. (M) The expression of six genes selected from the 66 common DEGs was determined by qPCR. (N) The expression of six genes selected from the 48 common DEGs was determined by qPCR. The data are mean ± SEM with three samples (n = 3/treatment group).
In abdominal fat, a total of 163 genes were not only differentially expressed between HN and NN chickens but also differentially expressed between HD and ND chickens (Figure 4E and Supplementary File 9). The functions of these common DEGs were related to IGF transport and lipid metabolism (Figure 4F). Additionally, the functions of the 600 DEGs specific differentially expressed between HN and NN fats were mainly enriched in cell cycle, such as cell division, mitotic, regulation of cell cycle process, regulation of chromosome segregation, positive regulation of cell cycle, and meiotic cell cycle process (Figure 4G). The functions of the 730 DEGs, which were specific differentially expressed between HD and ND fats, were related to multiple metabolic processes and homeostasis (Figure 4H).
Next, we compared the common and specific DEGs between different treatment groups in the liver and in the abdominal fat, respectively (Figures 4I,J). We found that a total of 66 DEGs were common differentially expressed in the liver among the four treatment groups (Figure 4I and Supplementary File 10), and that 48 DEGs were common differentially expressed in the abdominal fat among the four treatment groups (Figure 4J and Supplementary File 10). These common DEGs may play important roles in chicken abdominal fat deposition. To test the quality and accuracy of RNA-seq results, we selected several common DEGs, which are related to lipid metabolism and adipogenesis, in the liver and in the abdominal fat, respectively (Figures 4K,L). Then, we used qPCR to validate the expression of DEGs among the four treatment groups. Results showed that the qPCR data were consistent with RNA-seq data (Figures 4M,N), demonstrating that the RNA-seq results were highly reliable.
GHR-Mediated Signaling Pathway Analyses Reveal Key Pathways and Genes Relative to GHR Mutation-Induced Fat Deposition
Growth hormone binds to GHR and activates a variety of downstream signaling pathway. In order to better understand how GHR mutation affects downstream signaling transduction, we constructed a GHR-mediated downstream genes interaction network, which includes JAK–STAT, PI3K–AKT–mTOR, FOXO signaling, GH–GHR–IGFs, and MAPK signaling pathways (Figure 5). Next, we used this network to map the DEGs between the SLD chicken and normal chicken. The DEGs between ND liver and NN liver were enriched in PI3K–Akt–mTOR signaling pathway, which regulated lipid biosynthesis, lipolysis, and cell autophagy (Figure 5A). Additionally, the DEGs between HD liver and HN liver were enriched in JAK–STAT, AKT, and FOXO signaling pathways. Notably, the function of these DEGs was mainly related to cell cycle regulation (Figure 5B). On the other hand, the DEGs between ND and NN abdominal fats were enriched in FOXO signaling pathway, and the functions of these DEGs were related to glycolysis, cell cycle, lipid biosynthesis, and lipid metabolism (Figure 5C). The DEGs between HD and HN abdominal fats were enriched in JAK–STAT signaling pathway, and the functions of these DEGs were related to lipogenesis, glycolysis, and cell cycle (Figure 5D). Notably, SOCS2 and CISH were the only two genes that were differentially expressed in all of the four treatment groups, indicating their important roles on lipid metabolism and GHR mutation-induced fat deposition.
FIGURE 5.

GHR-mediated signaling pathways analyses reveal key pathways and genes relative to GHR mutation-induced fat deposition. (A) Differentially expressed genes (DEGs) of the liver between normal diet fed sex-linked dwarf (SLD) chicken (ND) and normal diet fed normal chicken (NN) enriched in GHR-mediated signaling pathways. (B) DEGs of the liver between high-fat diet fed SLD chicken (HD) and high-fat diet fed normal chicken (HN) enriched in GHR-mediated signaling pathways. (C) DEGs of the abdominal fat between normal diet fed SLD chicken (ND) and normal diet fed normal chicken (NN) enriched in GHR-mediated signaling pathways. (D) DEGs of the abdominal fat between high-fat diet fed SLD chicken (HD) and high-fat diet fed normal chicken (HN) enriched in GHR-mediated signaling pathways. The red fonts or boxes indicate that the genes or biology functions were inhibited. The green fonts or boxes indicate that the genes or biology functions were promoted.
SOCS2 Inhibits Lipid Metabolism and Decreases Lipid Droplet Accumulation
In order to understand the roles of SOCS2 and CISH on GHR mutation-induced abdominal fat deposition, we tested their functions in lipid metabolism and adipocyte differentiation in vitro. The expression of SOCS2 and CISH was significantly downregulated in the liver and abdominal fat of dwarf chicken compared with normal chicken, no matter in an HFD or normal diet condition (Figures 6A–D). Next, we used LMH cell and ICP cell to test the function of SOCS2 and CISH in vitro. To assess the function of SOCS2 and CISH in lipid metabolism and fat deposition and find the potential downstream genes that can be affected by SOCS2 and CISH, we selected several genes that were not only involved in lipid metabolism and fat deposition but also differentially expressed between the SLD chicken and normal chicken as candidate genes to define the status of lipid metabolism and fat deposition. In LMH cell, SOCS2 overexpression significantly inhibited the expression of most of the lipid metabolism-related DEGs, whereas CISH overexpression can only inhibit the expression of CIDEC and FASN (Figure 6E). On the other hand, SOCS2 knockdown significantly promoted the expression of most of the lipid metabolism-related DEGs, whereas CISH knockdown can only promote the expression of CIDEC and FASN (Figure 6F). In ICP cell, SOCS2 overexpression significantly inhibited the expression of fat deposition-related DEGs, whereas CISH overexpression can only inhibit the expression of DGAT2 and ApoB (Figure 6G). The knockdown of SOCS2 promoted the expression of most of the genes involved in fat deposition, whereas CISH knockdown only promoted ApoA4 and ApoB expression (Figure 6H). To investigated whether SOCS2 and CISH can affect lipid droplet accumulation during ICP differentiation, we transfected the overexpression vectors or siRNA of these two genes to the ICP and then induced the cells to differentiation for 48 h. As judged by Oil Red O staining and extraction assays, SOCS2 overexpression significantly reduced lipid droplet accumulation (Figure 6I), whereas SOCS2 inhibition significantly increased lipid droplet accumulation (Figure 6J). However, the overexpression and inhibition of CISH have no significant impacts on lipid droplet accumulation (Figures 6I,J). Taken together, these data indicate that SOCS2 inhibits lipid metabolism and decreases lipid droplet accumulation.
FIGURE 6.
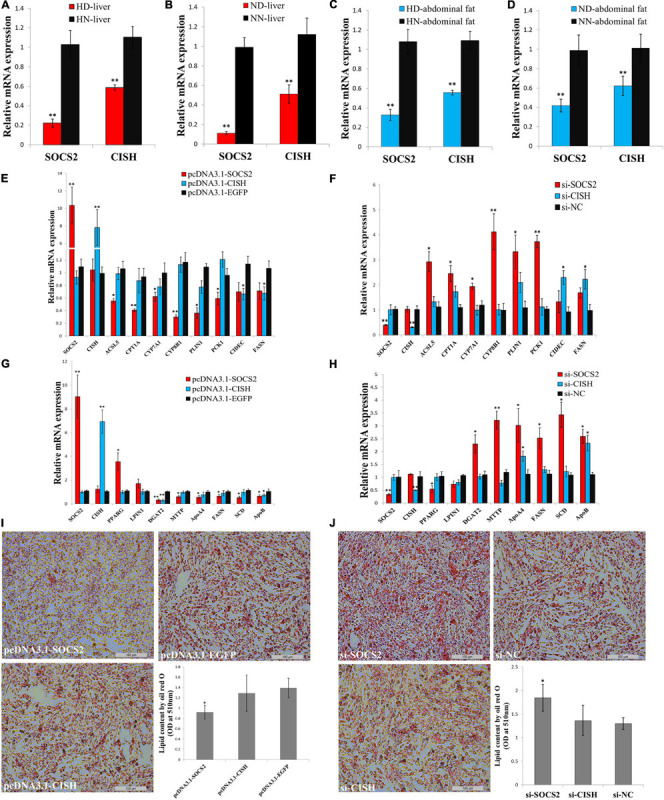
SOCS2 inhibits lipid metabolism and decreases lipid droplet accumulation. (A) The mRNA expression of SOCS2 and CISH in the liver of high-fat diet fed sex-linked dwarf chicken (HD) compared with high-fat diet fed normal chicken (HN). (B) The mRNA expression of SOCS2 and CISH in the liver of normal diet fed sex-linked dwarf chicken (ND) compared with normal diet fed normal chicken (NN). (C) The mRNA expression of SOCS2 and CISH in the abdominal fat of HD chicken compared with HN chicken. (D) The mRNA expression of SOCS2 and CISH in the abdominal fat of ND chicken compared with NN chicken. (E) The expression of lipid metabolism-related differentially expressed genes (DEGs) after transfection of SOCS2 or CISH in LMH cell. (F) The expression of lipid metabolism-related DEGs after transfection of si-SOCS2 or si-CISH in LMH cell. (G) The expression of fat deposition-related DEGs after transfection of SOCS2 or CISH in ICP cell. (H) The expression of fat deposition-related DEGs after transfection of si-SOCS2 or si-CISH in ICP cell. (I) Representative images of Oil Red O staining (red) after overexpression of SOCS2 or CISH in ICP cells; scale bar: 100 μm. (J) Representative images of Oil Red O staining (red) after inhibition of SOCS2 or CISH in ICP cells; scale bar: 100 μm. The data are mean ± SEM with four samples (n = 4/treatment group). Independent sample t-test was used to analyze the statistical differences between groups. ∗P < 0.05; ∗∗P < 0.01.
The Co-overexpression of SOCS2 and CISH Rescues GHR Mutation-Induced Lipid Metabolism Disorder and Lipid Droplet Accumulation
SOCS2 and CISH were both downregulated in the liver and fat of the SLD chicken compared with normal chicken (Figures 6A–D). In order to explore the important roles of SOCS2 and CISH on GHR mutation-induced fat deposition, we used primary liver cell and preadipocyte isolated from the SLD chicken and normal chicken, respectively, to test the function of SOCS2 and CISH on lipid metabolism and lipid droplet accumulation. In accordance with the RNA-seq data, the expression of SOCS2, CISH, and DEGs involved in lipid metabolism and fat deposition was dysregulated in primary cells from the SLD chicken (Figures 7A,B). Overexpression of SOCS2 or CISH alone in the cells from the SLD chicken can partly rescue the dysregulated expression of genes involved in lipid metabolism and fat deposition, whereas co-overexpression of SOCS2 and CISH can rescue most of the dysregulated expression of these genes (Figures 7A,B). Importantly, primary preadipocyte isolated from the SLD chicken can accumulate more lipid droplet than that from the normal chicken (Figure 7C). Overexpression of SOCS2 can significantly decrease lipid droplet accumulation in preadipocyte from the SLD chicken, whereas no significant alteration was observed after transfection of CISH relative to control. However, co-transfection of SOCS2 and CISH decreased more lipid droplet accumulation than individual transfection of SOCS2, suggesting a complementary role between SOCS2 and CISH (Figure 7C). Taken together, these results indicate that co-overexpression of SOCS2 and CISH can make the lipid droplet accumulation of the SLD chicken return to the level of normal chicken, suggesting that SOCS2 and CISH are important in GHR mutation-induced fat deposition in the SLD chicken.
FIGURE 7.
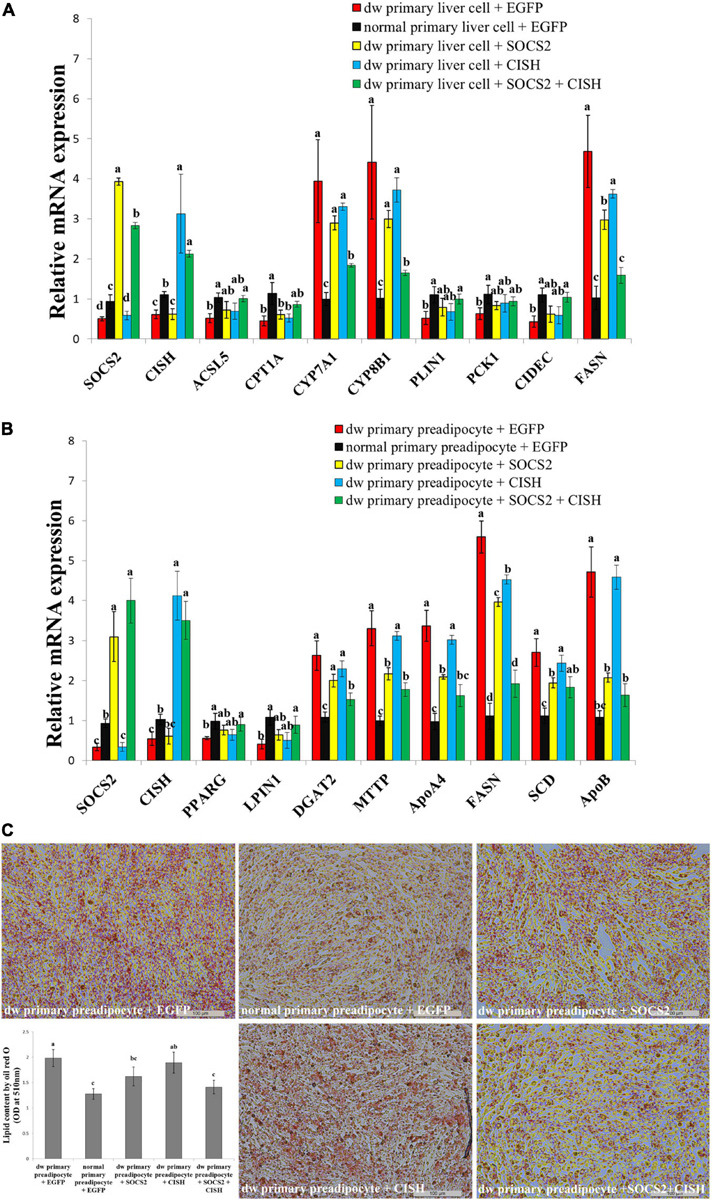
The co-overexpression of SOCS2 and CISH rescues GHR mutation-induced lipid metabolism disorder and lipid droplet accumulation. (A) The relative mRNA expression of lipid metabolism genes after transfection of SOCS2 and CISH overexpression vector in primary liver cells isolated from the sex-linked dwarf chicken and normal chicken. (B) The relative mRNA expression of fat deposition genes after transfection of SOCS2 and CISH overexpression vector in primary preadipocytes isolated from the sex-linked dwarf chicken and normal chicken. (C) Representative images of Oil Red O staining (red) after the transfection of SOCS2 and CISH in primary preadipocyte isolated from the sex-linked dwarf chicken and normal chicken; scale bar: 100 μm. The results are shown as the mean ± SEM of three independent experiments. Different letters a–d above the bars indicate significant differences (P < 0.05) by Duncan’s multiple range test.
Discussion
The broilers used in our study were SLD chicken, which was caused by missense mutation in GHR exon 5. The recessive mutation of GHR results in the disruption of the affinity between GH and GHR protein and further inactivation of the GH–GHR–IGFs growth axis, leading to short stature, weight loss, and obesity (Carter-Su et al., 1996). The SLD chicken is widely used in the broiler industry due to its relatively higher feed conversion, higher egg laying performance, and better meat quality (Guillaume, 1976). However, excessive fat deposition is frequently found in the SLD chickens, causing a series of negative effect, such as feed conversion rate reduction and depressed reproduction performance. The precise molecular mechanism of GHR mutation-induced excessive fat deposition in chicken remains unknown, though it has been shown that GHR mutation impedes lipolysis and fat deposition through the GH–GHR–IGFs axis (Guevara-Aguirre and Rosenbloom, 2015). Therefore, it is worth to investigate the regulatory genes and pathways of excessive fat deposition of the SLD chicken. In this study, the phenotype of the SLD chicken under an HFD and normal diet was determined. It was found that the chickens have no significant difference in body weight under the HFD and the normal diet, but the body weight of the SLD chicken was lower than that of normal chicken. The abdominal fat weight and abdominal fat rate of the SLD chicken were significantly higher than those of normal chicken in both diets, suggesting that the ability of fat deposition of the SLD chicken was greater than that of normal chicken, similar to GHR mutation mice (Erman et al., 2011; Zhang et al., 2018). On the other hand, the adipocyte cell size of the SLD chicken was larger than that of normal chicken. Notably, HFD can increase the abdominal fat weight, abdominal fat rate, and adipocyte size of both the SLD chicken and normal chicken. The accumulation of fat comes from the increase of adipocyte number and adipocyte size. Our results have shown that the adipocyte size of the SLD chicken was larger than that of normal chicken, but the number of adipocytes was hard to count. Considering that the genes related to adipogenesis were highly expressed in the SLD chicken, we believe that both the size and number of adipocytes in the SLD chicken were larger than those in normal chicken. Besides, HFD can increase the abdominal fat weight and adipocyte size of both the SLD chicken and normal chicken. However, as shown in Figure 1B, the increase scale in normal chicken (about four times) was larger than that in the SLD chicken (about 1.7 times). A similar phenomenon was also observed in GHR–/– mice. Under the HFD, the fat weight of wild-type (WT) mice was increased by 3.1 times, whereas the fat weight of GHR–/– mice was only raised by 1.9 times (Berryman et al., 2006). Therefore, GHR mutation or knockout not only increased fat deposition but also limited excessive fat deposition caused by HFD.
Many genes have been found to be involved in the regulation of lipid metabolism and fat deposition, such as ACSL5 (Oikawa et al., 1998), CPT1A (Schlaepfer and Joshi, 2020), CYP7A1 (Chen et al., 2012; Hori et al., 2020), CYP8B1 (Kwong et al., 2015; Hori et al., 2020), PLIN1 (Sun et al., 2020), PCK1 (Xu et al., 2020), CIDEC (Zhou et al., 2012), and FASN (Wallace and Metallo, 2020), which play key roles in fatty acid metabolism in the liver. On the other hand, many genes are essential for lipid biosynthesis in the abdominal fat, such as PPARG (Lehrke and Lazar, 2005; Semple, 2006), LPIN1 (Csaki et al., 2014; Chen et al., 2015), DGAT2 (Bhatt-Wessel et al., 2018), MTTP (Jamil et al., 1995; Iqbal et al., 2020), ApoA4 (Wang et al., 2019), FASN (Wallace and Metallo, 2020), SCD (ALJohani et al., 2017; Liu et al., 2020), and ApoB (Sirwi and Hussain, 2018). However, it is still unclear which lipid metabolism-related gene would be directly affected by the GHR gene mutation and then cause abdominal fat deposition in the SLD chickens. In this study, we found that SOCS2 and CISH are two important genes that mediated GHR signaling and lipid metabolism-related genes and pathways. The expression of SOCS2 and CISH was downregulated in GHR-downstream network analysis, and the function of these two genes was related to GHR mutation-induced fat deposition. SOCS2 and CISH are members of SOCS protein and CISHs family, respectively. Most SOCS proteins are regulated by cytokine and form negative regulatory pathways with cytokine signals (Davies et al., 2007). Among GHR-downstream networks, SOCS negatively regulated JAK2 and STAT3, whereas CIS negatively regulated STAT1 (Krebs and Hilton, 2001). SOCS proteins are involved in a wide range of physiological processes (Yoshimura et al., 2007). It has been shown that SOCS1 and SOCS3 are involved in the induction of insulin resistance, and that the ablation of SOCS3 expression in adipose tissue of female mice improves insulin sensitivity to obesity (Palanivel et al., 2012). In 3T3L1 adipocytes, the SOCS3 expression is increased by insulin, which can bind to the insulin receptor and inhibit STAT5b expression (Emanuelli et al., 2001). Besides, the expression of SOCS1 or SOCS3 can depress the activation of glucose uptake in 3T3L1 cells, and both negatively regulate insulin signal pathway (Ueki et al., 2004). However, SOCS2 plays a different role from other family members. SOCS2 protein can form E3 ubiquitin ligase with Elongin B/C to ubiquitinate SOCS3 (Tannahill et al., 2005). CISH is the first uncover gene in the SOCS family. The variation in CISH results in the change of human sensitivity to infectious disease (Khor et al., 2010). Conditional knockout of CISH in beta cells confirms that CISH and SOCS2 negatively regulate the proliferation and function of beta cells (Jiao et al., 2013). CISH mRNA expression was increased in differentiated 3T3-L1 cells stimulated by GH, and mice fed an HFD had higher intra-abdominal adipose tissue and a higher expression of CISH than control mice (Hayashi et al., 2017). In addition, SOCS/CISH proteins may serve as part of the feedback loop to stimulate lipolysis, via inhibiting the JAK/STAT signaling pathway (Moller and Jorgensen, 2009). In this study, the roles of SOCS2 and CISH on lipid metabolism were studied. We found that the mRNA expression of SOCS2 and CISH in primary liver cell and preadipocyte of the SLD chicken was suppressed, and that the overexpression of SOCS2 and CISH can depress the expression of genes relative to fatty acid metabolism, adipocyte differentiation, and lipid droplet accumulation, suggesting their effect on adipogenesis.
The effects of interaction between the SOCS2 and GH–GHR axes on growth and fat deposition have been reported in several studies. SOCS2-deficient mice displayed an increase of organ and bone after birth, though there was no significant change at birth. The body weight of SOCS2 specific-knockout mice was increased by more than 30%, and exogenous GH supplementation can reduce the overgrowth of GH and SOCS DKO mice (Greenhalgh et al., 2005). SOCS2 can bind phosphorylated tyrosine of GHR and negatively regulate GH signal (Greenhalgh et al., 2005). The overgrowth of mice with abnormal SOCS2 expression seems to be caused by the failure of depression mediated by GHR, leading to the continued expression of STAT5 (Turnley, 2005). In the liver of SOCS2 knockout mice, the expression of GHR was increased, and in turn, SOCS2 regulates the cellular expression of GHR by the way of ubiquitylation (Vesterlund et al., 2011). The SOCS2 knockout mice showed an increase of 77.6% in hepatic triglycerides, whereas the hepatic steatosis caused by HFD was depressed. Under the HFD, SOCS2 knockout mice showed a significant decrease in triglycerides of the liver (Zadjali et al., 2012). In the same way, the overexpression of SOCS2 in porcine primary adipocyte can significantly depress the expression of PPARγ, FAS, and ATGL and suppress STAT3 and STAT5, suggesting that SOCS2 may be an important regulator of GH signal in porcine adipocyte (Yang et al., 2012). In this study, the overexpression of SOCS2 can depress the genes related to lipogeneses and fat deposition. In addition, we also found that co-transfection of SOCS2 and CISH can rescue hyperactive lipid metabolism and fat deposition. It was shown that SOCS2 and CISH interact with the leptin receptor. SOCS2 binds to the Y1077 motif of leptin and has a higher affinity to mediate the combination of CISH and STAT5a to this site (Lavens et al., 2006). In the liver of mice, GH activated the expression of SOCS2 and CISH. Co-transfection assay suggested that CISH can depress the activation of STAT5 mediated by GH (Karlsson et al., 1999). CISH regulates GHR internalization through proteasome mechanism and ultimately downregulates GH signal (Landsman and Waxman, 2005). In the SLD chicken, the detailed regulatory mechanism of interaction between SOCS2 and CISH on lipid metabolism and fat deposition still needs to be further explored.
An HFD can effectively increase abdominal fat deposition and body weight. For the two chicken breeds in our study, abdominal fat weight was significantly increased under HFD, whereas body weight was not significantly affected, suggesting that the excessive energy of the HFD was mainly used for fat storage. The HFD can increase the level of free fatty acid, change energy dynamic balance, and affect brain cognition in a short period (Holloway et al., 2011). Long-term high-fat intake promotes fat accumulation more than consumption, which leads to obesity, diabetes, and fatty liver disease (Hariri and Thibault, 2010; Saponaro et al., 2015). The different levels of energy intake can lead to the distinct expression of GHR and downstream signaling in subcutaneous adipose tissue. After long-term energy restriction, the expression of GHR significantly increased, and STAT3 expression decreased, whereas a long-term overfeeding led to an opposite expression trend (Glad et al., 2019). In the SLD chicken, this kind of GH-mediated signaling change resulting from alternation of diet energy content may be disrupted. On the other way, GHR-KO mice exhibit an excessive fat deposition, but they have the ability to resist metabolic deterioration inducted by HFD and reduce cancer risk (Dehkhoda et al., 2018). Presently, the mechanism of reduced side effects of feeding an HFD in the GHR mutation model remains to be studied.
Conclusion
To summarize, our results show that the SLD chicken has higher abdominal fat rate and larger adipocyte size than normal chicken, and that an HFD can increase the abdominal fat rate and adipocyte size in chicken. Integrative analysis of the gene expression profiles of livers and abdominal fats between the SLD chicken and normal chicken revealed that many DEGs are associated with cell growth, lipid metabolism, lipid transport, and adipocyte differentiation pathways. Moreover, our results suggest that SOCS2 and CISH are the core regulators for GHR mutation-induced fat deposition in the SLD chicken.
Data Availability Statement
The datasets presented in this study can be found in online repositories. The names of the repository/repositories and accession number(s) can be found in the article/Supplementary Material.
Ethics Statement
The animal study was approved by the Institutional Animal Care and Use Committee of the South China Agricultural University.
Author Contributions
WL, QN, and XZ conceived and designed the study. WL and GC drafted the manuscript. GC, JC, XR, LL, SLu, TC, and LT performed the experiments. WL, GC, JC, JW, XR, ML, SLi, and QL carried out the data analysis. All authors have read and approved the final manuscript.
Conflict of Interest
The authors declare that the research was conducted in the absence of any commercial or financial relationships that could be construed as a potential conflict of interest.
Abbreviations
- AACS
acetoacetyl-CoA synthetase
- ACC
anterior capsular cataract
- ACSL5
acyl-CoA synthetase long-chain family member 5
- AKT
serine/threonine kinase
- AOX
acyl-coenzyme A oxidase 1, palmitoyl
- ApoA4
apolipoprotein A4
- ApoB
apolipoprotein B
- ATG1
serine/threonine–protein kinase
- Bcl-XL
BCL2 like 1
- CIS
cytokine inducible SH2 containing protein
- c-fos
Fos proto-oncogene, AP-1 transcription factor subunit
- CIDEC
cell death inducing DFFA like effector c
- c-Myc, v-myc
avian myelocytomatosis viral oncogene homolog
- CPT1A
carnitine palmitoyltransferase 1A
- CREB
cAMP responsive element binding protein
- Cycd
Cyclin D
- CYP7A1
cytochrome P450 family 7 subfamily A member 1
- CYP8B1
cytochrome P450 family 8 subfamily B member 1
- DGAT2
diacylglycerol O-acyltransferase 2
- 4E-BP
eukaryotic translation initiation factor 4E binding protein
- eIf4E
eukaryotic translation initiation factor 4E
- ERK1/2
mitogen-activated protein kinase 3/1
- ETNPPL
ethanolamine-phosphate phospho-lyase
- FAS
Fas cell surface death receptor
- FASN
fatty acid synthase
- FBP
fructose-1,6-bisphosphatase
- FOXO
forkhead box O
- G6PC
glucose-6-phosphatase catalytic subunit
- GFAP
glial fibrillary acidic protein
- GK
glycerol kinase
- GRB2
growth factor receptor bound protein 2
- Grb10
growth factor receptor bound protein 10
- GSK3B
glycogen synthase kinase 3 beta
- IGF1
insulin-like growth factor 1
- IGF1R
insulin-like growth factor 1 receptor
- IGF2
insulin-like growth factor 2
- IGF2BP1
insulin-like growth factor 2 mRNA binding protein 1
- IKK
I-kappaB kinase
- IL21R
interleukin 21 receptor
- IRS
isoleucyl-tRNA synthetase 1
- JAK2
Janus kinase 2
- JNK
mitogen-activated protein kinase 8
- JunD
JunD proto-oncogene
- AP-1
transcription factor subunit
- LBFABP
liver basic fatty acid binding protein
- LPIN1
lipin 1
- MCL1
BCL2 family apoptosis regulator
- MEK1/2
mitogen-activated protein kinase kinase 1/2
- MEKK1
mitogen-activated protein kinase kinase kinase 1
- MKK4
mitogen-activated protein kinase kinase 4
- Msx1
msh homeobox 1
- mTOR
mechanistic target of rapamycin
- MTTP
microsomal triglyceride transfer protein
- NSDHL
NAD(P)-dependent steroid dehydrogenase-like
- p21
cyclin dependent kinase inhibitor 1A
- p70S6K
ribosomal protein S6 kinase B1
- PCK1
phosphoenolpyruvate carboxykinase 1
- PDK1
pyruvate dehydrogenase kinase 1
- PEPCK
phosphoenolpyruvate carboxykinase 1
- PI3K
phosphatidylinositol 3-kinase
- PIM1
Pim-1 proto-oncogene, serine/threonine kinase
- PKC
protein kinase C
- PLIN1
perilipin 1
- Plk
polo like kinase
- PPARG
peroxisome proliferator-activated receptor gamma
- PTEN
phosphatase and tensin homolog
- PYK
pyruvate kinase
- RAS
resistance to audiogenic seizures
- RAF
Raf-1 proto-oncogene, serine/threonine kinase
- SCD
stearoyl-CoA desaturase
- SHC
SHC adaptor protein
- SLN
sarcolipin
- SOCS2
suppressor of cytokine signaling 2
- SOS
Ras/Rac guanine nucleotide exchange factor 1
- SREBP-1c
sterol regulatory element binding protein-1c
- STAT1
signal transducer and activator of transcription 1
- STAT3
signal transducer and activator of transcription 3
- STAT5
signal transducer and activator of transcription 5.
Funding. This work was supported by a grant from the Guangdong Provincial Promotion Project on Preservation and Utilization of Local Breed of Livestock and Poultry, the Natural Scientific Foundation of China (31702105 and 31972544), the Natural Science Foundation of Guangdong Province (2019A1515010923), the China Agriculture Research System (CARS-41-G03), and the Science and Technology Program of Guangzhou (201804020088).
Supplementary Material
The Supplementary Material for this article can be found online at: https://www.frontiersin.org/articles/10.3389/fgene.2020.610605/full#supplementary-material
The specific primers used for plasmid construction and qRT-PCR.
The genes list of scatter plot of differentially expressed genes (DEGs) between ND and NN chicken in the liver.
The genes list of scatter plot of DEGs between HD and HN chicken in the liver.
The distribution of DEGs between ND-vs-NN and HD-vs-HN in the liver.
The genes list of scatter plot of DEGs between ND and NN chicken in the fat.
The genes list of scatter plot of DEGs between HD and HN chicken in the fat.
The distribution of DEGs between ND-vs-NN and HD-vs-HN in the fat.
The distribution of DEGs between HD-vs-ND and HN-vs-NN in the liver.
The distribution of DEGs between HD-vs-ND and HN-vs-NN in the fat.
The distribution of DEGs among the four treatment groups.
References
- ALJohani A. M., Syed D. N., Ntambi J. M. (2017). Insights into stearoyl-coa desaturase-1 regulation of systemic metabolism. Trends Endocrinol. Metab. 28 831–842. 10.1016/j.tem.2017.10.003 [DOI] [PMC free article] [PubMed] [Google Scholar]
- Berg M. A., Argente J., Chernausek S., Gracia R., Guevara-Aguirre J., Hopp M., et al. (1993). Diverse growth hormone receptor gene mutations in laron syndrome. Am. J. Hum. Genet. 52 998–1005. [PMC free article] [PubMed] [Google Scholar]
- Berryman D. E., List E. O., Kohn D. T., Coschigano K. T., Seeley R. J., Kopchick J. J. (2006). Effect of growth hormone on susceptibility to diet-induced obesity. Endocrinology 147 2801–2808. 10.1210/en.2006-0086 [DOI] [PubMed] [Google Scholar]
- Berryman D. E., List E. O., Palmer A. J., Chung M. Y., Wright-Piekarski J., Lubbers E., et al. (2009). Two-year body composition analyses of long-lived ghr null mice. J. Gerontol. Ser. A Biol. Sci. Med. Sci. 65A 31–40. 10.1093/gerona/glp175 [DOI] [PMC free article] [PubMed] [Google Scholar]
- Bhatt-Wessel B., Jordan T. W., Miller J. H., Peng L. (2018). Role of dgat enzymes in triacylglycerol metabolism. Arch. Biochem. Biophys. 655 1–11. 10.1016/j.abb.2018.08.001 [DOI] [PubMed] [Google Scholar]
- Cai H., Dong L. Q., Liu F. (2016). Recent advances in adipose mtor signaling and function: therapeutic prospects. Trends Pharmacol. Sci. 37 303–317. 10.1016/j.tips.2015.11.011 [DOI] [PMC free article] [PubMed] [Google Scholar]
- Carter-Su C., Schwartz J., Smit L. J. (1996). Molecular mechanism of growth hormone action. Annu. Rev. Physiol. 58 187–207. 10.1146/annurev.ph.58.030196.001155 [DOI] [PubMed] [Google Scholar]
- Chen J., Ren X., Li L., Lu S., Chen T., Tan L., et al. (2019). Integrative analyses of mrna expression profile reveal the involvement of igf2bp1 in chicken adipogenesis. Int. J. Mol. Sci. 20:2923. 10.3390/ijms20122923 [DOI] [PMC free article] [PubMed] [Google Scholar]
- Chen W., Guo J., Chang P. (2012). The effect of taurine on cholesterol metabolism. Mol. Nutr. Food Res. 56 681–690. 10.1002/mnfr.201100799 [DOI] [PubMed] [Google Scholar]
- Chen Y., Rui B., Tang L., Hu C. (2015). Lipin family proteins - key regulators in lipid metabolism. Ann. Nutr. Metab. 66 10–18. 10.1159/000368661 [DOI] [PubMed] [Google Scholar]
- Chhabra Y., Nelson C. N., Plescher M., Barclay J. L., Smith A. G., Andrikopoulos S., et al. (2019). Loss of growth hormone–mediated signal transducer and activator of transcription 5 (stat5) signaling in mice results in insulin sensitivity with obesity. FASEB J. 33 6412–6430. 10.1096/fj.201802328R [DOI] [PMC free article] [PubMed] [Google Scholar]
- Csaki L. S., Dwyer J. R., Li X., Nguyen M. H. K., Dewald J., Brindley D. N., et al. (2014). Lipin-1 and lipin-3 together determine adiposity in vivo. Mol. Metab. 3 145–154. 10.1016/j.molmet.2013.11.008 [DOI] [PMC free article] [PubMed] [Google Scholar]
- Cui H. X., Shen Q. C., Zheng M. Q., Su Y. C., Cai R. C., Yu Y., et al. (2019). A selection method of chickens with blue-eggshell and dwarf traits by molecular marker-assisted selection. Poultry Sci. 98 3114–3118. 10.3382/ps/pez069 [DOI] [PubMed] [Google Scholar]
- Davies J. S., Gevers E. F., Stevenson A. E., Coschigano K. T., El-Kasti M. M., Bull M. J., et al. (2007). Adiposity profile in the dwarf rat: an unusually lean model of profound growth hormone deficiency. Am. J. Physiol. Endoc. M 292 E1483–E1494. 10.1152/ajpendo.00417.2006 [DOI] [PubMed] [Google Scholar]
- Dehkhoda F., Lee C., Medina J., Brooks A. J. (2018). The growth hormone receptor: mechanism of receptor activation, cell signaling, and physiological aspects. Front. Endocrinol. 9:35. 10.3389/fendo.2018.00035 [DOI] [PMC free article] [PubMed] [Google Scholar]
- Emanuelli B., Peraldi P., Filloux C., Chavey C., Freidinger K., Hilton D. J., et al. (2001). Socs-3 inhibits insulin signaling and is up-regulated in response to tumor necrosis factor-α in the adipose tissue of obese mice. J. Biol. Chem. 276 47944–47949. 10.1074/jbc.M104602200 [DOI] [PubMed] [Google Scholar]
- Erman A., Veilleux A., Tchernof A., Goodyer C. G. (2011). Human growth hormone receptor (ghr) expression in obesity: i. Ghr mrna expression in omental and subcutaneous adipose tissues of obese women. Int. J. Obes. 35 1511–1519. 10.1038/ijo.2011.23 [DOI] [PubMed] [Google Scholar]
- Fang Y., Hill C. M., Darcy J., Reyes-Ordoñez A., Arauz E., McFadden S., et al. (2018). Effects of rapamycin on growth hormone receptor knockout mice. Proc. Natl. Acad. Sci. U.S.A. 115 E1495–E1503. 10.1073/pnas.1717065115 [DOI] [PMC free article] [PubMed] [Google Scholar]
- Ferdaus A., Bhuiyan M., Hassin B. M., Bhuiyan A., Howlider M. (2016). Phenotypic characterization and productive potentialities of indigenous dwarf chicken of bangladesh. Bangladesh J. Anim. Sci. 45 52–61. 10.3329/bjas.v45i1.27489 [DOI] [Google Scholar]
- Filopanti M., Giavoli C., Grottoli S., Bianchi A., De Marinis L., Ghigo E., et al. (2011). The exon 3-deleted growth hormone receptor: molecular and functional characterization and impact on gh/igf-i axis in physiological and pathological conditions. J. Endocrinol. Invest. 34 861–868. 10.1007/BF03346731 [DOI] [PubMed] [Google Scholar]
- Ginsberg S., Laron Z., Bed M. A., Vaisman N. (2009). The obesity of patients with laron syndrome is not associated with excessive nutritional intake. Obes. Res. Clin. Pract. 3 3–8. 10.1016/j.orcp.2008.11.001 [DOI] [PubMed] [Google Scholar]
- Glad C. A. M., Carlsson L. M. S., Melander O., Almgren P., Sjöström L., Nilsson S., et al. (2015). The gh receptor exon 3 deleted/full-length polymorphism is associated with central adiposity in the general population. Eur. J. Endocrinol. 172 123–128. 10.1530/EJE-14-0723 [DOI] [PubMed] [Google Scholar]
- Glad C. A. M., Svensson P., Nystrom F. H., Jacobson P., Carlsson L. M. S., Johannsson G., et al. (2019). Expression of ghr and downstream signaling genes in human adipose tissue—relation to obesity and weight change. J. Clin. Endocrinol. Metab. 104 1459–1470. 10.1210/jc.2018-01036 [DOI] [PubMed] [Google Scholar]
- Greenhalgh C. J., Rico-Bautista E., Lorentzon M., Thaus A. L., Morgan P. O., Willson T. A., et al. (2005). Socs2 negatively regulates growth hormone action in vitro and in vivo. J. Clin. Invest. 115 397–406. 10.1172/JCI200522710 [DOI] [PMC free article] [PubMed] [Google Scholar]
- Guevara-Aguirre J., Rosenbloom A. L. (2015). Obesity, diabetes and cancer: insight into the relationship from a cohort with growth hormone receptor deficiency. Diabetologia 58 37–42. 10.1007/s00125-014-3397-3 [DOI] [PubMed] [Google Scholar]
- Guillaume J. (1976). The dwarfing gene dw: its effects on anatomy, physiology, nutrition, management. Its application in poultry industry. World’s Poultry Sci. J. 32 285–305. 10.1079/WPS19760009 [DOI] [Google Scholar]
- Hariri N., Thibault L. (2010). High-fat diet-induced obesity in animal models. Nutr. Res. Rev. 23 270–299. 10.1017/S0954422410000168 [DOI] [PubMed] [Google Scholar]
- Hayashi M., Futawaka K., Koyama R., Fan Y., Matsushita M., Hirao A., et al. (2017). Effects of growth hormone on uncoupling protein 1 in white adipose tissues in obese mice. Growth Horm. Igf Res. 37 31–39. 10.1016/j.ghir.2017.10.006 [DOI] [PubMed] [Google Scholar]
- Hinrichs A., Kessler B., Kurome M., Blutke A., Kemter E., Bernau M., et al. (2018). Growth hormone receptor-deficient pigs resemble the pathophysiology of human laron syndrome and reveal altered activation of signaling cascades in the liver. Mol. Metab. 11 113–128. 10.1016/j.molmet.2018.03.006 [DOI] [PMC free article] [PubMed] [Google Scholar]
- Holloway C. J., Cochlin L. E., Emmanuel Y., Murray A., Codreanu I., Edwards L. M., et al. (2011). A high-fat diet impairs cardiac high-energy phosphate metabolism and cognitive function in healthy human subjects. Am. J. Clin. Nutr. 93 748–755. 10.3945/ajcn.110.002758 [DOI] [PubMed] [Google Scholar]
- Hori S., Abe T., Lee D. G., Fukiya S., Yokota A., Aso N., et al. (2020). Association between 12α-hydroxylated bile acids and hepatic steatosis in rats fed a high-fat diet. J. Nutr. Biochem. 83:108412. 10.1016/j.jnutbio.2020.108412 [DOI] [PubMed] [Google Scholar]
- Iqbal J., Jahangir Z., Al-Qarni A. A. (2020). Microsomal triglyceride transfer protein: from lipid metabolism to metabolic diseases. Adv. Exp. Med. Biol. 1276 37–52. 10.1007/978-981-15-6082-8_4 [DOI] [PubMed] [Google Scholar]
- Jamil H., Dickson J. K., Chu C., Lago M. W., Rinehart J. K., Biller S. A., et al. (1995). Microsomal triglyceride transfer protein. J. Biol. Chem. 270 6549–6554. 10.1074/jbc.270.12.6549 [DOI] [PubMed] [Google Scholar]
- Jiao Y., Rieck S., Le Lay J., Kaestner K. H. (2013). Cish has no non-redundant functions in glucose homeostasis or beta cell proliferation during pregnancy in mice. Diabetologia 56 2435–2445. 10.1007/s00125-013-3014-x [DOI] [PMC free article] [PubMed] [Google Scholar]
- Kanehisa M. (2000). Kegg: kyoto encyclopedia of genes and genomes. Nucleic Acids Res. 28 27–30. 10.1093/nar/28.1.27 [DOI] [PMC free article] [PubMed] [Google Scholar]
- Kanehisa M., Furumichi M., Tanabe M., Sato Y., Morishima K. (2017). Kegg: new perspectives on genomes, pathways, diseases and drugs. Nucleic Acids Res. 45 D353–D361. 10.1093/nar/gkw1092 [DOI] [PMC free article] [PubMed] [Google Scholar]
- Karlsson H., Gustafsson J., Mode A. (1999). Cis desensitizes gh induced stat5 signaling in rat liver cells. Mol. Cell. Endocrinol. 154 37–43. 10.1016/S0303-7207(99)00101-X [DOI] [PubMed] [Google Scholar]
- Khor C. C., Vannberg F. O., Chapman S. J., Guo H., Wong S. H., Walley A. J., et al. (2010). Cish and susceptibility to infectious diseases. New Engl. J. Med. 362 2092–2101. 10.1056/NEJMoa0905606 [DOI] [PMC free article] [PubMed] [Google Scholar]
- Knížetová H. (1993). Effects of the sex-linked dwarf gene (dw) on skeletal muscle cellularity in broiler chickens. Br. Poultry Sci. 34 479–485. 10.1080/00071669308417603 [DOI] [PubMed] [Google Scholar]
- Krebs D. L., Hilton D. J. (2001). Socs proteins: negative regulators of cytokine signaling. Stem Cells 19 378–387. 10.1634/stemcells.19-5-378 [DOI] [PubMed] [Google Scholar]
- Kwong E., Li Y., Hylemon P. B., Zhou H. (2015). Bile acids and sphingosine-1-phosphate receptor 2 in hepatic lipid metabolism. Acta Pharm. Sin. B 5 151–157. 10.1016/j.apsb.2014.12.009 [DOI] [PMC free article] [PubMed] [Google Scholar]
- Lagarrigue S., Pitel F., Carré W., Abasht B., Le Roy P., Neau A., et al. (2006). Mapping quantitative trait loci affecting fatness and breast muscle weight in meat-type chicken lines divergently selected on abdominal fatness. Genet. Sel. Evol. 38 85–97. 10.1051/gse:2005028 [DOI] [PMC free article] [PubMed] [Google Scholar]
- Landsman T., Waxman D. J. (2005). Role of the cytokine-induced sh2 domain-containing protein cis in growth hormone receptor internalization. J. Biol. Chem. 280 37471–37480. 10.1074/jbc.M504125200 [DOI] [PubMed] [Google Scholar]
- Lavens D., Montoye T., Piessevaux J., Zabeau L., Vandekerckhove J., Gevaert K., et al. (2006). A complex interaction pattern of cis and socs2 with the leptin receptor. J. Cell Sci. 119 2214–2224. 10.1242/jcs.02947 [DOI] [PubMed] [Google Scholar]
- Lehrke M., Lazar M. A. (2005). The many faces of pparγ. Cell 123 993–999. 10.1016/j.cell.2005.11.026 [DOI] [PubMed] [Google Scholar]
- Lin S., Li C., Li C., Zhang X. (2018). Growth hormone receptor mutations related to individual dwarfism. Int. J. Mol. Sci. 19:1433. 10.3390/ijms19051433 [DOI] [PMC free article] [PubMed] [Google Scholar]
- List E. O., Berryman D. E., Buchman M., Parker C., Funk K., Bell S., et al. (2019). Adipocyte-specific gh receptor–null (adghrko) mice have enhanced insulin sensitivity with reduced liver triglycerides. Endocrinology 160 68–80. 10.1210/en.2018-00850 [DOI] [PMC free article] [PubMed] [Google Scholar]
- Liu K., Lin L., Li Q., Xue Y., Zheng F., Wang G., et al. (2020). Scd1 controls de novo beige fat biogenesis through succinate-dependent regulation of mitochondrial complex ii. Proc. Natl. Acad. Sci. U.S.A. 117 2462–2472. 10.1073/pnas.1914553117 [DOI] [PMC free article] [PubMed] [Google Scholar]
- Luo W., Lin S., Li G., Nie Q., Zhang X. (2016). Integrative analyses of mirna-mrna interactions reveal let-7b, mir-128 and mapk pathway involvement in muscle mass loss in sex-linked dwarf chickens. Int. J. Mol. Sci. 17:276. 10.3390/ijms17030276 [DOI] [PMC free article] [PubMed] [Google Scholar]
- Masternak M. M., Bartke A., Wang F., Spong A., Gesing A., Fang Y., et al. (2012). Metabolic effects of intra-abdominal fat in ghrko mice. Aging Cell 11 73–81. 10.1111/j.1474-9726.2011.00763.x [DOI] [PMC free article] [PubMed] [Google Scholar]
- Melesse A., Maak S., Pingel H., VonLengerken G. (2013). Assessing the thermo-tolerance potentials of five commercial layer chicken genotypes under long-term heat stress environment as measured by their performance traits. J. Anim. Product. Adv. 3:254 10.5455/japa.20120929125835 [DOI] [Google Scholar]
- Moller N., Jorgensen J. O. L. (2009). Effects of growth hormone on glucose, lipid, and protein metabolism in human subjects. Endocr. Rev. 30 152–177. 10.1210/er.2008-0027 [DOI] [PubMed] [Google Scholar]
- Oikawa E., Iijima H., Suzuki T., Sasano H., Sato H., Kamataki A., et al. (1998). A novel acyl-coa synthetase, acs5, expressed in intestinal epithelial cells and proliferating preadipocytes. J. Biochem. 124 679–685. 10.1093/oxfordjournals.jbchem.a022165 [DOI] [PubMed] [Google Scholar]
- Palanivel R., Fullerton M. D., Galic S., Honeyman J., Hewitt K. A., Jorgensen S. B., et al. (2012). Reduced socs3 expression in adipose tissue protects female mice against obesity-induced insulin resistance. Diabetologia 55 3083–3093. 10.1007/s00125-012-2665-3 [DOI] [PMC free article] [PubMed] [Google Scholar]
- Pan X., Zhang Y., Kim H., Liangpunsakul S., Dong X. C. (2017). Foxo transcription factors protect against the diet-induced fatty liver disease. Sci. Rep. UK 7:44597. 10.1038/srep44597 [DOI] [PMC free article] [PubMed] [Google Scholar]
- Peng X. D. (2003). Dwarfism, impaired skin development, skeletal muscle atrophy, delayed bone development, and impeded adipogenesis in mice lacking akt1 and akt2. Gene. Dev. 17 1352–1365. 10.1101/gad.1089403 [DOI] [PMC free article] [PubMed] [Google Scholar]
- Ran L., Wang X., Mi A., Liu Y., Wu J., Wang H., et al. (2019). Loss of adipose growth hormone receptor in mice enhances local fatty acid trapping and impairs brown adipose tissue thermogenesis. iScience 16 106–121. 10.1016/j.isci.2019.05.020 [DOI] [PMC free article] [PubMed] [Google Scholar]
- Rosenfeld R. G., Belgorosky A., Camacho-Hubner C., Savage M. O., Wit J. M., Hwa V. (2007). Defects in growth hormone receptor signaling. Trends Endocrinol. Metab. 18 134–141. 10.1016/j.tem.2007.03.004 [DOI] [PubMed] [Google Scholar]
- Saponaro C., Gaggini M., Carli F., Gastaldelli A. (2015). The subtle balance between lipolysis and lipogenesis: a critical point in metabolic homeostasis. Nutrients 7 9453–9474. 10.3390/nu7115475 [DOI] [PMC free article] [PubMed] [Google Scholar]
- Schlaepfer I. R., Joshi M. (2020). Cpt1a-mediated fat oxidation, mechanisms, and therapeutic potential. Endocrinology 161:bqz046. 10.1210/endocr/bqz046 [DOI] [PubMed] [Google Scholar]
- Semple R. K. (2006). Ppar and human metabolic disease. J. Clin. Invest. 116 581–589. 10.1172/JCI28003 [DOI] [PMC free article] [PubMed] [Google Scholar]
- Sirwi A., Hussain M. M. (2018). Lipid transfer proteins in the assembly of apob-containing lipoproteins. J. Lipid Res. 59 1094–1102. 10.1194/jlr.R083451 [DOI] [PMC free article] [PubMed] [Google Scholar]
- Sun Y., Zhai G., Li R., Zhou W., Li Y., Cao Z., et al. (2020). Rxrα positively regulates expression of the chicken plin1 gene in a pparγ-independent manner and promotes adipogenesis. Front. Cell Dev. Biol. 8:349 10.3389/fcell.2020.00349 [DOI] [PMC free article] [PubMed] [Google Scholar]
- Tahara K., Tsukada A., Hanai T., Okumura K., Yamada K., Murai A., et al. (2009). Identification of two types of growth hormone receptor mutations in two strains of sex-linked dwarf chickens. J. Poultry Sci. 46 249–256. 10.2141/jpsa.46.249 [DOI] [Google Scholar]
- Tannahill G. M., Elliott J., Barry A. C., Hibbert L., Cacalano N. A., Johnston J. A. (2005). Socs2 can enhance interleukin-2 (il-2) and il-3 signaling by accelerating socs3 degradation. Mol. Cell. Biol. 25 9115–9126. 10.1128/MCB.25.20.9115-9126.2005 [DOI] [PMC free article] [PubMed] [Google Scholar]
- Turnley A. M. (2005). Role of socs2 in growth hormone actions. Trends Endocrinol. Metab. 16 53–58. 10.1016/j.tem.2005.01.006 [DOI] [PubMed] [Google Scholar]
- Ueki K., Kondo T., Kahn C. R. (2004). Suppressor of cytokine signaling 1 (socs-1) and socs-3 cause insulin resistance through inhibition of tyrosine phosphorylation of insulin receptor substrate proteins by discrete mechanisms. Mol. Cell. Biol. 24 5434–5446. 10.1128/MCB.24.12.5434-5446.2004 [DOI] [PMC free article] [PubMed] [Google Scholar]
- Vesterlund M., Zadjali F., Persson T., Nielsen M. L., Kessler B. M., Norstedt G., et al. (2011). The socs2 ubiquitin ligase complex regulates growth hormone receptor levels. PLoS One 6:e25358. 10.1371/journal.pone.0025358 [DOI] [PMC free article] [PubMed] [Google Scholar]
- Vijayakumar A., Wu Y., Sun H., Li X., Jeddy Z., Liu C., et al. (2011). Targeted loss of ghr signaling in mouse skeletal muscle protects against high-fat diet-induced metabolic deterioration. Diabetes Metab. Res. Rev. 61 94–103. 10.2337/db11-0814 [DOI] [PMC free article] [PubMed] [Google Scholar]
- Wallace M., Metallo C. M. (2020). Tracing insights into de novo lipogenesis in liver and adipose tissues. Semin. Cell Dev. Biol. 108 65–71. 10.1016/j.semcdb.2020.02.012 [DOI] [PubMed] [Google Scholar]
- Wang Z., Wang L., Zhang Z., Feng L., Song X., Wu J. (2019). Apolipoprotein a-iv involves in glucose and lipid metabolism of rat. Nutr. Metab. 16:41. 10.1186/s12986-019-0367-2 [DOI] [PMC free article] [PubMed] [Google Scholar]
- Xu D., Wang Z., Xia Y., Shao F., Xia W., Wei Y., et al. (2020). The gluconeogenic enzyme pck1 phosphorylates insig1/2 for lipogenesis. Nature 580 530–535. 10.1038/s41586-020-2183-2 [DOI] [PubMed] [Google Scholar]
- Yang H. L., Sun C., Sun C., Qi R. L. (2012). Effect of suppressor of cytokine signaling 2 (socs2) on fat metabolism induced by growth hormone (gh) in porcine primary adipocyte. Mol. Biol. Rep. 39 9113–9122. 10.1007/s11033-012-1783-9 [DOI] [PubMed] [Google Scholar]
- Ye Y., Lin S., Mu H., Tang X., Ou Y., Chen J., et al. (2014). Analysis of differentially expressed genes and signaling pathways related to intramuscular fat deposition in skeletal muscle of sex-linked dwarf chickens. Biomed. Res. Int. 2014 1–7. 10.1155/2014/724274 [DOI] [PMC free article] [PubMed] [Google Scholar]
- Yoshimura A., Naka T., Kubo M. (2007). Socs proteins, cytokine signalling and immune regulation. Nat. Rev. Immunol. 7 454–465. 10.1038/nri2093 [DOI] [PubMed] [Google Scholar]
- Zadjali F., Santana-Farre R., Vesterlund M., Carow B., Mirecki-Garrido M., Hernandez-Hernandez I., et al. (2012). Socs2 deletion protects against hepatic steatosis but worsens insulin resistance in high-fat-diet-fed mice. FASEB J. 26 3282–3291. 10.1096/fj.12-205583 [DOI] [PubMed] [Google Scholar]
- Zhang T., Zhang X., Han K., Zhang G., Wang J., Xie K., et al. (2017). Genome-wide analysis of lncrna and mrna expression during differentiation of abdominal preadipocytes in the chicken. Genes Genomes Genet. 7 953–966. 10.1534/g3.116.037069 [DOI] [PMC free article] [PubMed] [Google Scholar]
- Zhang X. Y., Wu M. Q., Wang S. Z., Zhang H., Du Z. Q., Li Y. M., et al. (2018). Genetic selection on abdominal fat content alters the reproductive performance of broilers. Animal 12 1232–1241. 10.1017/S1751731117002658 [DOI] [PubMed] [Google Scholar]
- Zhou L., Xu L., Ye J., Li D., Wang W., Li X., et al. (2012). Cidea promotes hepatic steatosis by sensing dietary fatty acids. Hepatology 56 95–107. 10.1002/hep.25611 [DOI] [PubMed] [Google Scholar]
- Zhou Y., Zhou B., Pache L., Chang M., Khodabakhshi A. H., Tanaseichuk O., et al. (2019). Metascape provides a biologist-oriented resource for the analysis of systems-level datasets. Nat. Commun. 10:1523. 10.1038/s41467-019-09234-6 [DOI] [PMC free article] [PubMed] [Google Scholar]
Associated Data
This section collects any data citations, data availability statements, or supplementary materials included in this article.
Supplementary Materials
The specific primers used for plasmid construction and qRT-PCR.
The genes list of scatter plot of differentially expressed genes (DEGs) between ND and NN chicken in the liver.
The genes list of scatter plot of DEGs between HD and HN chicken in the liver.
The distribution of DEGs between ND-vs-NN and HD-vs-HN in the liver.
The genes list of scatter plot of DEGs between ND and NN chicken in the fat.
The genes list of scatter plot of DEGs between HD and HN chicken in the fat.
The distribution of DEGs between ND-vs-NN and HD-vs-HN in the fat.
The distribution of DEGs between HD-vs-ND and HN-vs-NN in the liver.
The distribution of DEGs between HD-vs-ND and HN-vs-NN in the fat.
The distribution of DEGs among the four treatment groups.
Data Availability Statement
The datasets presented in this study can be found in online repositories. The names of the repository/repositories and accession number(s) can be found in the article/Supplementary Material.