Abstract
Objectives:
To evaluate the diagnostic performance of waist to height ratio (WHtR) to screen for cardiovascular risk factors (CVRF) and metabolic syndrome (MetS) among Saudis.
Methods:
Between June 2013 and August 2014, a cross-sectional study of 3,063 adult Saudis of both genders from King Khalid Hospital, Riyadh, Saudi Arabia was conducted. Using the “WHO STEPwise Surveillance-Instrument V2.1”, which uses sequential steps including questionnaires and anthropometric and biochemical measurements of MetS and CVRF. Waist to height ratio validity in defining central obesity, MetS, and CVRF were tested using receiver operating characteristic curve (ROC), sensitivity, specificity, positive and negative predictive values, and accuracy. Using multivariate regression analyses for adjustment of confounders as age and gender were applied to compute adjusted odds ratios (aOR).
Results:
The diagnostic potential of WHtR was excellent for central obesity (area under the curve [AUC] = 0.98), and MetS (AUCs = 0.86); it was good for CVRF ≥2 (AUCs = 0.79) and was satisfactory for dyslipidemia (AUCs = 0.66). The sensitivities and negative predictive values exceeded 85% for diagnosing central obesity, diabetes, and hypertension. Adjusted odds ratios for age and gender showed that WHtR ≥0.50 significantly increased the risk of diabetes, hypertension, and ≥2 CVRF by almost 4-fold, and increased the risk of dyslipidemia by 2-fold.
Conclusion:
Waist height ratio showed a good diagnostic performance for CVRF and MetS among Saudis. Furthermore, WHtR ≥0.5 increased the risk of dyslipidemia, diabetes mellitus and hypertension.
Keywords: waist to height ratio, metabolic syndrome, cardiovascular risk, Saudi Arabia
Central obesity has been recognized as a significant risk factor of cardiovascular diseases (CVD); it is substantially associated with individual cardiovascular risk factors (CVRF), as hypertension, dyslipidemia, and diabetes.1 The pathogenesis of CVD is believed to be linked to central obesity and increase adiposity of the body through inducing insulin-resistance and other inflammatory mediators. This pathological effect of central obesity can induce these changes even among population with normal weight.2,3 Measurement of visceral obesity is best estimated by computed tomorgraphy (CT); however, although considered to be the “gold standard”, it requires exposure to ionizing radiation and is highly expensive. On the contrary, anthropometric proxies can be obtained simply and a growing evidence of their diagnostic performance encouraged clinicians to use them to avoid exposing their patients to CT hazards.4
Analyses to verify the performance of each anthropometric index as a CVD risks screening tool in adults showed that waist-to-height ratio (WHtR) is consistently better than waist circumference (WC) or body mass index (BMI). In 2008, a meta-analysis including 88,000 participants from different populations supported the evidence that WHtR is a promising tool in discriminating CVD risks related to central obesity.5 This evidence was ascertained in 2012 by another meta-analysis that included 31 studies and involved 300,000 adults from different ethnic groups. Authors of this study applied a robust statistical analysis and further verified the value of WHtR to screen for CVD risks.3 In 2016, Ashwell et al6 concluded that the use of WHtR classifies people at ‘early health risk’ more effectively than using BMI and WC or even using a matrix of both BMI and WC.
Waist-to-height ratio was originally proposed as an index of central obesity, with a boundary value of 0.5 effectively discriminating obese and non-obese individuals. This value is globally accepted, as revealed in previous research from various population and in a meta-analysis. Hence, WHtR was considered as a simple and a low-cost primary screening tool to screen for health risks. Furthermore, the unified cutoff value of WHtR was globally translated to a simple slogan “keep your waist circumference to less than half your height”.7
Metabolic syndrome (MetS) is a cluster of conditions that increases CVD risks; the dilemma of which index that best discriminates MetS has been verified in a large Chinese study that evaluated the anthropometric and atherogenic indices. The study concluded that in men, WHtR superseded all the indices as it has the greatest area under the curve (AUC), but in women, the triglycerides/high-density lipoprotein-c had the largest AUC of 0.815, whereas the AUC of WHtR was slightly attenuated (0.780). Nevertheless, the sensitivity of WHtR was the highest for both genders.8
In the recent decades, Saudi Arabia (SA) has witnessed drastic lifestyle changes towards unhealthy dietary habits and a sedentary lifestyle. This seemed to have driven the obesity epidemic in SA; currently SA has one of the most alarming prevalence of obesity in the world. Consequently, MetS, diabetes, and CVD have become major challenges faced by health authorities in the Kingdom.9
Despite the high prevalence of diabetes and other cardiometabolic risks among Saudis, studies in KSA that investigated various obesity indices and its relation to CVD risks are scarce, and they rarely reported the diagnostic performance of WHtR in cardiovascular or metabolic risks.10-12
Therefore, this study aimed to explore the diagnostic performance of WHtR to predict MetS and various CVRF including central obesity, diabetes, hypertension, and dyslipidemia among adult Saudis.
Methods
This cross-sectional study is a sub-cohort analysis from the Heart Health Promotion (HHP) Study conducted in Riyadh, the capital city of Saudi Arabia, during the period from 2013 to 2014, which included employees with some of their family members at King Saud University. The HHP study prospectively recruited 4,500 Saudi and non-Saudi participants.13
This study reports results among 3,063 Saudi participants, including 1,907 (62%) women and 1,156 (38%) men. Considering prevalence of obesity as of 25% ± 5% (p<0.01), a power of >0.9 was calculated using STATA/IC14.2.
After approval from the Institutional Review Board (IRB) at King Saud University (reference number 13-3721), the study was conducted according to the guidelines of Helsinki Declaration. Informed consent were signed from all participants. The cohort profile was published in 2016.13 We collected data using the “WHO STEPwise approach to chronic disease risk factor surveillance-instrument V2.1” the instrument uses serial steps which assess self-reported variable, anthropometric measurements , and biochemical measurements.14
A flexible non-stretchable plastic tape was used to measure height and waist circumference (in centimeter). General obesity was considered if BMI ≥30 kg/m2,15 while, central obesity was labeled if WC ≥102 cm in males and 88 cm in females.16
Participants were asked to fast for at least 12 hours before collecting blood samples. The biochemical measurements in this study included: glycosylated hemoglobin (HbA1c), high-density lipoprotein cholesterol (HDL-C), low-density lipoprotein cholesterol (LDL-C), total cholesterol (TC), and triglycerides (TGs).
Hypertension was classified following the seventh report of the Joint National Committee on Prevention, Detection, Evaluation, and Treatment of High Blood Pressure (JNC7).16 However, participants were also deemed hypertensive if they self-reported current use of any antihypertensive medications irrespective of their blood pressure readings.
Diabetes mellitus was defined in accordance with the World Health Organization (WHO) and American Diabetes Association criteria (HbA1c level was ≥6.5%), or by self-reporting of previous diagnosis of diabetes and use of antidiabetic medications.17
Participants were considered as having dyslipidemia according to the WHO and the Third Adult Treatment Panel (ATP-III) of the National Cholesterol Education Program (NCEP). Dyslipidemia was defined as high level of TC, LDL-C, or TGs, and low level of HDL-C. A subject was also considered as having dyslipidemia if using blood lipid lowering medication.18
Participants were identified as having metabolic syndrome (MetS), if they had at least 3 out of the 5 factors described in the NCEP-ATPIII criteria.18
Statistical analysis
We analyzed data using SPSS version 18.0 (SPSS Inc., Chicago, IL, USA). Quantitative variables were expressed as means and standard deviation (SD), whereas categorical variables were expressed as frequency and proportions.
The validity of WHtR in defining obesity, central obesity, diabetes, hypertension, dyslipidemia, MetS, and cardiovascular risk factors (CVRF) ≥2 was tested using receiver operating characteristic curve (ROC). Statistical significance of the ROC curve was determined using an AUC. The performance of the WHtR to detect cardiovascular risk factors was assessed by computing AUC. Area under the curve ≥0.9 indicates excellent discriminating power; AUCs of 0.8-0.89 and 0.7-0.79 indicate very good and good discriminating powers, respectively; and AUC ≤0.5 indicates that the discriminatory power is unacceptable.
The positive predictive value (PPV), negative predictive value (NPV), and accuracy were calculated. Positive predictive value is the probability of a patient having the disease when the test is positive; NPV is the probability of a patient not having the disease when the test is negative; accuracy is the overall probability that the patient will be correctly classified.
Odds ratio and 95% confidence intervals (CI) were calculated by multivariate logistic regression analyses in models where different cardiovascular risks were considered as binary dependent outcomes and WHtR was considered an independent factor with adjustment for age and gender.
Results
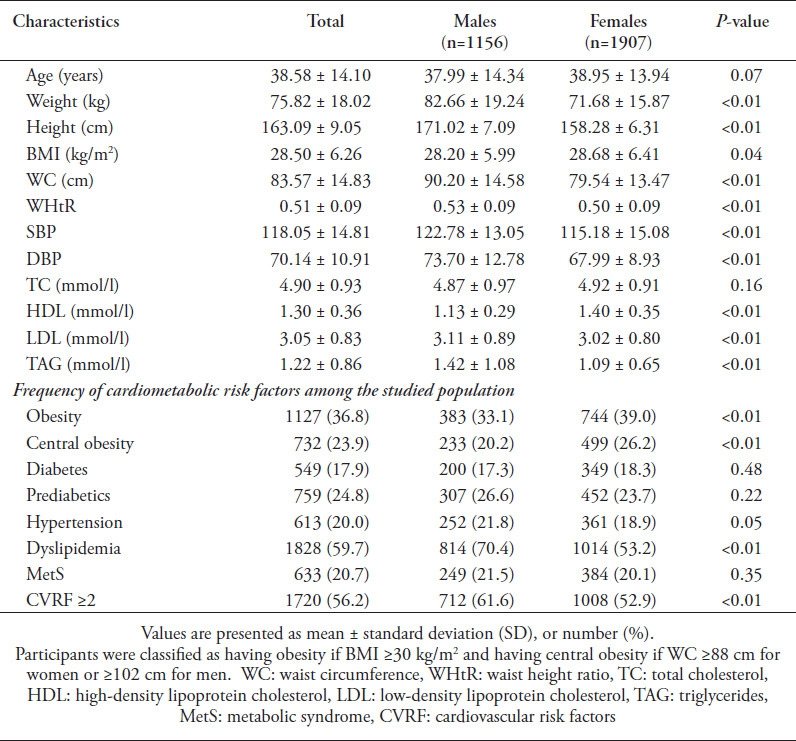
This study included 3,063 Saudi employees and their families, the majority of whom were women (62%). The mean age of this cohort was 38.58 ±14.10 years. The men were younger than the women, but showed significantly higher prevalence of dyslipidemia (70.4%) and CVRF ≥2 (61.6%) than women (53.2% and 52.9%, respectively). The prevalence of diabetes was comparable in both genders, with women showing higher likeliness to have general and central obesity. The other clinical characteristics and frequencies of cardiometabolic risk factors are shown in Table 1.
Table 1.
Clinical characteristics and frequencies of cardiometabolic risk factors among the studied population.

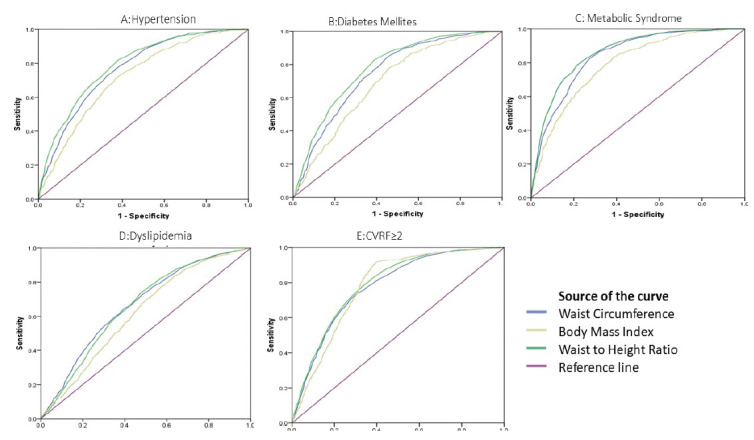
Receiver operating characteristic curves were constructed to measure the discriminative ability of WHtR to predict CVRF, such as diabetes, hypertension, dyslipidemia, CVRF ≥2, and MetS (Figure 1).
Figure 1.

Performance of different anthropometric indices in identifying A) hypertension, B) diabetes mellitus, C) MetS, D) dislipidemia, and E) CVRF ≥2.
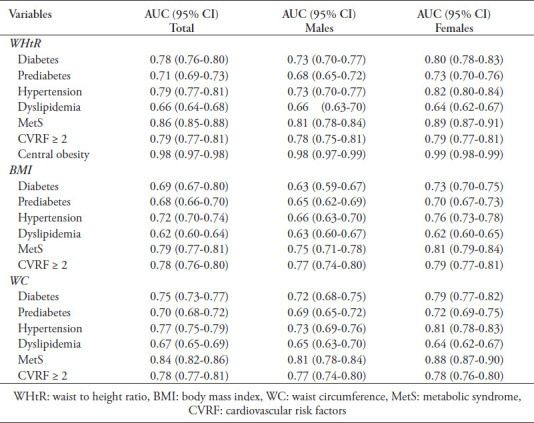
Table 2 compares WHtR performance with BMI and WC among the total study population and between genders. The AUC differed significantly from the AUC value of 0.5 (p<0.01) for all risk factors and in both genders. Among women, WHtR showed the strongest relationship with MetS (AUC 0.89, CI 0.87-0.91) and the weakest with dyslipidemia (AUC 0.64, CI 0.62-0.67). Likewise, among male participants, WHtR showed the highest discriminating ability in MetS (AUC 0.81, CI 0.78-0.84) and the lowest in dyslipidemia (AUC 0.66, CI 0.63-0.66).
Table 2.
Area under the curve (AUC) of WHtR, BMI, and WC in relation to different CVRF.

Waist-to-height ratio performance surpassed that of BMI in nearly all CVRF especially diabetes, prediabetes and MetS, whilst, it showed a comparable performance with WC even in defining MetS. Waist to height ratio showed very high agreement with WC in defining central obesity among males and females with AUC of 0.98 (0.97-0.98) reflecting its high discriminative power.
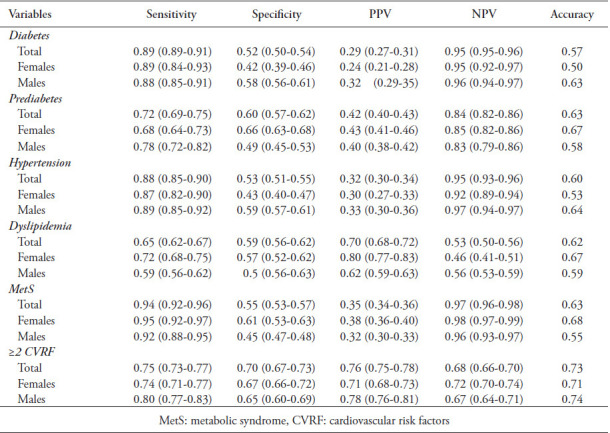
confirms the superiority of WHtR compared to BMI and WC. Table 3 shows the diagnostic performance of WHtR ≥0.50 for CVRF and MetS. The sensitivity ranged from 0.72 to 0.99 among women and 0.59 to 0.91 among men. The specificity ranged between 0.42-0.55 for women and 0.58-0.75 for men. Additionally, all sensitivities and NPV exceeded 85% for diagnosing diabetes, MetS and hypertension that reflect the high ability to rule-out these risk factors when the result is negative.
Table 3.
Sensitivity, specificity, positive predictive value (PPV), negative predictive value (NPV), and accuracy of waist to height ratio (WHtR) for CVRF.

Prediction of CVRF after adjusting for the confounder effects of age and gender was conducted using logistic regression models, using WHtR ≥0.50, BMI ≥30, and WC ≥88 cm for women or ≥102 cm for men. Waist to height ratio ≥0.50 significantly increased the risk of having diabetes, hypertension, and CVRF ≥2 by nearly 4-fold, as well as increased the risk of developing dyslipidemia by 2-fold. The capability of WHtR to predict CVRF corresponded to BMI and WC abilities, as shown in Table 4.
Table 4.
Adjusted odds ratios for cardiovascular risk factors adjusted for age and gender according to WHtR, BMI, and WC.

Discussion
This study confirmed the strong diagnostic performance of WHtR in predicting CVRF including central obesity, diabetes, hypertension, dyslipidemia, and MetS among the adult Saudi population. The globally accepted cutoff value of 0.5 possessed a good discriminating power among this group of Saudis who were at the age of increased risk of CVD. In the current study, WHtR was superior to BMI and WC in discriminating participants with different CVRF. Waist to height ratio is considered one of the best indicators for CVRF not only because of its superiority to BMI and other indices such as WC but also owing to its inexpensive nature and great ease of use. Waist to height ratio also allowed adjustment of WC by stature in both genders and in among various ethnic and age groups, resulting in little variations among various populations.19 Our findings showed that WHtR was able to discriminate diabetic patients from those with central obesity more precisely than BMI, as revealed by ROC curves and regression models. Waist to height ratio is believed to correlate strongly with central obesity and, consequently, with visceral fat, which produces diabetogenic substances, and with insulin resistance, which correlates with type 2 diabetes and impaired glucose tolerance. Additionally, WHtR was proved superior to BMI in predicting adiposity and central fat distribution in many studies of different ethnic backgrounds.20,21 In a large Chinese survey,22 the association of WHtR with undiagnosed patients with type 2 diabetes and even in prediabetics was stronger than that of BMI and WC in males, while the associations of WHtR and WC were stronger than those of BMI in females. The researchers added that WHtR ratio had the greatest AUCs in men and women. These findings support the current results and extended the effectiveness of WHtR to predict prediabetic conditions that are mostly undiagnosed and ignored. Many studies have tried to correlate different obesity indices with hypertension. In the current study, WHtR was more powerful than BMI in defining hypertensive patients. This finding agrees with those of many studies from Jordan,23 Nigeria,24 Iran,25 and China.26 Moreover, WHtR discriminates both hypertensive and hypotensive individuals of both genders in a Korean study.27 Diagnosis of dyslipidemia requires evaluation of HDL-C, TGs, and LDL-C, which is considered costly and unaffordable for screening a considerable number of healthy individuals. In this study, WHtR was satisfactory in discriminating patients with dyslipidemia, especially among women.28 These findings agree with other studies that recommended WHtR as an inexpensive tool for predicting dyslipidemia.29,30 Nevertheless, lipid profile may be high even in slim people; thus, caution should be paid not to rule out screening for dyslipidemia. Waist to height ratio has recently been regarded as a novel screening tool to predict cardiometabolic risk factors and Mets. In this study, WHtR showed excellent discrimination of MetS (AUC = 0.86, CI = 0.85-0.88) and appreciable sensitivity and NPV that support the growing evidence of the advantageous use of WHtR for MetS screening. The ability of WHtR to predict MetS was intensively studied in cross-sectional and cohort studies; however, recently a prospective study among Spanish workers that examined the incidence of MetS over an approximately 9 years, added to the value of these studies and extended the usability of WHtR to other screening settings as occupational nursing clinics.19 The current study showed that the risk of having 2 or more CVRF among those whose WHtR exceeded 0.5 was nearly 4-times higher than that among those with lower WHtR. This finding showed the strong predictive power of WHtR in predicting single and multiple risk factors even after adjustment for age and gender. In 2017, a cross-sectional study of more than 26,000 middle-aged Chinese men tested the correlation between WHtR and WC with different indicators of cardiac health.29 The researchers concluded that cardiovascular health score correlated strongly with WHtR, even stronger than with WC, and recommended the use of WHtR to screen populations at elevated risk for central obesity and CVDs. Additionally, a prospective cohort study in Germany that included 6670 males and 6637 females showed that WHtR appears to be a valid as risk predictor for CVD mortality in males but not females.31
Study limitations
One limitation of the current study was the cross-sectional design, that is known for several drawbacks. The other limitation was the non-random selection. In addition, as participants are employees and family members of one of the largest organizations in Saudi Arabia rather than representatives of the general population, the findings cannot be generalized to the entire population. Nevertheless, the completed documentations of all participants, along with the large sample size and their diverse socioeconomic backgrounds, could attenuate these limitations.
In conclusion, WHtR showed a good diagnostic performance in discriminating MetS and single and multiple CVRF, including central obesity, diabetes, hypertension, and dyslipidemia, among adult Saudis. The globally accepted cutoff point of 0.5, which can be easily applied for both genders, worked perfectly among Saudi women and men. Considering its non-invasive, ease of measurement, and low-cost methodology, we highly recommend WHtR as a tool for population-based screening for the prevention and management of CVRF.
Acknowledgment
We convey our gratitude to all participants in this study, who had offered their time to complete the clinical and laboratory assessments as required. We extend our gratitude to Editage by Cactus for proof editing the final manuscript.
Footnotes
References
- 1.Lam BC, Koh GC, Chen C, Wong MT, Fallows SJ. Comparison of body mass index (BMI), body adiposity index (BAI), waist circumference (WC), waist-to-hip ratio (WHR) and waist-to-height ratio (WHtR) as predictors of cardiovascular disease risk factors in an adult population in Singapore. PloS One. 2015;10:e0122985. doi: 10.1371/journal.pone.0122985. [DOI] [PMC free article] [PubMed] [Google Scholar]
- 2.Owolabi EO, Ter Goon D, Adeniyi OV. Central obesity and normal-weight central obesity among adults attending healthcare facilities in Buffalo City Metropolitan Municipality, South Africa:a cross-sectional study. J Health Popul Nutr. 2017;36:54. doi: 10.1186/s41043-017-0133-x. [DOI] [PMC free article] [PubMed] [Google Scholar]
- 3.Ashwell M, Gunn P, Gibson S. Waist-to-height ratio is a better screening tool than waist circumference and BMI for adult cardiometabolic risk factors:systematic review and meta-analysis. Obes Rev. 2012;13:275–286. doi: 10.1111/j.1467-789X.2011.00952.x. [DOI] [PubMed] [Google Scholar]
- 4.Irlbeck T, Janitza S, Poros B, Golebiewski M, Frey L, Paprottka PM, et al. Quantification of adipose tissue and muscle mass based on computed tomography scans:Comparison of eight planimetric and diametric techniques including a step-by-step guide. Eur Surg Res. 2018;59:23–34. doi: 10.1159/000486173. [DOI] [PubMed] [Google Scholar]
- 5.Lee CM, Huxley RR, Wildman RP, Woodward M. Indices of abdominal obesity are better discriminators of cardiovascular risk factors than BMI:a meta-analysis. J Clin Epidemiol. 2008;61:646–653. doi: 10.1016/j.jclinepi.2007.08.012. [DOI] [PubMed] [Google Scholar]
- 6.Ashwell M, Gibson S. Waist-to-height ratio as an indicator of 'early health risk':simpler and more predictive than using a 'matrix'based on BMI and waist circumference. BMJ Open. 2016;6:e010159. doi: 10.1136/bmjopen-2015-010159. [DOI] [PMC free article] [PubMed] [Google Scholar]
- 7.Ashwell M, Gibson S. A proposal for a primary screening tool:'Keep your waist circumference to less than half your height'. BMC Med. 2014;12:207. doi: 10.1186/s12916-014-0207-1. [DOI] [PMC free article] [PubMed] [Google Scholar]
- 8.Chen BD, Yang YN, Ma YT, Pan S, He CH, Liu F, et al. Waist-to-height ratio and triglycerides/high-density lipoprotein cholesterol were the optimal predictors of metabolic syndrome in uighur men and women in Xinjiang, China. Metab Syndr Relat Disord. 2015;13:214–220. doi: 10.1089/met.2014.0146. [DOI] [PubMed] [Google Scholar]
- 9.Boutayeb A, Boutayeb S. The burden of non communicable diseases in developing countries. Int J Equity Health. 2005;4:2. doi: 10.1186/1475-9276-4-2. [DOI] [PMC free article] [PubMed] [Google Scholar]
- 10.Al-Rubean K, Youssef AM, AlFarsi Y, Al-Sharqawi AH, Bawazeer N, AlOtaibi MT, et al. Anthropometric cutoff values for predicting metabolic syndrome in a Saudi community:from the SAUDI-DM study. Anna Saudi Med. 2017;37:21–30. doi: 10.5144/0256-4947.2017.21. [DOI] [PMC free article] [PubMed] [Google Scholar]
- 11.Al-Hazzaa HM, Abahussain NA, Al-Sobayel HI, Qahwaji DM, Alsulaiman NA, Musaiger AO. Prevalence of overweight, obesity, and abdominal obesity among urban Saudi adolescents:gender and regional variations. J Health Popul Nutr. 2014;32:634–645. [PMC free article] [PubMed] [Google Scholar]
- 12.Memish ZA, El Bcheraoui C, Tuffaha M, Robinson M, Daoud F, Jaber S, et al. Obesity and associated factors Kingdom of Saudi Arabia 2013. Prev chronic Dis. 2014;11:E174. doi: 10.5888/pcd11.140236. [DOI] [PMC free article] [PubMed] [Google Scholar]
- 13.Alzeidan R, Rabiee F, Mandil A, Hersi A, Fayed A. Non-communicable disease risk factors among employees and their families of a Saudi University:An epidemiological study. PLoS One. 2016;11:e0165036. doi: 10.1371/journal.pone.0165036. [DOI] [PMC free article] [PubMed] [Google Scholar]
- 14.World Health Organization. WHO STEPS Instrument (Core and Expanded) Geneva (SW): World Health Organization; 2018. Available from: https://www.who.int/ncds/surveillance/steps/STEPS_Instrument_v2.1.pdf . [Google Scholar]
- 15.World Health Organization. Global database on body mass index (BMI) >Geneva (SW): World Health Organization; 2018. Available from: https://www.who.int/nutrition/databases/bmi/en/ [Google Scholar]
- 16.Sherling DH, Perumareddi P, Hennekens CH. Metabolic Syndrome. J Cardiovasc Pharmacol Ther. 2017;22:365–367. doi: 10.1177/1074248416686187. [DOI] [PubMed] [Google Scholar]
- 17.World Health Organization. Use of glycated haemoglobin (HbA1c) in the diagnosis of diabetes mellitus. Geneva (SW): World Health Organization; 2011. Available from: https://www.who.int/diabetes/publications/report-hba1c_ 2011.pdf . [Google Scholar]
- 18.Third Report of the National Cholesterol Education Program (NCEP) Expert Panel on Detection, Evaluation, and Treatment of High Blood Cholesterol in Adults (Adult Treatment Panel III) final report. Circulation. 2002;106:3143–3421. [PubMed] [Google Scholar]
- 19.Romero-Saldaña M, Fuentes-Jiménez FJ, Vaquero-Abellán M, Álvarez-Fernández C, Aguilera-López MD, Molina-Recio G. Predictive capacity and cutoff value of waist-to-height ratio in the incidence of metabolic syndrome. Clin Nurs Res. 2019;28:676–691. doi: 10.1177/1054773817740533. [DOI] [PubMed] [Google Scholar]
- 20.Hardy DS, Stallings DT, Garvin JT, Gachupin FC, Xu H, Racette SB. Anthropometric discriminators of type 2 diabetes among White and Black American adults. J Diabetes. 2017;9:296–307. doi: 10.1111/1753-0407.12416. [DOI] [PMC free article] [PubMed] [Google Scholar]
- 21.Son YJ, Kim J, Park HJ, Park SE, Park CY, Lee WY, et al. Association of Waist-Height Ratio with Diabetes Risk:A 4-Year Longitudinal Retrospective Study. Endocrinol Metab (Seoul) 2016;31:127–133. doi: 10.3803/EnM.2016.31.1.127. [DOI] [PMC free article] [PubMed] [Google Scholar]
- 22.Zhang F, Wan Q, Cao H, Tang L, Li D, Lü Q, et al. Identical anthropometric characteristics of impaired fasting glucose combined with impaired glucose tolerance and newly diagnosed type 2 diabetes:anthropometric indicators to predict hyperglycaemia in a community-based prospective cohort study in southwest China. BMJ Open. 2018;8:e019735. doi: 10.1136/bmjopen-2017-019735. [DOI] [PMC free article] [PubMed] [Google Scholar]
- 23.Khader Y, Batieha A, Jaddou H, El-Khateeb M, Ajlouni K. The performance of anthropometric measures to predict diabetes mellitus and hypertension among adults in Jordan. BMC Public Health. 2019;19:1416. doi: 10.1186/s12889-019-7801-2. [DOI] [PMC free article] [PubMed] [Google Scholar]
- 24.Ononamadu CJ, Ezekwesili CN, Onyeukwu OF, Umeoguaju UF, Ezeigwe OC, Ihegboro GO. Comparative analysis of anthropometric indices of obesity as correlates and potential predictors of risk for hypertension and prehypertension in a population in Nigeria. Cardiovasc J Afr. 2017;28:92–99. doi: 10.5830/CVJA-2016-061. [DOI] [PMC free article] [PubMed] [Google Scholar]
- 25.Janghorbani M, Aminorroaya A, Amini M. Comparison of different obesity indices for predicting incident hypertension. High Blood Press Cardiovasc Prev. 2017;24:157–166. doi: 10.1007/s40292-017-0186-3. [DOI] [PubMed] [Google Scholar]
- 26.Zeng Q, He Y, Dong S, Zhao X, Chen Z, Song Z, et al. Optimal cut-off values of BMI, waist circumference and waist:height ratio for defining obesity in Chinese adults. Br J Nutr. 2014;112:1735–1744. doi: 10.1017/S0007114514002657. [DOI] [PubMed] [Google Scholar]
- 27.Lee BJ, Kim JY. A comparison of the predictive power of anthropometric indices for hypertension and hypotension risk. PloS One. 2014;9:e84897. doi: 10.1371/journal.pone.0084897. [DOI] [PMC free article] [PubMed] [Google Scholar]
- 28.Kazlauskaite R, Avery-Mamer EF, Li H, Chataut CP, Janssen I, Powell LH, et al. Race/ethnic comparisons of waist-to-height ratio for cardiometabolic screening:the study of women's health across the nation. Am J Hum Biol. 2017;29:22909. doi: 10.1002/ajhb.22909. [DOI] [PMC free article] [PubMed] [Google Scholar]
- 29.Shen S, Lu Y, Qi H, Li F, Shen Z, Wu L, et al. Waist-to-height ratio is an effective indicator for comprehensive cardiovascular health. Sci Rep. 2017;7:43046. doi: 10.1038/srep43046. [DOI] [PMC free article] [PubMed] [Google Scholar]
- 30.Corrêa MM, Thumé E, De Oliveira ER, Tomasi E. Performance of the waist-to-height ratio in identifying obesity and predicting non-communicable diseases in the elderly population:A systematic literature review. Arch Gerontol Geriatr. 2016;65:174–182. doi: 10.1016/j.archger.2016.03.021. [DOI] [PubMed] [Google Scholar]
- 31.Rost S, Freuer D, Peters A, Thorand B, Holle R, Linseisen J, et al. New indexes of body fat distribution and sex-specific risk of total and cause-specific mortality:a prospective cohort study. BMC Public Health. 2018;18:427. doi: 10.1186/s12889-018-5350-8. [DOI] [PMC free article] [PubMed] [Google Scholar]


