Abstract
Objectives:
To assess the knowledge, attitudes, and practices of adults regarding the implementation of calorie labeling in restaurants in Riyadh, Saudi Arabia.
Methods:
This was a cross-sectional study of 1443 adults invited to complete a self-administered questionnaire consisting of 4 parts that assess demographics, knowledge, attitudes, and practices of mandatory menu labeling. The survey was conducted in all 5 regions of Riyadh.
Results:
We entered 1265 surveys into final data analysis with a response rate of 88%. Of this, 1036 participants (82%) understood the meaning and values of calories, while 53% knew the average daily caloric intake. Regarding participants’ attitudes, 1053 (83%) perceived the importance of calorie labeling and (88%) supported this policy. Approximately 50% (n=626) of the participants were significantly more likely to be influenced by the calorie labeling to place a healthier order. Married (p=0.050), educated (p<0.001), and higher monthly income (p<0.001) were significantly influenced to place a healthier restaurant order compared to their peers.
Conclusion:
Adults in Riyadh showed satisfactory knowledge, attitude, and practice since the implementation of this policy. Our findings showed that knowing the value of calories and average caloric intake had a significant positive influence for a healthier diet. This highlights the importance of menu labeling regulations campaigns for the public.
Keywords: calories, diet, menu, healthy, adult, restaurant, nutrition, labeling, food
Consuming a healthy diet throughout one’s life-course reduces the risk of obesity.1 Moreover, increased consumption of processed food and urbanization are changing the lifestyles of the population worldwide.1 People are now consuming higher caloric foods, which has led to an increase in the levels of obesity.1,2 Obesity has become a pandemic,2 with a prevalence of about 20% worldwide.3 Saudi Arabia is similarly experiencing an increase in the level of obesity,4 in which 7 out of 10 people are considered overweight or obese5,6 according to the World Health Organization’s classification of body mass index (BMI).7 Obesity is linked to serious debilitating preventable chronic diseases such as diabetes mellitus type 2, hypertension, dyslipidemia, and coronary artery disease.6,8,9 Obesity-related health issues are a major burden to the health of the individual and the health-care system worldwide.2,10,11
Changes in the culinary culture have resulted in an increase in consumption of food away from home around the world,12,13 that could be higher in calories.14 Calorie labeling has been suggested as an important approach to counter the rising levels of obesity.15 The general public are increasingly interested in watching their diet, and restaurants are being more transparent about ingredients and calories.16 Calorie labeling in restaurants and cafes is an important tool of this grand strategy to educate the general public about nutrition.17 This will provide consumers with informed knowledge that will help them make healthier dietary choices.18 Some evidence suggests that calorie labeling may influence restaurants and cafes to offer items that are lower in calories.17,19 Moreover, Brissete et al20 showed that promoting the use of calorie information and calorie awareness supports lower-calorie choices at fast food eateries.
A policy was introduced in the United States in 2010 in the Affordable Care Act about nutrition labeling of standard menu items in restaurants that have 20 branches or more.18 Similarly, the European Commission has amended the provision of food information to consumers requiring restaurants, fixed or mobile food stalls, canteens and hospitals to display calories and allergy information.21 As a part of Saudi Arabia’s vision of 2030 to promote a healthier lifestyle, the Saudi Food and Drug Administration implemented a law that took effect in December 2018 that mandates that the menus of all restaurants, cafés, ice cream shops, fresh juice shops, bakeries and supermarkets must provide calorie information to their consumers by displaying it on monitors and printed menus.22 The aim of this study is to assess the knowledge, attitudes, and practices of adults regarding the implementation of mandatory calorie labeling in restaurants and cafes in Riyadh the capital of Saudi Arabia with a population of approximately 7 million people as of 2018.23
Methods
After ethical approval was granted for this study by the Institutional Review Board of King Fahad Medical City, the researchers of this cross-sectional study approached 1443 participants at sit down restaurants with servers, fast food joints, cafeterias, and cafes from all 5 regions of Riyadh city (Northern, Southern, Eastern, Western, Central) at various hours of the day. Every single person was approached from pre-selected restaurants by researchers. The data were collected in July 2019. Participants were asked to voluntarily complete a self-administered, anonymous questionnaire that the researchers had developed and inspired from previous literature.24 The participants gave their consent by signing the consent form attached to the questionnaire.
Questionnaires were distributed and collected by trained medical students. Eligible participants had to be at least 18 years of age, eat in fast food or sit-down restaurants at least once weekly, able to read Arabic, and willing to participate. Saudi adults who were able read Arabic and not willing to participate were excluded.
Survey tool
The questionnaire consisted of 4 parts. The first part gathered the demographic data, including gender, age, marital status, nationality, education level, employment status, and monthly income.
The second part investigated knowledge of the new addition of caloric values on menus (Did you notice that there are calories displayed on menus), understanding of the caloric values (Do you understand the meaning and value of calories), and the average caloric intake (Do you know the average recommended daily caloric intake for adults). The third part explored the participants’ attitudes regarding the benefit of displaying the calorie values (In your opinion, is the calorie labeling on menus important to the consumer) and the support of mandatory calorie labeling (Do you support the new policy mandating that restaurants display calories on their menus). The last part inquired about the participants’ practices, asking if the new policy has influenced them and how (changing their order to a healthier one, reducing the size of their order, reducing the frequency at which they eat outside their homes, did not change). In the second, third, and last parts, the choices were all binary (yes, no) except for the questions about how the participants were influenced. Participants were asked to choose the answer that applies to them from the choices that were provided in the questionnaire. Knowledge, attitudes and practices were labeled as satisfactory if the 50% or more of the study participants answered “yes” regarding each categories respective questions.
Sample size estimate
The sampling frame included fast food chains that had restaurants sites in each 5 regions of Riyadh, in addition to sit-down restaurants with a server. Eligibility for restaurants was set based on each restaurant that had space suitable for data collection. Site visits and meetings with restaurant managers were carried out in advance to obtain the manager’s approval for data collection. A convenient sample of 80 restaurants was reviewed for eligibility; 12 sites (15%) were determined ineligible for unsuitable space for data collection. An additional 8 (10%) sites did not allow us to collect data on their premises thus, data collection took place in 60 restaurants (Central n=15, North n=14, East n=13, South n=11, West n=7). These restaurants were selected from each region of Riyadh proportional to the restaurant’s density.
The average prevalence of knowledge about recommended calorie intake in context to the study is 50%.20 We adjusted for adult population across all regions and considered the design effect (2.5) and incomplete and non-response rate of 20%; thus, sample size for the study is 1250 by using the online Raosoft sample calculator.
Data collection was accomplished using a self-administered questionnaire based on information obtained from the literature to assess the knowledge, attitudes and practices of Saudi adults about calorie labelling in Riyadh among the Saudi adult population. PubMed search was used to retrieve related literature from 2011 until current date.20
A pilot study was conducted on 20 Saudi adults from each region of Riyadh to evaluate that the questions were clear, and no questions were ambiguous ensuring face validity of the questionnaire. The reliability of the questionnaire was met as Cronbach’s alpha was 0.74 based on the pilot study.
Statistical analysis
All categorical variables such as gender, age, nationality are presented as numbers and percentages. Pearson’s Chi-square test was applied to determine statistical significance between categorical variables, except when cell sizes were less than 5 Fischer test was then applied. Logistic regression was performed to ascertain the effect (odd ratio) of the participants’ characteristics on the study outcomes. P-value of less than 0.05 was considered statistically significant. All data were entered and analyzed using the Statistical Package for Social Sciences Version 22 (Armonk, NY: IBM Corp).
Results
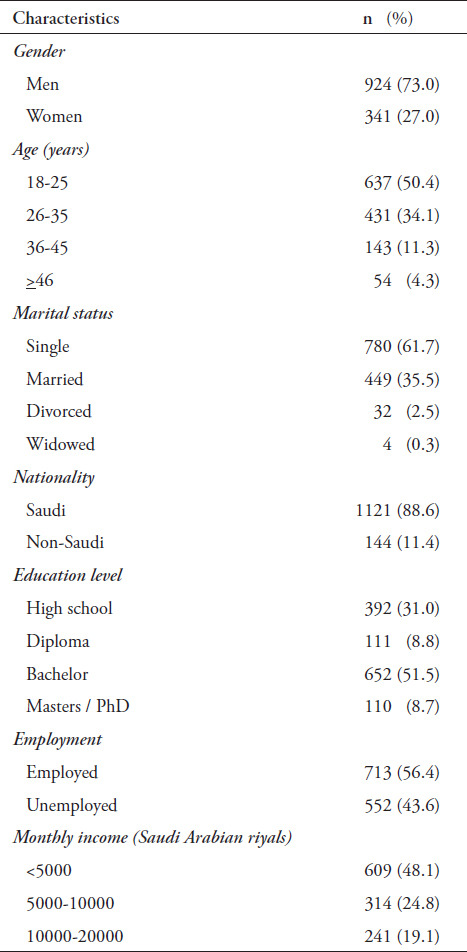
A total of 1265 participants successfully completed the self-administered questionnaire with a response rate of 88%. In all, 1121 (88.6%) were Saudis, 924 (73%) were men, and 780 (61.7%) were single. More than half were employed (n=713; 56.4%). In all, 652 (51.5%) had acquired a bachelor’s degree. Table 1 presents the demographic characteristics.
Table 1.
Demographic characteristics of 1265 successfully completed the self-administered questionnaire

Participants were more likely to eat at sit down restaurants (n=434, 34.4%) followed by fast food restaurants (n=380, 30%). Overall, 47.7% (n=603) of participants patronized restaurants 2 to 4 times per week, once a week 23.1% (n=292) 5 to 7 times a week 16.4% (n=207), and more than 7 times a week 12.9% (n=163).
Knowledge of participants about calories and menu labeling
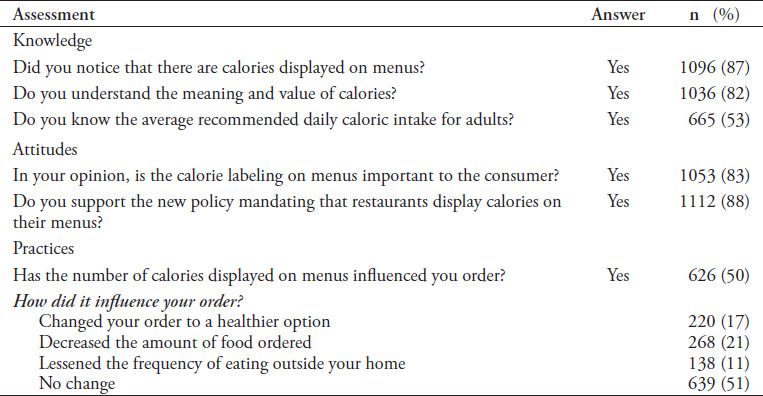
The majority of participants noticed that calories were displayed on menus (n=1096; 87%). Ultimately, 1036 (82%) of participants claimed to understand the meaning and value of calories. Moreover, half of the participants (n=665; 53%) claimed they knew the average daily caloric intake for healthy adults.
Attitudes of participants was achieved by the majority of participants believed that calorie labeling is important to the consumer (n=1053; 83%). Similarly, 1112 (88%) supported this new policy mandating that restaurants display calories on their menus. Practices of individuals was realized overall by that 50% of participants were influenced by the calorie labeling to choose healthier options, while the other half (n=639; 50%) claimed that the calories shown on menus have no effect on their food choices. Out of those who were influenced, 268 (21.2%) reduced the amount of food they ordered. Table 2 demonstrates knowledge, attitudes, and practices of the participants.
Table 2.
Assessment of knowledge, attitudes, and practices of participants.

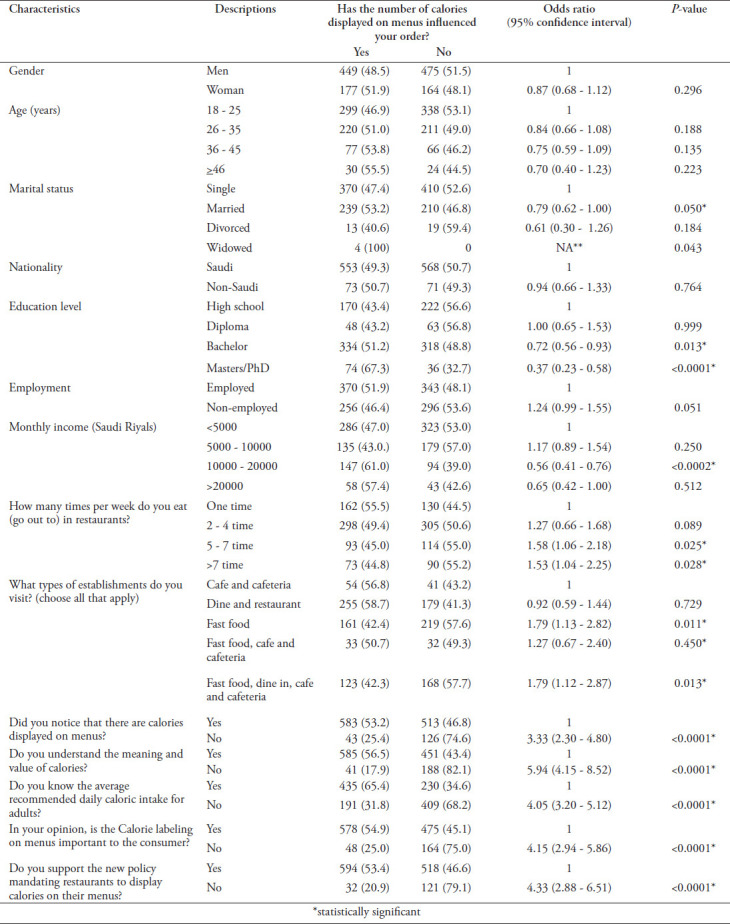
Univariate analysis between the influence of calories displayed on menu and study characteristics showed significance with marital status (p=0.005). In the educational levels, participants with a bachelor or master’s degree and above were influenced by the menu labeling into choosing a healthier option (p=0,013 and p<0.0001 respectively). Regarding monthly income, those with an income of more than 10000 Saudi Riyals were influenced more likely to change their order (p<0.0002). Participants who ate 5 or more times per week were less likely to be influenced (5-7 times per week p=0.0025, 7 or more times per week p=0.0028). Noticing the calories on menus, understanding calorie values, prior knowledge about recommended daily caloric intake, believing calorie labeling is important to the consumer, and supporting the newly passed policy could have been influenced to change their order in a positive way (p<0.0001) (Table 3).
Table 3.
A univariate analysis of the study characteristics regarding calories on menus.

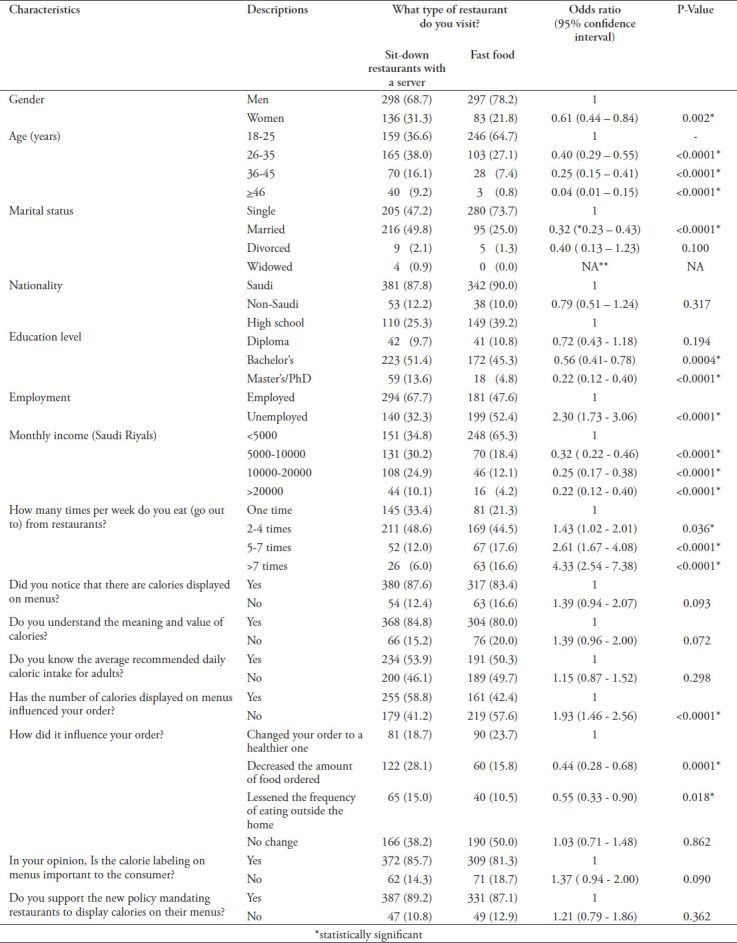
Women, aged 26 years old and above, married, hold at least a bachelor’s degree, employed, have monthly income of more than 5000 Saudi Riyals, eat out 2 to 4 times per week, and were influenced to order less food (p<0.001), were more likely to eat in sit down restaurants with servers as is shown in Table 4.
Table 4.
Association between type of restaurant and characteristics of study variables.

Participants who ate out 5 times or more per week, and were unemployed were more likely to eat at fast food restaurants and were less likely to be influenced by the calories displayed on menus (p<0.0001).
Discussion
This study found that the new policy of mandatory calorie labeling in restaurants and cafes introduced by the Saudi Food and Drug Administration has changed the behavior of 50% of the study participants to healthier choices in a short period of time. Participants who were married were more influenced to reduce their caloric intake than their counterparts. Also, those with a bachelor’s degree and above, higher income, or who ate at restaurants regularly were more likely to be influenced by the calories displayed on the menu. In contrast, those with high school degrees and those who were regular fast food patrons were less likely to change their eating habits. The main reason for this could be their lack of knowledge about the average daily intake of calories. Understanding of what calories are and other background information had no positive effect on their food-consuming behavior.
Our findings align with the results of Roseman et al16 in the southwest United States. They found that the addition of calories on the menus had a positive impact on the study participants.16 Moreover, the results of Vanderlee et al25 in Canada align with our findings, especially that the majority of participants noticed that calorie values were displayed on menus. Furthermore, the study conducted by Radwan et al26 in the United Arab Emirates uncovered similar results to ours in that most of the participants supported the policy of mandatory menu labeling.
In accordance with multiple previous studies, our study found that the changes in calories was more prominent in females than in males.27,28 In contrast, the results of a study conducted in the state of Washington in 2009 discovered no significant change in behavior.29 Furthermore, a study by Carnegie Mellon in 2016 found that the majority of participants did not change their habits after the calories were displayed on menus.30
We recommend increasing the awareness of calorie values and the average caloric intake as this study showed that participants with prior knowledge about calories were more likely to be influenced by calorie labeling mandated by the new Saudi policy. This is achievable by integrating it into the curriculums of schools and universities. Moreover, decreasing the amount of processed food and fast food that one ingests and increasing the consumption of fruits and vegetables is imperative for attaining a healthier population.1 This can be achieved by the Ministry of Health and health institutes launching awareness programs to educate the general public about calories and nutritional values. Furthermore, we suggest promoting restaurants and cafes that offer healthier dietary options while discouraging patronizing those that offer food items with high caloric values. Additionally, restaurants and cafes should be strictly monitored to ensure compliance with the new policy that mandates menu labeling. We recommend conducting the same study on a national scale.
Study limitations
Firstly, a convenient sampling technique was used to recruit study participants which could affect the generalizability of the data. Secondly, the choices for the questions that assess the practices had no negative (namely, changing their order to a higher calorie food option) options.
In conclusion, adults in Riyadh reported satisfactory knowledge, positive attitudes, and adequate practice in a short period of time since the implementations of this policy. Our findings showed that knowing the value of calories and average caloric intake had a positive effect on their dietary habits. This highlights the importance of educating the public about nutrition to guide them in making healthier choices.
Acknowledgment
We would like to thank Shehana Alqahtani and Bshayer Alqahtani for their valuable contributions in data collection along with the Cambridge proofreading LLC (https://proofreading.org) for their English language editing services.
Footnotes
References
- 1.World Health Organization. Healthy diet. [[2018 October 23;Accessed 2019 July 10]]. Available at https://www.who.int/news-room/fact-sheets/detail/healthy-diet .
- 2.Kelly T, Yang W, Chen CS, Reynolds K, He J. Global burden of obesity in 2005 and projections to 2030. Int J Obes (Lond) 2008;32:1431–1437. doi: 10.1038/ijo.2008.102. [DOI] [PubMed] [Google Scholar]
- 3.DeNicola E, Aburizaiza OS, Siddique A, Khwaja H, Carpenter DO. Obesity and public health in the Kingdom of Saudi Arabia. Rev Environ Health. 2015;30:191–205. doi: 10.1515/reveh-2015-0008. [DOI] [PubMed] [Google Scholar]
- 4.Khabaz MN, Bakarman MA, Baig M, Ghabrah TM, Gari MA, Butt NS, et al. Dietary habits, lifestyle pattern and obesity among young Saudi university students. J Pak Med Assoc. 2017;67:1541–1546. [PubMed] [Google Scholar]
- 5.Memish ZA, El Bcheraoui C, Tuffaha M, Robinson M, Daoud F, Jaber S, Mikhitarian S, Al Saeedi M, AlMazroa MA, Mokdad AH, Al Rabeeah AA. Peer reviewed:obesity and associated factors-Kingdom of Saudi Arabia 2013. Prev Chronic Dis. 2014;11:E174. doi: 10.5888/pcd11.140236. [DOI] [PMC free article] [PubMed] [Google Scholar]
- 6.>World Health Organization. Global report on diabetes. [cited 2016] Available from: http://apps.who.int/iris/bitstream/10665/204871/1/9789241565257 _eng.pdf?ua=1 .
- 7.World Health Organization. Facts sheet about obesity and overweight [cited 2018] https://www.who.int/news-room/fact-sheets/detail/obesity-and-overweight .
- 8.Nguyen NT, Magno CP, Lane KT, Hinojosa MW, Lane JS. Association of hypertension, diabetes, dyslipidemia, and metabolic syndrome with obesity:findings from the National Health and Nutrition Examination Survey, 1999 to 2004. J Am Coll Surg. 2008;207:928–934. doi: 10.1016/j.jamcollsurg.2008.08.022. [DOI] [PubMed] [Google Scholar]
- 9.Wang YC, McPherson K, Marsh T, Gortmaker SL, Brown M. Health and economic burden of the projected obesity trends in the USA and the UK. The Lancet. 2011;378:815–825. doi: 10.1016/S0140-6736(11)60814-3. [DOI] [PubMed] [Google Scholar]
- 10.Rtveladze K, Marsh T, Barquera S, Romero LM, Levy D, Melendez G, et al. Obesity prevalence in Mexico:impact on health and economic burden. Public Health Nutr. 2014;17:233–239. doi: 10.1017/S1368980013000086. [DOI] [PMC free article] [PubMed] [Google Scholar]
- 11.Withrow D, Alter DA. The economic burden of obesity worldwide:a systematic review of the direct costs of obesity. Obes Rev. 2011;12:131–141. doi: 10.1111/j.1467-789X.2009.00712.x. [DOI] [PubMed] [Google Scholar]
- 12.Nielsen SJ, Siega-Riz AM, Popkin BM. Trends in food locations and sources among adolescents and young adults. Prev Med. 2002;35:107–113. doi: 10.1006/pmed.2002.1037. [DOI] [PubMed] [Google Scholar]
- 13.Zhai FY, Du SF, Wang ZH, Zhang JG, Du WW, Popkin BM. Dynamics of the Chinese diet and the role of urbanicity 1991-2011. Obes Rev. 2014;15:16–26. doi: 10.1111/obr.12124. [DOI] [PMC free article] [PubMed] [Google Scholar]
- 14.Roos E, Sarlio-Lähteenkorva S, Lallukka T. Having lunch at a staff canteen is associated with recommended food habits. Public Health Nutr. 2004;7:53–61. doi: 10.1079/phn2003511. [DOI] [PubMed] [Google Scholar]
- 15.Burton S, Creyer EH, Kees J, Huggins K. Attacking the obesity epidemic:the potential health benefits of providing nutrition information in restaurants. Am J Public Health. 2006;96:1669–1675. doi: 10.2105/AJPH.2004.054973. [DOI] [PMC free article] [PubMed] [Google Scholar]
- 16.Roseman MG, Joung HW, Choi EK, Kim HS. The effects of restaurant nutrition menu labelling on college students'healthy eating behaviours. Public Health Nutr. 2017;20:797–804. doi: 10.1017/S1368980016002871. [DOI] [PMC free article] [PubMed] [Google Scholar]
- 17.VanEpps EM, Roberto CA, Park S, Economos CD, Bleich SN. Restaurant menu labeling policy:review of evidence and controversies. Curr Obes Rep. 2016;5:72–80. doi: 10.1007/s13679-016-0193-z. [DOI] [PMC free article] [PubMed] [Google Scholar]
- 18.Food and Drug Administration. Food labeling;nutrition labeling of standard menu items in restaurants and similar retail food establishments. Federal Register. 2014;79:71155. [PubMed] [Google Scholar]
- 19.Bleich SN, Wolfson JA, Jarlenski MP. Calorie changes in large chain restaurants from 2008 to 2015. Prev Med. 2017;100:112–116. doi: 10.1016/j.ypmed.2017.04.004. [DOI] [PubMed] [Google Scholar]
- 20.Brissette I, Lowenfels A, Noble C, Spicer D. Predictors of total calories purchased at fast-food restaurants:restaurant characteristics, calorie awareness, and use of calorie information. J Nutr Educ Behav. 2013;45:404–411. doi: 10.1016/j.jneb.2013.01.019. [DOI] [PubMed] [Google Scholar]
- 21.European Commission. Regulation (EU) No 1169/2011 of the European Parliament and of the Council of 25 October 2011 on the provis on of food information to consumers, amending Regulations (EC) No 1924/2006 and (EC) No. 1925/2006 of the European Parliament and of the Council, and repealing Commission Directive 87/250/EEC, Council Directive 90/496/EEC, Commission Directive 1999/10/EC, Directive 2000/13/EC of the European Parliament and of the Council, Commission Directives 2002/67/EC and 2008/5/EC and Commission Regulation. Journal of the European Union. 2011;54:18–61. [Google Scholar]
- 22.STA Law Firm. United Arab Emirates:Saudi Arabia Mandatory Calorie Labeling on Menus. [cited 2019 January 9] Available from: http://www.mondaq.com/x/769316/food+drugs+law/Saudi+Arabia+Mandatory+Calorie+Labeling+On+Menus.\ .
- 23.General Authority for statistics. Statistical yearbook of 2018. Available from: https://www.stats.gov.sa/en/1007-0 .
- 24.Parmenter K, Wardle J. Development of a general nutrition knowledge questionnaire for adults. Eur J Clin Nutr. 1999;53:298. doi: 10.1038/sj.ejcn.1600726. [DOI] [PubMed] [Google Scholar]
- 25.Vanderlee L, Hammond D. Does nutrition information on menus impact food choice?Comparisons across two hospital cafeterias. Public Health Nutr. 2014;17:1393–1402. doi: 10.1017/S136898001300164X. [DOI] [PMC free article] [PubMed] [Google Scholar]
- 26.Radwan H, Faroukh EM, Obaid RS. Menu labeling implementation in dine-in restaurants:the Public's knowledge, attitude and practices. Arch Public Health. 2017;75:8. doi: 10.1186/s13690-017-0177-9. [DOI] [PMC free article] [PubMed] [Google Scholar]
- 27.Gerend MA. Does calorie information promote lower calorie fast food choices among college students? J Adolesc Health. 2009;44:84–86. doi: 10.1016/j.jadohealth.2008.06.014. [DOI] [PubMed] [Google Scholar]
- 28.Krukowski RA, Harvey-Berino J, Kolodinsky J, Narsana RT, DeSisto TP. Consumers may not use or understand calorie labeling in restaurants. J Am Diet Assoc. 2006;106:917–920. doi: 10.1016/j.jada.2006.03.005. [DOI] [PubMed] [Google Scholar]
- 29.Finkelstein EA, Strombotne KL, Chan NL, Krieger J. Mandatory menu labeling in one fast-food chain in King County, Washington. Am J Prev Med. 2011;40:122–127. doi: 10.1016/j.amepre.2010.10.019. [DOI] [PubMed] [Google Scholar]
- 30.Rea S. Recommended calorie information on menus does not improve consumer choices, Carnegie Mellon study shows. [cited 2013] Available from: https://www.cmu.edu/news/stories/archives/2013/july/july18_menulabeling.html .


