

Abstract
Background
Radiologists are proficient in differentiating between chest radiographs with and without symptoms of pneumonia but have found it more challenging to differentiate coronavirus disease 2019 (COVID-19) pneumonia from non–COVID-19 pneumonia on chest radiographs.
Purpose
To develop an artificial intelligence algorithm to differentiate COVID-19 pneumonia from other causes of abnormalities at chest radiography.
Materials and Methods
In this retrospective study, a deep neural network, CV19-Net, was trained, validated, and tested on chest radiographs in patients with and without COVID-19 pneumonia. For the chest radiographs positive for COVID-19, patients with reverse transcription polymerase chain reaction results positive for severe acute respiratory syndrome coronavirus 2 with findings positive for pneumonia between February 1, 2020, and May 30, 2020, were included. For the non–COVID-19 chest radiographs, patients with pneumonia who underwent chest radiography between October 1, 2019, and December 31, 2019, were included. Area under the receiver operating characteristic curve (AUC), sensitivity, and specificity were calculated to characterize diagnostic performance. To benchmark the performance of CV19-Net, a randomly sampled test data set composed of 500 chest radiographs in 500 patients was evaluated by the CV19-Net and three experienced thoracic radiologists.
Results
A total of 2060 patients (5806 chest radiographs; mean age, 62 years ± 16 [standard deviation]; 1059 men) with COVID-19 pneumonia and 3148 patients (5300 chest radiographs; mean age, 64 years ± 18; 1578 men) with non–COVID-19 pneumonia were included and split into training and validation and test data sets. For the test set, CV19-Net achieved an AUC of 0.92 (95% CI: 0.91, 0.93). This corresponded to a sensitivity of 88% (95% CI: 87, 89) and a specificity of 79% (95% CI: 77, 80) by using a high-sensitivity operating threshold, or a sensitivity of 78% (95% CI: 77, 79) and a specificity of 89% (95% CI: 88, 90) by using a high-specificity operating threshold. For the 500 sampled chest radiographs, CV19-Net achieved an AUC of 0.94 (95% CI: 0.93, 0.96) compared with an AUC of 0.85 (95% CI: 0.81, 0.88) achieved by radiologists.
Conclusion
CV19-Net was able to differentiate coronavirus disease 2019–related pneumonia from other types of pneumonia, with performance exceeding that of experienced thoracic radiologists.
© RSNA, 2021
Summary
An artificial intelligence algorithm differentiated between coronavirus disease 2019 (COVID-19) pneumonia and non–COVID-19 pneumonia on chest radiographs with high sensitivity and specificity.
Key Results
■ The overall performance of artificial intelligence algorithm achieved an area under the receiver operating characteristic curve (AUC) of 0.92 on the test data set of 5869 chest radiographs in 2193 patients (acquired from multiple hospitals and multiple vendors).
■ On a set of 500 randomly selected test chest radiographs, the artificial intelligence algorithm achieved an AUC of 0.94, compared with an AUC of 0.85 from three experienced thoracic radiologists.
Introduction
The outbreak of coronavirus disease 2019 (COVID-19) (1) began with the initial diagnosis of an unknown viral pneumonia in late 2019 in Wuhan, China, that subsequently spread around the globe as a pandemic. Ribonucleic acid sequencing of respiratory samples identified a novel coronavirus (called severe acute respiratory syndrome coronavirus 2) as the underlying cause of COVID-19. Patients with COVID-19 present with symptoms that are similar to other viral illnesses including influenza and other coronaviruses such as severe acute respiratory syndrome (2,3) and Middle East respiratory syndrome (4). Symptoms are nonspecific and include fever, cough, fatigue, dyspnea, diarrhea, and even anosmia (5,6). The radiographic signs are also nonspecific and can be observed in patients with other viral illnesses, drug reactions, or aspiration (5,7,8).
The similarities in clinical presentation across other reactions and illnesses creates challenges regarding establishment of a clinical diagnosis. Currently, reverse transcription polymerase chain reaction (RT-PCR) is the reference standard method to identify patients with COVID-19 infection (9). In addition to the RT-PCR test, CT has also been widely used in China, and occasionally in other countries, to provide additional means of COVID-19 diagnosis and treatment-response monitoring (5,10,11). However, because of concerns of CT facility contamination and exposure to health care workers, health care professional organizations (12–14) do not recommend CT imaging as a general diagnostic imaging tool for patients with COVID-19.
Major medical societies instead recommend the use of chest radiography as part of the work-up for persons suspected of having COVID-19 because of its unique advantages: Almost all clinics, emergency departments, urgent care facilities, and hospitals are equipped with stationary and mobile radiography units, including both urban and rural medical facilities. These units can be easily protected from exposure or disinfected after use and can be directly used in a contained clinical environment without having to move patients. However, the major challenge with the use of chest radiography in diagnosis of COVID-19 is its low sensitivity and specificity in current radiologic practice. A recent study found that the sensitivity of chest radiography was poor for COVID-19 diagnosis (11). To some extent, this poor diagnostic performance can be attributed to the fact that many radiologists are observing COVID-19–induced pneumonia for the first time and therefore need to interpret more images to learn both the common and unique imaging features of this disease.
Machine learning methods, particularly deep learning (15,16), have unique advantages in quick and tireless learning to differentiate COVID-19 pneumonia from other types of pneumonia by using chest radiographs. The purpose of our study was to train and validate a deep learning method to differentiate COVID-19 pneumonia from other causes of abnormalities at chest radiography and to test its performance against thoracic radiologists.
Materials and Methods
This retrospective Health Insurance Portability and Accountability Act–compliant study was approved by the institutional review boards at Henry Ford Health System (Detroit, Mich) and the University of Wisconsin–Madison (Madison, Wis). Written informed consent was waived because of the retrospective nature of the data collection and the use of deidentified images.
Patient Data Sets
For algorithm development, we included chest radiographs in patients with and without COVID-19 pneumonia from Henry Ford Health System, which includes five hospitals and more than 30 clinics. The pneumonia findings for both COVID-19 and non–COVID-19 pneumonia were found by using a commercial natural language processing tool (InSight; Softek Illuminate) that searched radiologist reports for positive findings. Searches were performed in all radiologist reports at the institution during the COVID-19 and non–COVID-19 periods. The patients with non–COVID-19 pneumonia were selected solely on the basis of findings positive for pneumonia in the report and the date of study (October to December 2019). The patients with pneumonia from the COVID-19 period were cross-referenced with the list of patients positive for COVID-19 to find a list of patients with results positive for pneumonia and positive for COVID-19.
The inclusion criteria for the group with non–COVID-19 pneumonia were patients who underwent frontal view chest radiography, were diagnosed with pneumonia, and underwent imaging between October 1, 2019, and December 31, 2019 (the first patient who tested positive for COVID-19 in the United States was confirmed on January 19, 2020, in Seattle, Wash [17]). Because these chest radiographs predate the first confirmed cases of COVID-19 in the United States, we consider these chest radiographs to be positive for non–COVID-19 pneumonia. Patients younger than 18 years were excluded.
The inclusion criteria for the COVID-19–positive group were patients who underwent frontal view chest radiography, and who had an RT-PCR test result positive for severe acute respiratory syndrome coronavirus 2 with a diagnosis of pneumonia between February 1, 2020, and May 31, 2020. Patients were excluded if chest radiography was performed more than 5 days before or 14 days after RT-PCR confirmation.
The resulting data sets consisted of 5805 chest radiographs with RT-PCR–confirmed COVID-19 pneumonia from 2060 patients, and 5300 chest radiographs with non–COVID-19 pneumonia from 3148 patients (Figs 1, 2).
Figure 1:

Study flowchart for data curation and data partition. Vendors 1–4 (V1–V4) are four major vendors of the acquired chest radiographs (CXRs) in the data set. AI = artificial intelligence, COVID-19 = coronavirus disease 2019, RT-PCR = reverse transcription polymerase chain reaction.
Figure 2a:
![Detailed data characteristics. (a) Age distribution of included patients. (b) Distribution of the Δ (delta; time between the positive reverse transcription polymerase chain reaction [RT-PCR] test and the chest radiography) for the positive cohort. A positive delta value indicates that the chest radiography was performed after the RT-PCR test. (c) Distribution of the radiographic unit vendors. (d) Distribution of the use of computed radiography (CR) or digital radiography (DX). (e) Distribution of data from different hospitals (H01–H05 indicate the five different hospitals and C01–C30 indicate the 30 different clinics). COVID-19 = coronavirus disease 2019.](https://www.ncbi.nlm.nih.gov/core/lw/2.0/html/tileshop_pmc/tileshop_pmc_inline.html?title=Click%20on%20image%20to%20zoom&p=PMC3&id=7841876_radiol.2020202944.fig2a.jpg)
Detailed data characteristics. (a) Age distribution of included patients. (b) Distribution of the Δ (delta; time between the positive reverse transcription polymerase chain reaction [RT-PCR] test and the chest radiography) for the positive cohort. A positive delta value indicates that the chest radiography was performed after the RT-PCR test. (c) Distribution of the radiographic unit vendors. (d) Distribution of the use of computed radiography (CR) or digital radiography (DX). (e) Distribution of data from different hospitals (H01–H05 indicate the five different hospitals and C01–C30 indicate the 30 different clinics). COVID-19 = coronavirus disease 2019.
Figure 2b:
![Detailed data characteristics. (a) Age distribution of included patients. (b) Distribution of the Δ (delta; time between the positive reverse transcription polymerase chain reaction [RT-PCR] test and the chest radiography) for the positive cohort. A positive delta value indicates that the chest radiography was performed after the RT-PCR test. (c) Distribution of the radiographic unit vendors. (d) Distribution of the use of computed radiography (CR) or digital radiography (DX). (e) Distribution of data from different hospitals (H01–H05 indicate the five different hospitals and C01–C30 indicate the 30 different clinics). COVID-19 = coronavirus disease 2019.](https://www.ncbi.nlm.nih.gov/core/lw/2.0/html/tileshop_pmc/tileshop_pmc_inline.html?title=Click%20on%20image%20to%20zoom&p=PMC3&id=7841876_radiol.2020202944.fig2b.jpg)
Detailed data characteristics. (a) Age distribution of included patients. (b) Distribution of the Δ (delta; time between the positive reverse transcription polymerase chain reaction [RT-PCR] test and the chest radiography) for the positive cohort. A positive delta value indicates that the chest radiography was performed after the RT-PCR test. (c) Distribution of the radiographic unit vendors. (d) Distribution of the use of computed radiography (CR) or digital radiography (DX). (e) Distribution of data from different hospitals (H01–H05 indicate the five different hospitals and C01–C30 indicate the 30 different clinics). COVID-19 = coronavirus disease 2019.
Figure 2c:
![Detailed data characteristics. (a) Age distribution of included patients. (b) Distribution of the Δ (delta; time between the positive reverse transcription polymerase chain reaction [RT-PCR] test and the chest radiography) for the positive cohort. A positive delta value indicates that the chest radiography was performed after the RT-PCR test. (c) Distribution of the radiographic unit vendors. (d) Distribution of the use of computed radiography (CR) or digital radiography (DX). (e) Distribution of data from different hospitals (H01–H05 indicate the five different hospitals and C01–C30 indicate the 30 different clinics). COVID-19 = coronavirus disease 2019.](https://www.ncbi.nlm.nih.gov/core/lw/2.0/html/tileshop_pmc/tileshop_pmc_inline.html?title=Click%20on%20image%20to%20zoom&p=PMC3&id=7841876_radiol.2020202944.fig2c.jpg)
Detailed data characteristics. (a) Age distribution of included patients. (b) Distribution of the Δ (delta; time between the positive reverse transcription polymerase chain reaction [RT-PCR] test and the chest radiography) for the positive cohort. A positive delta value indicates that the chest radiography was performed after the RT-PCR test. (c) Distribution of the radiographic unit vendors. (d) Distribution of the use of computed radiography (CR) or digital radiography (DX). (e) Distribution of data from different hospitals (H01–H05 indicate the five different hospitals and C01–C30 indicate the 30 different clinics). COVID-19 = coronavirus disease 2019.
Figure 2d:
![Detailed data characteristics. (a) Age distribution of included patients. (b) Distribution of the Δ (delta; time between the positive reverse transcription polymerase chain reaction [RT-PCR] test and the chest radiography) for the positive cohort. A positive delta value indicates that the chest radiography was performed after the RT-PCR test. (c) Distribution of the radiographic unit vendors. (d) Distribution of the use of computed radiography (CR) or digital radiography (DX). (e) Distribution of data from different hospitals (H01–H05 indicate the five different hospitals and C01–C30 indicate the 30 different clinics). COVID-19 = coronavirus disease 2019.](https://www.ncbi.nlm.nih.gov/core/lw/2.0/html/tileshop_pmc/tileshop_pmc_inline.html?title=Click%20on%20image%20to%20zoom&p=PMC3&id=7841876_radiol.2020202944.fig2d.jpg)
Detailed data characteristics. (a) Age distribution of included patients. (b) Distribution of the Δ (delta; time between the positive reverse transcription polymerase chain reaction [RT-PCR] test and the chest radiography) for the positive cohort. A positive delta value indicates that the chest radiography was performed after the RT-PCR test. (c) Distribution of the radiographic unit vendors. (d) Distribution of the use of computed radiography (CR) or digital radiography (DX). (e) Distribution of data from different hospitals (H01–H05 indicate the five different hospitals and C01–C30 indicate the 30 different clinics). COVID-19 = coronavirus disease 2019.
Figure 2e:
![Detailed data characteristics. (a) Age distribution of included patients. (b) Distribution of the Δ (delta; time between the positive reverse transcription polymerase chain reaction [RT-PCR] test and the chest radiography) for the positive cohort. A positive delta value indicates that the chest radiography was performed after the RT-PCR test. (c) Distribution of the radiographic unit vendors. (d) Distribution of the use of computed radiography (CR) or digital radiography (DX). (e) Distribution of data from different hospitals (H01–H05 indicate the five different hospitals and C01–C30 indicate the 30 different clinics). COVID-19 = coronavirus disease 2019.](https://www.ncbi.nlm.nih.gov/core/lw/2.0/html/tileshop_pmc/tileshop_pmc_inline.html?title=Click%20on%20image%20to%20zoom&p=PMC3&id=7841876_radiol.2020202944.fig2e.jpg)
Detailed data characteristics. (a) Age distribution of included patients. (b) Distribution of the Δ (delta; time between the positive reverse transcription polymerase chain reaction [RT-PCR] test and the chest radiography) for the positive cohort. A positive delta value indicates that the chest radiography was performed after the RT-PCR test. (c) Distribution of the radiographic unit vendors. (d) Distribution of the use of computed radiography (CR) or digital radiography (DX). (e) Distribution of data from different hospitals (H01–H05 indicate the five different hospitals and C01–C30 indicate the 30 different clinics). COVID-19 = coronavirus disease 2019.
The chest radiography was performed on imaging systems from the following vendors: Carestream Health (DRX-1, DRX-Revolution), GE Healthcare (Optima-XR220, Geode Platform), Konica Minolta (CS-7), Agfa (DXD40, DXD30, DX-G), Siemens Healthineers (Fluorospot Compact FD), and Kodak (Classic CR).
Training, Validation, and Test Data Sets
It is important to consider any variables from chest radiograph acquisition (such as x-ray tube potential [ie, kilovolt-peak values] and x-ray exposure levels) to mitigate any biases in algorithm training (Appendix E1 [online]). Because our overarching objective was to develop a deep learning algorithm that could be successfully and broadly applied to chest radiographs obtained at different hospitals and clinics where chest radiography systems from different vendors are used, our strategy was to train the deep learning method by using a data set with images from different vendor systems. Chest radiographs were randomly selected from the four major vendors (Carestream Health, GE Healthcare, Konica Minolta, and Agfa) in the data set and these vendors were randomly anonymized as V1, V2, V3, and V4. The curated chest radiographs were first grouped by vendors, and a total of 5236 chest radiographs (2582 chest radiographs in the COVID-19 cohort and 2654 chest radiographs in the non–COVID-19 pneumonia cohort) were used as training and validation to develop our deep learning algorithm, which is referred to as CV19-Net.
The remaining data were used for performance evaluation of the developed CV19-Net algorithm, including 3223 chest radiographs positive for COVID-19 from 1007 patients and 2646 non–COVID-19 pneumonia chest radiographs in 1186 patients. A patient-based data partition scheme was used to ensure that chest radiographs in any particular patient would only appear in either the training data set or test data set, not in both. See Table 1 for details of the data partition.
Table 1:
Training and Validation and Test Data Sets

Image Preprocessing in Machine Learning
The Digital Imaging and Communications in Medicine files of the collected chest radiographs were resized to 1024 × 1024 pixels and saved as 8-bit Portable Network Graphics gray-scale images. Before they were fed into CV19-Net, images were downscaled to 224 × 224 pixels, converted to RGB images, and normalized on the basis of the mean and standard deviation of images in the ImageNet data set (18) (Appendix E1 [online]).
Neural Network Architecture and Training Strategy
The CV19-Net we used is an ensemble of 20 individually trained deep neural networks. Each deep neural network consists of four modules of the DenseNet (19) architecture, with a binary classifier to differentiate COVID-19 pneumonia from other types of pneumonia. A three-stage transfer learning approach was used to train the 20 individual deep learning neural networks of the same architecture. After CV19-Net was trained, an input chest radiograph was fed into the CV19-Net to produce 20 individual probability scores, then a final score was generated by performing a quadratic mean. This process is similar to the group diagnosis protocol used in difficult clinical decision-making processes in which 20 individual experts are asked to evaluate the same input image, and then a final group score is generated by a voting scheme. This final probability score was compared with a chosen decision-making threshold value to classify the input chest radiographs as COVID-19 or non–COVID-19 pneumonia (for details of the network architecture and the training process, see Appendix E1 [online]; the code is available at https://github.com/uw-ctgroup/CV19-Net).
Human Radiologists Reader Study to Generate Performance Reference
To benchmark the performance of the developed CV19-Net, three experienced thoracic radiologists (J.D.N., T.K.S., and M.L.S., with > 9, 14, and 34 years of experience, respectively) performed binary classification (positive or negative for COVID-19) reader study by using a randomly selected subset of the test images (Fig 1): 500 chest radiographs in 500 patients (250 with COVID-19 pneumonia and 250 with non–COVID-19 pneumonia). All three readers have recent experience with COVID-19 chest radiography interpretation. The three readers were blinded to any clinical information and read all images independently between June 1, 2020, and June 15, 2020. The three readers defined each chest radiograph as pneumonia that was either positive or negative for COVID-19 by using a picture archiving communication system workstation with standard reading conditions. To compare the performance between CV19-Net and the three readers on the same test data set, the threshold of CV19-Net was adjusted to match the corresponding specificity of the radiologist and then the diagnostic sensitivity was compared between each radiologist and CV19-Net.
Statistical Analysis
To evaluate the diagnostic performance of the trained CV19-Net, the area under the receiver operating characteristic curve (AUC), sensitivity, and specificity were calculated in the entire test cohort of 5869 chest radiographs in 2193 patients. The 95% CIs for the performance metrics were calculated by using statistical software (R version 4.0.0; R Foundation for Statistical Computing) with the pROC package (20). CIs for AUCs were calculated by using the DeLong nonparametric method (21); CIs for sensitivity and specificity were calculated by using the bootstrap method (22) with 2000 bootstrap replicates. The McNemar test was performed to compare the sensitivity of CV19-Net with the three radiologists. P value hypothesis testing method was used for each comparison (for details see Appendix E1 [online]). A P value less than .05 was considered to indicate a statistically significant difference.
Results
Patient Overview
A total of 3507 patients (5672 chest radiographs) with non–COVID-19 pneumonia met the inclusion criteria. There were 359 patients (372 chest radiographs) younger than 18 years who were excluded. A total of 2086 patients (6650 chest radiographs) with COVID-19 pneumonia met the inclusion criteria, and 340 patients (845 chest radiographs) were excluded for chest radiographs performed outside of the preferred time of RT-PCR (5 days before to 14 days after a test with positive results).
The resulting data sets that were used for the development (training and validation and testing) consisted of 5805 chest radiographs with RT-PCR–confirmed COVID-19 pneumonia in 2060 patients (mean age, 62 years ± 16; 1059 men) and 5300 chest radiographs with non–COVID-19 pneumonia in 3148 patients (mean age, 64 years ± 18; 1578 men).
The data were randomized and partitioned on the basis of images acquired from chest radiography equipment from different vendors. A total of 2654 chest radiographs in 1962 patients with non–COVID-19 pneumonia and 2582 chest radiographs in 1053 patients with RT-PCR–confirmed COVID-19 were used for training and validation. A total of 2646 chest radiographs in 1186 patients with non–COVID-19 pneumonia and 3223 chest radiographs in 1007 patients with RT-PCR–confirmed COVID-19 were used for CV19-Net testing, resulting in a test data set composed of 5869 chest radiographs in 2193 patients (mean age, 63 years ± 16; 1131 men) (Fig 1).
Overall Performance of CV19-Net
The performance of the CV19-Net achieved an AUC of 0.92 (95% CI: 0.91, 0.93) for the overall test data set. As shown in Figure 3a and Table 2, for a high-sensitivity operating threshold, this method showed a sensitivity of 88% (95% CI: 87, 89) and a specificity of 79% (95% CI: 77, 80); for a high-specificity operating threshold, it showed a sensitivity of 78% (95% CI: 77, 79) and a specificity of 89% (95% CI: 88, 90). The performance of CV19-Net for four major vendors and five major hospitals is presented in Figure 3c.
Figure 3a:

Performance of CV19-Net. (a) Receiver operating characteristic curve of the total test data set (left) with 5869 chest radiographs and the probability score distribution (right). (b) Pooled performance of the three chest radiologists compared with CV19-Net for the 500 test cases. (c) Receiver operating characteristic curves of CV19-Net for different vendors (V1–V4) and hospitals (H01–H05) in the test data set. AUC = area under the receiver operating characteristic curve, COVID-19 = coronavirus disease 2019.
Table 2:
Test Performance of CV19-Net for Different Vendors

Figure 3c:

Performance of CV19-Net. (a) Receiver operating characteristic curve of the total test data set (left) with 5869 chest radiographs and the probability score distribution (right). (b) Pooled performance of the three chest radiologists compared with CV19-Net for the 500 test cases. (c) Receiver operating characteristic curves of CV19-Net for different vendors (V1–V4) and hospitals (H01–H05) in the test data set. AUC = area under the receiver operating characteristic curve, COVID-19 = coronavirus disease 2019.
The three radiologists’ interpretation results from the subset of 500 test images had sensitivities of 42%, 68%, and 90%, and specificities of 96%, 85%, and 55%, respectively. By using the interpretation results of the same image from the three readers, an averaged receiver operating characteristic curve with an AUC of 0.85 (95% CI: 0.81, 0.88) was generated for the radiologists. When the CV19-Net was applied to the same subset of test images, it yielded an AUC of 0.94 and sensitivities of 71%, 87%, and 98%, and specificities of 96%, 85%, and 55%, respectively, when choosing a matched specificity to the performance of each radiologist (Fig 3b). All P values were less than .001, indicating CV19-Net had better sensitivity than human radiologists at all matched specificity levels. Figure 4 shows two example images in the reader study test data set that were correctly labeled by CV19-Net but incorrectly labeled by all three radiologists. The heatmaps generated by CV19-Net are also shown in Figure 4. See Appendix E1 (online) for details on the heatmap generation.
Figure 3b:

Performance of CV19-Net. (a) Receiver operating characteristic curve of the total test data set (left) with 5869 chest radiographs and the probability score distribution (right). (b) Pooled performance of the three chest radiologists compared with CV19-Net for the 500 test cases. (c) Receiver operating characteristic curves of CV19-Net for different vendors (V1–V4) and hospitals (H01–H05) in the test data set. AUC = area under the receiver operating characteristic curve, COVID-19 = coronavirus disease 2019.
Figure 4a:

Examples of chest radiographs and the network-generated heatmaps from the reader study test set. (a) A 64-year-old man with coronavirus disease 2019 (COVID-19) pneumonia who was classified correctly by CV19-Net but incorrectly classified by all three radiologists (left). The heatmap generated by CV19-Net overlaid on the original image (right). The red highlights the anatomic regions that contributed most to the CV19-Net prediction. (b) A 58-year-old woman with non–COVID-19 pneumonia who was classified correctly by CV19-Net but incorrectly classified by all three radiologists. The heatmap highlighted the anatomic regions that contribute most to the CV19-Net prediction (right).
Figure 4b:

Examples of chest radiographs and the network-generated heatmaps from the reader study test set. (a) A 64-year-old man with coronavirus disease 2019 (COVID-19) pneumonia who was classified correctly by CV19-Net but incorrectly classified by all three radiologists (left). The heatmap generated by CV19-Net overlaid on the original image (right). The red highlights the anatomic regions that contributed most to the CV19-Net prediction. (b) A 58-year-old woman with non–COVID-19 pneumonia who was classified correctly by CV19-Net but incorrectly classified by all three radiologists. The heatmap highlighted the anatomic regions that contribute most to the CV19-Net prediction (right).
Performance by Age Group and Sex
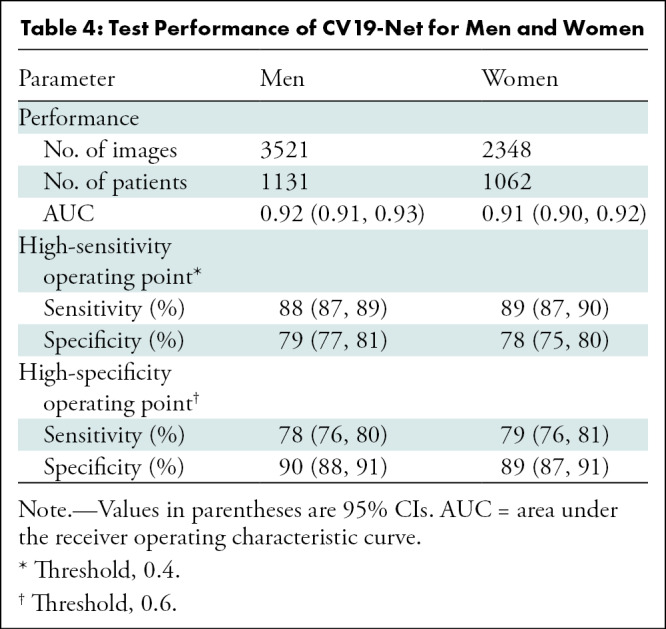
The performance of CV19-Net is presented for patients with different age groups in Table 3 and for the two sexes in Table 4. There was no difference in CV19-Net performance between sex (P = .17). However, results showed a difference in performance between well-separated age groups (eg, age group of 18–30 years was different than age groups of 45–60 years [P = .02], 60–75 years [P = .002], and 75–90 years [P < .001]), whereas no difference in neighboring age groups (eg, age groups of 18–30 years compared with 30–45 years; P = .31) was found. See Table E1 (online) for details.
Table 3:
Test Performance of CV19-Net for Different Age Groups

Table 4:
Test Performance of CV19-Net for Men and Women
Performance versus Training Sample Size
The relationship between the achievable AUC of CV19-Net versus the needed training sample sizes was systematically investigated to determine the training sample size used in this article (Fig E5 [online]). The results demonstrated that more than 3000 training samples (1500 radiographs positive for COVID-19 and 1500 for non–COVID-19 pneumonia) are needed to achieve an AUC better than 0.90. After the training sample size is larger than 3000, the performance gain is diminished with the increase of training samples.
Discussion
It has been routine clinical practice for radiologists to interpret chest radiographs with and without symptoms of pneumonia. However, it has been more challenging to differentiate chest radiographs with symptoms of coronavirus disease 2019 (COVID-19) pneumonia from those without symptoms because of the lack of training in reading in this pandemic. In our study, we demonstrated that an artificial intelligence algorithm can be trained and used to differentiate COVID-19–related pneumonia from non–COVID-19–related pneumonia by using chest radiography, with excellent performance on the same test data set in terms of area under the receiver operating characteristic curve (AUC) of 0.94 (95% CI: 0.93, 0.96) compared with a 0.85 AUC (95% CI: 0.81, 0.88) from three thoracic radiologists.
Intensive efforts have been made globally in 2020 to seek fast and reliable machine learning solutions to help diagnose patients with COVID-19 and triage patients for proper allocation of rather limited resources in combating this global pandemic (see Table E2 [online] for a summary of related studies). Most related studies used small data sets with fewer than 200 COVID-19 chest radiographs collected from various sources including cropped images from published journals or from author access to other image databases. Furthermore, evaluations of these neural networks were only performed in the same small data cohort. Because the image quality was not uniform in these small data sets, the apparent test performances were often biased (23).
Two recent studies (24,25) reported their results by using relatively larger data sets from clinical centers (one from Brazil with 558 COVID-19–positive chest radiographs and the other from the Netherlands with 980 COVID-19–positive chest radiographs used in both training and testing data sets). Schwab et al (24) trained a small number of conventional machine learning algorithms from their data set and reported an AUC of 0.66 (95% CI: 0.63, 0.70). In Murphy et al (25), a deep learning model was trained by using 512 COVID-19–positive chest radiographs combined with 482 COVID-19–negative chest radiographs and reported an AUC of 0.81 on chest radiographs in 454 patients. The potential variance of the reported AUC performance values remains unclear because there was no 95% CI reported. Their results were compared with those of six human radiologists, showing that the performance of their deep learning model is comparable with radiologists.
In our study, we systematically studied the performance of the trained deep learning model and how it changed with an increase of the training data set size (Fig E5 [online]). With a training sample size of 1000 (500 images from patients with COVID-19 pneumonia and 500 images from patients with non–COVID-19 pneumonia), the achievable AUC was found to be 0.86, similar to what was reported (AUC, 0.81) in Murphy et al (25). The slightly higher performance of our network may be attributable to differences in data curation strategies because we included chest radiographs obtained contemporaneously with RT-PCR within a narrow window (5 days before to 14 days after an RT-PCR test).
Our study had several limitations. First, we only considered the binary classification task: COVID-19 pneumonia versus other types of pneumonia. Therefore, at this stage, the developed algorithm should be used in adjunction to radiologist’s findings of pneumonia features on chest radiographs. For an automated artificial intelligence–assisted diagnostic system, it would be ideal to have finer classification categories such as normal, bacterial, non–COVID-19 viral, and COVID-19. With global efforts in collecting chest radiographs with those four classification categories, our work may be further enhanced in future studies. Second, the collection of data from patients with COVID-19 pneumonia was conducted during the first peak of the COVID-19 pandemic. As a result, the collected data may not reflect the true prevalence of the disease. We also included multiple chest radiographs in the same patient because some patients underwent multiple examinations as their disease progressed. We questioned whether the use of multiple chest radiographs changes the performance evaluation; to address this, a single chest radiograph was randomly selected from multiple chest radiographs per patient to participate in the overall test performance evaluation and the overall AUC did not change from 0.92. Third, although the method was tested at multiple hospitals and clinics, the test sites need to be further expanded to determine whether the developed artificial intelligence algorithm in this work is generalizable to even broader population distributions over different regions and continents. Finally, in radiologist reader studies, only the averaged receiver operating characteristic curve and the corresponding AUC was calculated on the basis of the diagnosis on each chest radiograph from three readers. Thus, the reported receiver operating characteristic curve and AUC were averaged results from three independent readers. Ideally, each reader should have been asked to report their degree of confidence level in their diagnosis for each chest radiograph, and individual receiver operating characteristic curves and AUCs for each reader could have then been calculated and reported.
In conclusion, the combination of chest radiography with the proposed CV19-Net deep learning algorithm has the potential to be a method to improve the accuracy and timeliness of the radiologic interpretation of coronavirus disease 2019 pneumonia.
APPENDIX
SUPPLEMENTAL FIGURES
Study supported by a grant from Wisconsin Partnership Program and by the National Institute of Biomedical Imaging and Bioengineering (grant 3U01EB021183W4).
Disclosures of Conflicts of Interest: R.Z. disclosed no relevant relationships. X.T. disclosed no relevant relationships. Z.Q. disclosed no relevant relationships. N.B.B. disclosed no relevant relationships. C.Z. disclosed no relevant relationships. D.G. disclosed no relevant relationships. T.K.S. disclosed no relevant relationships. J.D.N. disclosed no relevant relationships. M.L.S. Activities related to the present article: disclosed no relevant relationships. Activities not related to the present article: disclosed no relevant relationships. Other relationships: disclosed shares in Stemina Biomarker Discovery, Healthymyne, and X-vax. J.W.G. disclosed no relevant relationships. K.L. disclosed no relevant relationships. S.B.R. disclosed no relevant relationships. G.H.C. disclosed no relevant relationships.
Abbreviations:
- AUC
- area under the receiver operating characteristic curve
- COVID-19
- coronavirus disease 2019
- RT-PCR
- reverse transcription polymerase chain reaction
References
- 1.World Health Organization . Coronavirus disease (COVID-2019) Situation Report – 32. 2020. https://www.who.int/docs/default-source/coronaviruse/situation-reports/20200221-sitrep-32-covid-19.pdf. Published February 21, 2020. Accessed December 11, 2020.
- 2.Ksiazek TG, Erdman D, Goldsmith CS, et al. A novel coronavirus associated with severe acute respiratory syndrome. N Engl J Med 2003;348(20):1953–1966. [DOI] [PubMed] [Google Scholar]
- 3.Kuiken T, Fouchier RAM, Schutten M, et al. Newly discovered coronavirus as the primary cause of severe acute respiratory syndrome. Lancet 2003;362(9380):263–270. [DOI] [PMC free article] [PubMed] [Google Scholar]
- 4.de Groot RJ, Baker SC, Baric RS, et al. Middle East respiratory syndrome coronavirus (MERS-CoV): announcement of the Coronavirus Study Group. J Virol 2013;87(14):7790–7792. [DOI] [PMC free article] [PubMed] [Google Scholar]
- 5.Huang C, Wang Y, Li X, et al. Clinical features of patients infected with 2019 novel coronavirus in Wuhan, China. Lancet 2020;395(10223):497–506 [Published correction appears in Lancet 2020;395(10223):496.]. [DOI] [PMC free article] [PubMed] [Google Scholar]
- 6.Guan WJ, Ni ZY, Hu Y, et al. Clinical characteristics of coronavirus disease 2019 in China. N Engl J Med 2020;382(18):1708–1720. [DOI] [PMC free article] [PubMed] [Google Scholar]
- 7.Chung M, Bernheim A, Mei X, et al. CT imaging features of 2019 novel coronavirus (2019-NCoV). Radiology 2020;295(1):202–207. [DOI] [PMC free article] [PubMed] [Google Scholar]
- 8.Shi H, Han X, Zheng C. Evolution of CT manifestations in a patient recovered from 2019 novel coronavirus (2019-nCoV) pneumonia in Wuhan, China. Radiology 2020;295(1):20. [DOI] [PMC free article] [PubMed] [Google Scholar]
- 9.U.S. Food and Drug Administration . Accelerated emergency use authorization (EUA) summary COVID-19 RT-PCR test (Laboratory Corporation of America). Silver Spring, Md: U.S. Food and Drug Administration, 2020. [Google Scholar]
- 10.Caruso D, Zerunian M, Polici M, et al. Chest CT features of COVID-19 in Rome, Italy. Radiology 2020;296(2):E79–E85. [DOI] [PMC free article] [PubMed] [Google Scholar]
- 11.Yoon SH, Lee KH, Kim JY, et al. Chest radiographic and CT findings of the 2019 novel coronavirus disease (COVID-19): analysis of nine patients treated in Korea. Korean J Radiol 2020;21(4):494–500. [DOI] [PMC free article] [PubMed] [Google Scholar]
- 12.American College of Radiology. ACR recommendations for the use of chest radiography and computed tomography (CT) for suspected COVID-19 infection. https://www.acr.org/Advocacy-and-Economics/ACR-Position-Statements/Recommendations-for-Chest-Radiography-and-CT-for-Suspected-COVID19-Infection. Updated March 22, 2020. Accessed December 11, 2020.
- 13.Kim HW, Capaccione KM, Li G, et al. The role of initial chest X-ray in triaging patients with suspected COVID-19 during the pandemic. Emerg Radiol 2020. 10.1007/s10140-020-01808-y. Published online June 22, 2020. [DOI] [PMC free article] [PubMed] [Google Scholar]
- 14.Simpson S, Kay FU, Abbara S, et al. Radiological Society of North America Expert Consensus Statement on Reporting Chest CT Findings Related to COVID-19. Endorsed by the Society of Thoracic Radiology, the American College of Radiology, and RSNA - Secondary Publication. J Thorac Imaging 2020;35(4):219–227. [DOI] [PMC free article] [PubMed] [Google Scholar]
- 15.LeCun Y, Bengio Y, Hinton G. Deep learning. Nature 2015;521(7553):436–444. [DOI] [PubMed] [Google Scholar]
- 16.Goodfellow I, Bengio Y, Courville A, Bengio Y. Deep learning. Cambridge, Mass: MIT Press, 2016. [Google Scholar]
- 17.Holshue ML, DeBolt C, Lindquist S, et al. First case of 2019 novel coronavirus in the United States. N Engl J Med 2020;382(10):929–936. [DOI] [PMC free article] [PubMed] [Google Scholar]
- 18.Deng J, Dong W, Socher R, Li LJ, Li K, Li FF. ImageNet: A large-scale hierarchical image database. In: 2009 IEEE Conference on Computer Vision and Pattern Recognition, Miami, FL, June 20–25, 2009. Piscataway, NJ: IEEE, 2009. [Google Scholar]
- 19.Huang G, Liu Z, van der Maaten L, Weinberger KQ. Densely connected convolutional networks. In: 2017 IEEE Conference on Computer Vision and Pattern Recognition (CVPR), Honolulu, HI, July 21–26, 2017. Piscataway, NJ: IEEE, 2017 10.1109/CVPR.2017.243. [DOI] [Google Scholar]
- 20.Robin X, Turck N, Hainard A, et al. pROC: an open-source package for R and S+ to analyze and compare ROC curves. BMC Bioinformatics 2011;12(1):77. [DOI] [PMC free article] [PubMed] [Google Scholar]
- 21.DeLong ER, DeLong DM, Clarke-Pearson DL. Comparing the areas under two or more correlated receiver operating characteristic curves: a nonparametric approach. Biometrics 1988;44(3):837–845. [PubMed] [Google Scholar]
- 22.Efron B. Nonparametric standard errors and confidence intervals. Can J Stat 1981;9(2):139–158. [Google Scholar]
- 23.Maguolo G, Nanni L. A critic evaluation of methods for COVID-19 automatic detection from x-ray images. ArXiv 2004.12823 [preprint] https://arxiv.org/abs/2004.12823. Posted April 27, 2020. Accessed December 11, 2020. [DOI] [PMC free article] [PubMed]
- 24.Schwab P, Schütte AD, Dietz B, Bauer S. Clinical Predictive Models for COVID-19: Systematic Study. J Med Internet Res 2020;22(10):e21439. [DOI] [PMC free article] [PubMed] [Google Scholar]
- 25.Murphy K, Smits H, Knoops AJG, et al. COVID-19 on chest radiographs: a multireader evaluation of an artificial intelligence system. Radiology 2020;296(3):E166–E172. [DOI] [PMC free article] [PubMed] [Google Scholar]
Associated Data
This section collects any data citations, data availability statements, or supplementary materials included in this article.