Abstract
In this paper, nitrogen graphene quantum dots (N-GQDs) and copper indium sulfide/zinc sulfide (CIS/ZnS) QDs were synthesized via facile hydrothermal and aqueous solution routes, respectively. Herein, a fluorescent nanocomposite has been synthesized between N-GQDs and CIS/ZnS QDs in an aqueous phase. This nanocomposite was characterized by photoluminescence, Raman, and ultraviolet–visible (UV–vis) spectroscopies, high-resolution transmission electron microscopy (HRTEM), and X-ray diffraction (XRD). This fluorescent nanocomposite was developed as a highly sensitive, selective nonenzymatic cholesterol optical biosensor in 0.312–5 mM cholesterol. HRTEM micrographs confirmed the preparation of CIS/ZnS QDs and N-GQDs with average diameters of 3 and 5 nm, respectively. The as-prepared NG/CIS/ZnS QD nanocomposite had a high sensitivity for cholesterol with a wide linear range of concentration of 0.312–5 mM with an excellent correlation coefficient (R2) of 0.9688 and limit of detection (LOD) of 0.222 mM.
1. Introduction
Quantum dots (QDs) as nanocrystals with particle size in the range of 2–10 nm have unique optical, chemical, and electrical properties.1−3 These advantages facilitate their application in photovoltaics,4,5 bio-imaging,6 light-emitting diode,7 and biosensors.8,9 Copper indium sulfide (CIS) QDs are a ternary compound semiconductor and is free toxic of metal ions.10,11 CIS/ZnS QDs provide a wide range of photoluminescence (PL) emission from the visible to near-infrared region. CIS/ZnS QDs can tolerate band gap by controlling the copper-to-indium ratio and the doping process.12 ZnS shells can be used to cover and protect CIS QDs due to the match between the lattice parameters, low toxicity, and wide band gap.13 Graphene QDs emerged as a new class of carbon nanostructures having the characteristics of both carbon and graphene.14 Doping of graphene QDs with heteroatoms such as sulfur and nitrogen is effective for the improvement of intrinsic properties such as chemical stability and conductivity.14,15 Nitrogen-doped GQDs (N-GQDs) exhibit high broad-band emission in the range of 300–1000 nm.16
Nanocomposite materials are a key to develop optical sensors. Nanocomposite materials composed of two or more nanoparticles have received much attention due to the combination of the unique properties of each component or the new properties are achieved due to the synergistic effect. Recently, the synthesis of nanocomposite materials has focused on their various applications in medical diagnostics and environmental monitoring.17
Detection of cholesterol is paramount because it plays a crucial role in the production of steroid hormones and bile acid. Cholesterol is an organic biomolecule found in live cells produced by the liver and the intestines.18 The normal range of cholesterol level in blood should be less than 200 mg/dL, and levels higher than 240 mg/dL cause hypercholesterolemia and lead to coronary heart disease, hypertension, myocardial infarction, and atherosclerosis hypertension. However, the low cholesterol level causes hepatopathy and anemia.19 Different techniques such as high-pressure liquid chromatography, mass spectroscopy, calorimetry, spectrophotometry, fluorimetry, electrochemical electrochemistry, and polarography are used to detect cholesterol level.18,20−25 However, these methods have shortcomings of low specificity, reagent instability, high cost, complexity, and expensive instrumentation. Most of the reported cholesterol-sensing procedures involve the use of the enzyme cholesterol oxidase with a catalytic oxidation process of the cholesterol.22,23 The peroxidase-like activity of copper nanoclusters has also been used for developing a chemiluminescence-based cholesterol sensor. However, the enzymatic method has the shortcomings of high cost, enzymatic denaturation, and low-temperature requirement for storage.26,27 High sensitivity, rapidness, and cost-effectiveness make optical sensors an alternative route to detect cholesterol levels based on analysis of the changes in the luminescence spectrum.8,9
There is great interest and need for developing a simple, rapid, and cost-effective method that allows for the detection of cholesterol with high specificity. Developing novel nanocomposites from NGQDs and CIS/ZnS QDs provides superior advantages of aqueous solubility, easy surface functionalization, chemical stability, and biocompatibility besides using a convenient, cheap, and environmentally friendly material and avoiding the need for hazardous chemicals for the synthesis of the particles.
The aim of our work is to synthesize N-GQD, CIS/ZnS QD, and NG/CIS/ZnS QD nanocomposites with different ratios and parameters such as reaction time and pH. The production of a less costly and simpler biosensor based on an NG/CIS/ZnS QD nanocomposite for the detection of different concentrations of nonenzymatic cholesterol and different incubation times is the main target. Limit of detection, sensitivity, and selectivity in the presence of several interfering bioanalytes such as nickel chloride, copper chloride, magnesium chloride, calcium chloride, zinc sulfide, glucose ascorbic acid, cholic acid, and glucose are determined and investigated.
2. Results and Discussion
2.1. Structural Properties of QDs
The Fourier transform infrared (FTIR) spectra of N-GQD, CIS/ZnS QD, and NG/CIS/ZnS QD nanocomposites are depicted in Figure 1. The FTIR spectrum of N-GQDs shows a broad absorption band at 3000–3500 cm–1 assigned to the stretching vibrations of O–H and N–H. This indicates that there are several amino and hydroxyl groups on the surface of N-GQDs. These results of N-GQDs show good hydrophilic property. The bending vibration band of C=C appears at 1581 cm–1.28 In addition, the bands at 1707 and 1622 cm–1 are attributed to the vibrational absorption bands of C=O in the carboxyl and carbonyl groups and C=C, respectively. The vibrational band at 1435 cm–1 corresponds to O=C–NH, and the peak at 1205 cm–1 is assigned to the stretching peak of C–O.29 The peak at 1402 cm–1 is due to the bending vibration of C–NH and indicates the successful incorporation of nitrogen atoms into the N-GQDs.15
Figure 1.
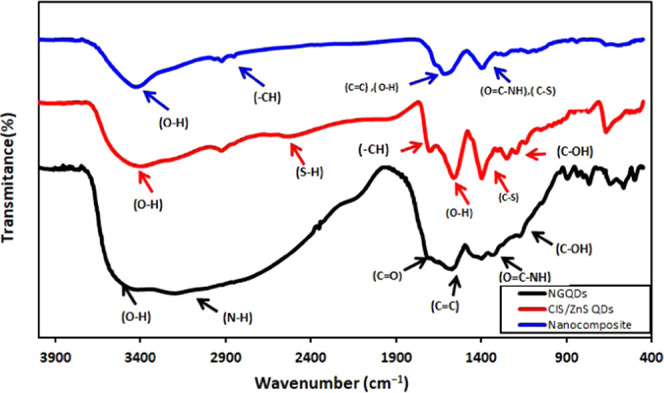
FTIR spectra of N-GQDs, CIS/ZnS QDs, and NG/CIS/ZnS QDs.
For CIS/ZnS QDs, the FTIR spectrum depicted in Figure 1 presents the characteristic stretching vibration peak of O–H of 3-mercaptopropionic acid (MPA) at 3400 cm–1. Moreover, the two bands at 1586 and 1271 cm–1 are assigned to O–H in-plane and C–O–H stretching, respectively. The carbonyl and —CH peaks of MPA as a capping agent for QDs appear at 1701 and 2962 cm–1, respectively. It is noted that the peaks at 2550 and 1410 cm–1 are correlated to S–H and C–S groups, respectively, of MPA.30 The nanocomposite shows a decrease in the IR intensity of free O–H and N–H due to the formation of a hydrogen bond between the carboxyl groups of MPA CIS QDs and the amine groups of N-GQDs. In addition, it is observed that the peak at 2550 cm–1 related to the reaction of the S–H group of excess MPA with N-GQDs disappears.31
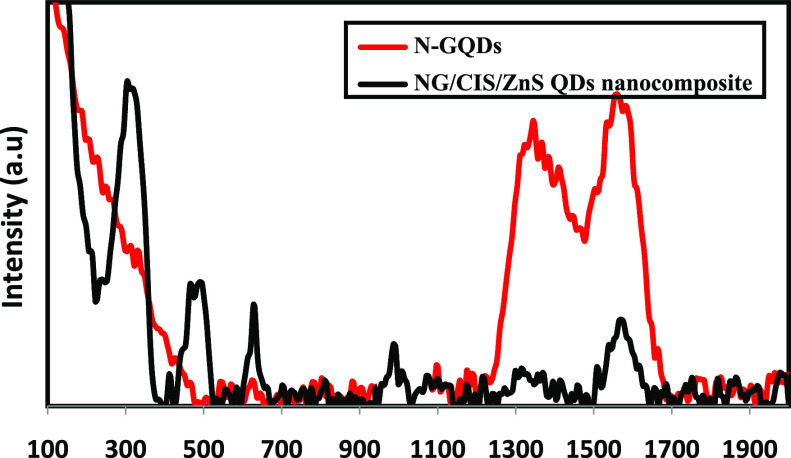
Figure 2 displays the Raman spectra of N-GQD and NG/CIS/ZnS QD nanocomposites (1:3). N-GQDs present a disorder (D) band at 1338 cm–1 related to the presence of sp3 defects and a crystalline (G) band at 1558 cm–1 related to the in-plane vibration of sp2 carbon. N-GQDs exhibit a broader D band, suggesting that the intercalation of N atoms into the conjugated carbon backbone initiative disordered structures, as shown in Figure 2. The ratio of the intensities (ID/IG) of these characteristic bands can be used to correlate the structural properties of the carbon. It is found that the ID/IG value is 0.89 for N-GQDs.15,34,35 On the other hand, it is observed that this ratio is 0.34 for the NG/CIS/ZnS QD nanocomposite, as well as enhances the crystallinity of N-GQDs and decreases sp3 defects. The main peak of CIS/ZnS QDs appeared at around 301 cm–1 corresponding to the A1 phonon model in the chalcopyrite structure of CIS crystals,36 and the small peak at approximately 471 cm–1 is conjugated to the CuS phase in CIS/ZnS QDs. In addition, the peak at 623 cm–1 is assigned to the LO overtone mode in CIS/ZnS QDs.37
Figure 2.
Raman spectra of N-GQD and NG/CIS/ZnS QD nanocomposites.
2.2. Morphological Properties
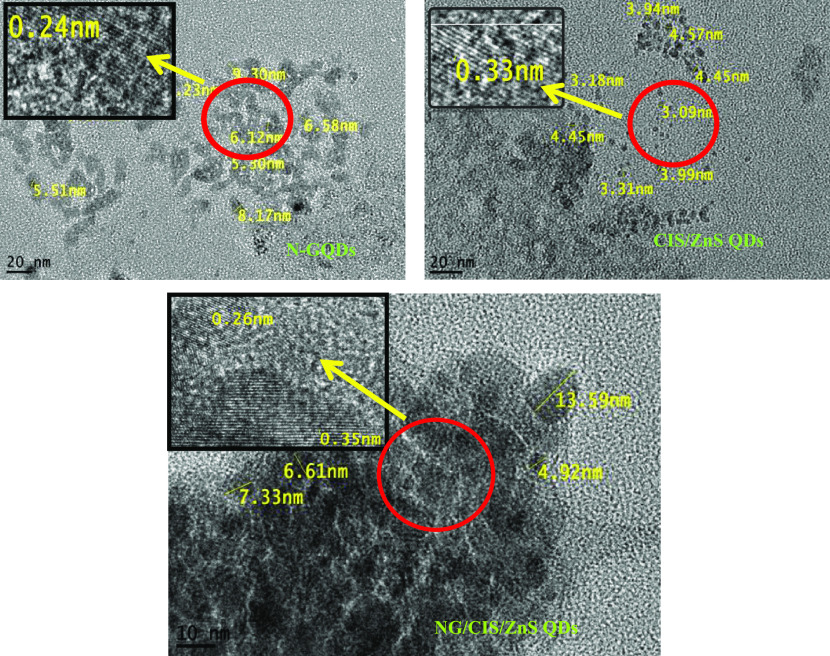
The HRTEM images of the N-GQD, CIS/ZnS QD, and NG/CIS/ZnS QD nanocomposites are depicted in Figure 3. It is observed that the size of N-GQDs with a mean diameter of approximately 5.30–9.30 nm and well-resolved lattice fringes with an interplanar spacing of about 0.24 nm are attributed to the (100) lattice fringes of planes of graphene. This confirms the formation of nanocrystals of N-GQDs.31,38−40 In addition, the HRTEM images of the prepared CIS/ZnS QDs are highly crystalline and the size of the nanocrystals is estimated to be in the range of 3.18–4.57 nm. The interplanar spacing is 0.33 nm for the (112) plane.41−43 It is noted that some nanosized particles are distributed uniformly and separated from each other while others are hybridized into an agglomerate. The isolated particles could be identified as the N-GQDs or the CIS/ZnS QDs with average sizes of 6 and 4.5 nm for N-GQDs and CIS/ZnS QDs, respectively. Regarding the nanocomposite particles, two different types of lattice spacing corresponding to 0.26 nm of N-GQDs and 0.35 nm of CIS/ZnS QDs are detected. Therefore, in these particles, the N-GQDs and CIS/ZnS QDs are combined tightly as a whole.44
Figure 3.
HRTEM images of N-GQD, CIS/ZnS QD, and NG/CIS/ZnS QD nanocomposites.
2.3. Crystallinity Studies of CIS/ZnS and NG/CIS/ZnS QDs
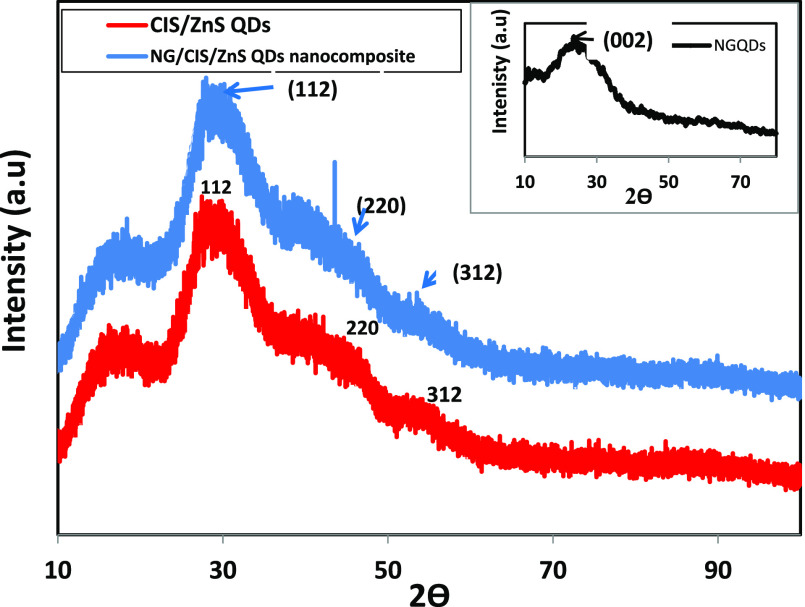
The X-ray diffraction (XRD) patterns of the prepared CIS/ZnS QD and NG/CIS/ZnS QD nanocomposites are shown in Figure 4. The crystalline phase of N-GQDs is clearly shown in the inset of Figure 4. The diffraction pattern exhibits a characteristic broad peak at 23.4° for the (002) plane. This peak is attributed to the interlayer d-spacing of 0.37 nm and corresponds to the plane of graphite structure, which is larger than that of pure graphite (0.334 nm). This observed broad peak also indicates that the prepared N-GQDs have a small particle size, and it differs from that of the crystalline graphite. The larger d-spacing of N-GQDs confirmed the presence of functional groups and nitrogen-doping atoms.45,46 On the other hand, the XRD pattern of CIS/ZnS QDs confirms the tetragonal chalcopyrite structure that is similar to the CIS bulk structure. The reflection peaks positioned at 27.5, 45.5, and 53.4° are assigned to the (112), (220), and (312) planes, respectively.47,48 The characteristic peaks of the XRD patterns of these QDs matched well with the XRD references (JCPDS 32-0339, CuInS2). It is observed that XRD peak intensities are increased with the growth of the ZnS shell due to the enhancement of the crystallinity resulted from the diffusion of Zn2+ ions into the CIS core in the vacancies sites and the matching between lattice parameters of CIS and ZnS. The broad diffraction peak of the core/shell QDs is observed because of the small size of the particles, which can be indexed to the zinc blende (cubic) structure.42 Moreover, in the NG/CIS/ZnS QD nanocomposite, there is an enhancement in the crystalline structure of CIS/ZnS QDs with nondetection of the peak of N-GQDs.
Figure 4.
XRD patterns of CIS/ZnS and NG/CIS/ZnS QDs (inset: XRD pattern of N-GQDs).
2.4. Optical and Surface Charge Properties of N-GQD, CIS/ZnS, and NG/CIS/ZnS QD Nanocomposites
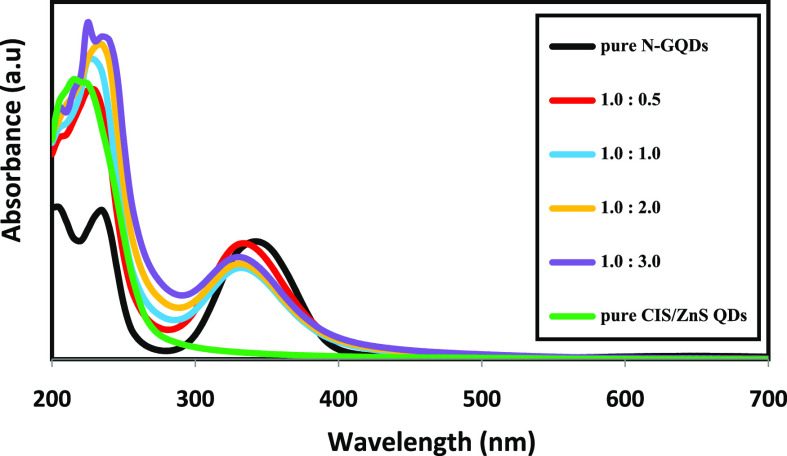
The ultraviolet–visible (UV–vis) spectra of N-GQDs, CIS/ZnS, and different ratios of N-GQDs to CIS/ZnS QDs are illustrated in Figure 5. The absorption spectrum of CIS/ZnS QDs is considered to possess weak self-excitonic absorption, and the peak is not clear due to the core–shell structure of the QDs. The main excitonic absorption peak in the CIS/ZnS QDs is not clear due to two factors. First, it may be indicative of the wide size distribution of the QDs. Second, it may be a result of electron density in the CIS/ZnS QDs crystal structure.49 On the other hand, the pure N-GQDs exhibit two adsorption peaks at 235 and 340 nm attributed to the π–π* and n-π* electronic transitions of C=C, C=O, and C=N, respectively.50,51 By the addition of CIS/ZnS QDs to N-GQDs, the intensity of the absorption peak at 340 decreases significantly. This refers to a major change in absorbing species with almost alteration/deterioration of the graphitic structure. Furthermore, a blue shift appears at an exciting wavelength of 340 nm of N-GQDs, about 5 nm for low ratios of N-GQDs to CIS/ZnS QDs (0.5:1 and 1:1) and 10 nm for high ratios (1:2 and 1:3). This blue shift is attributed to the increase of the electronegativity of oxygen atoms with the addition of new functionalities resulting from the reaction between N-GQDs and MPA-capped CIS/ZnS QDs.52 Also, the carboxylate groups on the MPA may lead to an increase in the electron density of N-GQDs and result in a blue shift of the absorption peak.51
Figure 5.
UV–vis spectra of CIS/ZnS QD, N-GQD, and different ratios of NG/CIS/ZnS QD nanocomposites.
In Figure 6, the ζ-potential of N-GQDs presents a small negative value of −3.7 mV due to the presence of carboxylate and hydroxyl groups on the surface of N-GQDs. According to CIS/ZnS QDs, the chart shows an increase in the value of ζ-potential to −12.0 mV, which refers to the presence of carboxylate groups of MPA on the surface of CIS/ZnS QDs. With respect to the nanocomposite, the binding force due to the hydrogen bond between the carboxyl groups of a CIS/ZnS QD and the amine groups of N-GQDs can be formed. Consequently, the surface charge of NG/CIS/ZnS QDs is increased to −18.4 mV, which enhances the dispersion of colloidal solution of the QDs. The increase of the negative charge refers to a more stable compound due to the reaction between CIS/ZnS QDs and N-GQDs. The NG/CIS/ZnS QD nanocomposite can be used as a biosensor.29−53
Figure 6.
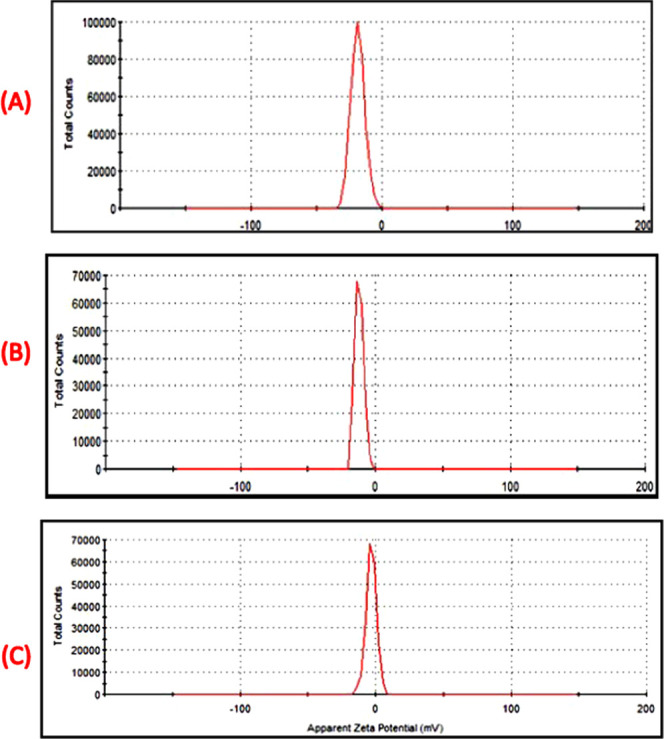
ζ-Potential of NG/CIS/ZnS QD (A), CIS/ZnS QD (B), and N-GQD (C) nanocomposites.
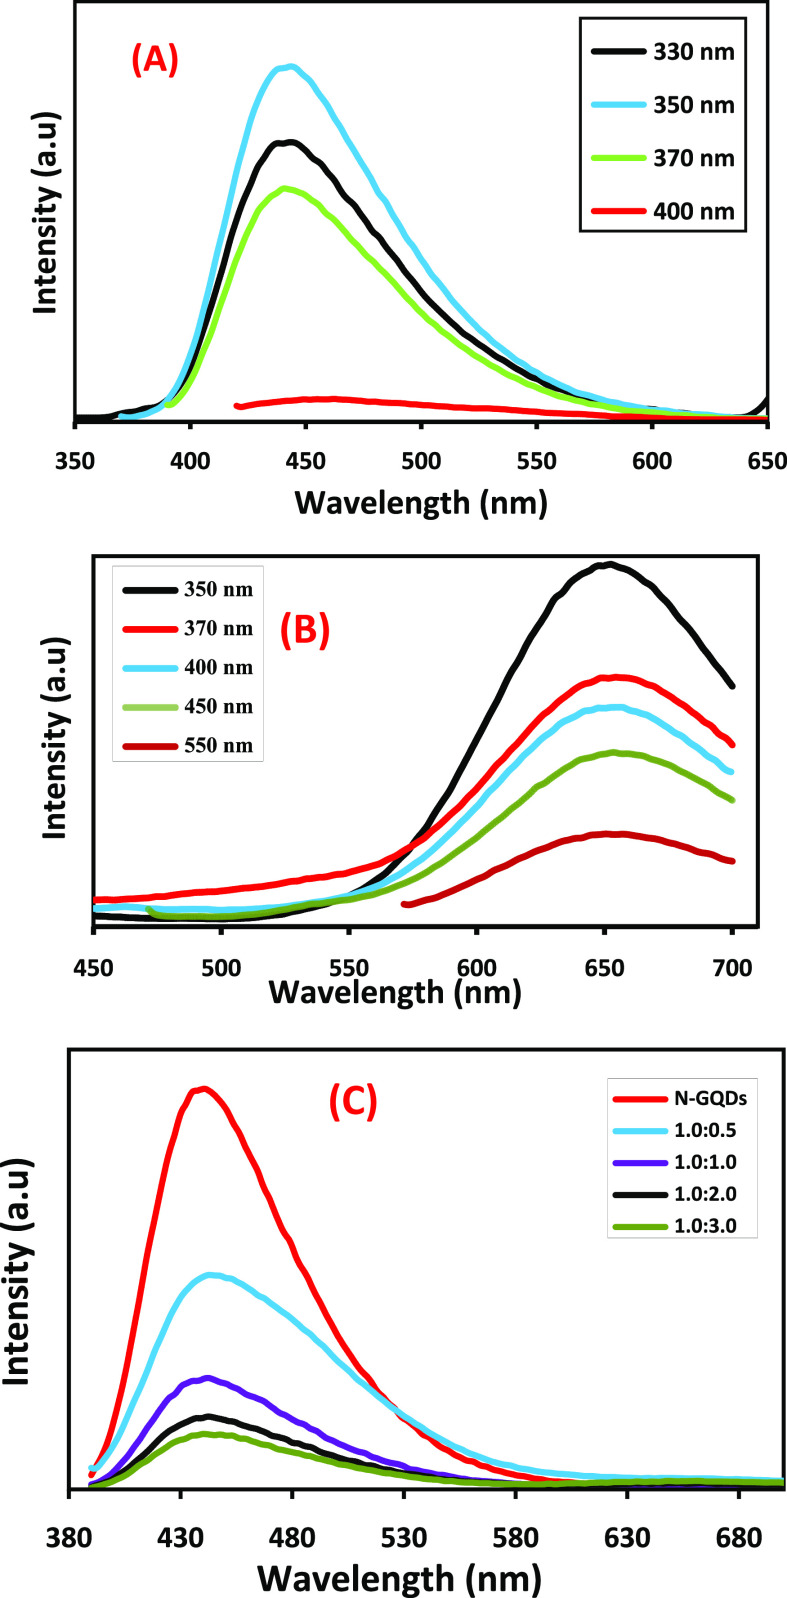
To examine the emission properties, PL spectra of N-GQDs, CIS/ZnS QDs, and NG/CIS/ZnS QDs are recorded at room temperature, as depicted in Figure 7. When a photon with an excitation wavelength exceeding the band gap is absorbed by QDs, the electrons are promoted from the valence band to the conduction band. These excited electrons then relax to their ground state by the emission of another photon with a longer wavelength.54 The PL spectra of N-GQDs at different excitation wavelengths from 330 to 400 nm are illustrated in Figure 7A. N-GQDs display an excitation-independent emission at 443 nm. At an excitation wavelength of 350 nm, the fluorescence intensity is the highest. The excitation-independent behavior of the N-GQDs is attributed to that both the size and surface state of the sp2 clusters contained in the N-GQDs are uniform and the luminescence relates to the sp3 matrix.31,55,56
Figure 7.
PL spectra of N-GQDs (A) and CIS/ZnS QDs (B) with different excitations and NG/CIS/ZnS QDs with different ratios excited at 350 nm (C).
Figure 7B shows the PL spectra of CIS/ZnS QDs and an independent emission at 640 nm with different excitation wavelengths from 350 to 550 nm. It is observed that the maximum intensity of the emission obtained at an excitation wavelength of 350 nm decreased at a higher excitation wavelength. The independent emission of CIS/ZnS QDs is attributed to the passivation of the CIS core with the ZnS shell. In addition, reduction of the surface defects via nonradiative recombination of electrons and holes is enhanced.57,58 It was reported that the emission peak at 640 nm depends on the ratio Cu/In, and increasing the ratio of In shifted this peak to the blue region due to the diffusion of the small size of In into the core of CIS to reduce the particle size of the QDs.11
According to the PL spectra of N-GQDs and CIS/ZnS, the nanocomposite QDs show a decrease of emission of N-GQDs, a red shift of the peak around 3 nm, and quenching of the emission of the CIS/ZnS QDs, as shown in Figure 7C. This can be explained based on the electron transfer process between the CIS/ZnS QDs and N-GQDs. The full width at half-maximum (FWHM) of the nanocomposite is calculated to be 98 nm, while that for N-GQDs is 80 nm that detects recombination in the hybrid structures of N-GQDs and CIS/ZnS QDs.16−58 There are two approaches to quenching the emission of QDs. First, the N-GQDs are bound to the surface of the CIS/ZnS QDs and serve as ligands instead of MPA.44−60 Second, the carboxylate groups in MPA are bonded with N-GQDs and lead to energy transfer between N-GQDs and CIS/ZnS QDs. Consequently, N-GQDs can act as a capping agent with MPA on the CIS core.61,62 The results thus suggest that a lower concentration of CIS/ZnS with 0.5 favors and produces an optimum fluorescence in the nanocomposite.
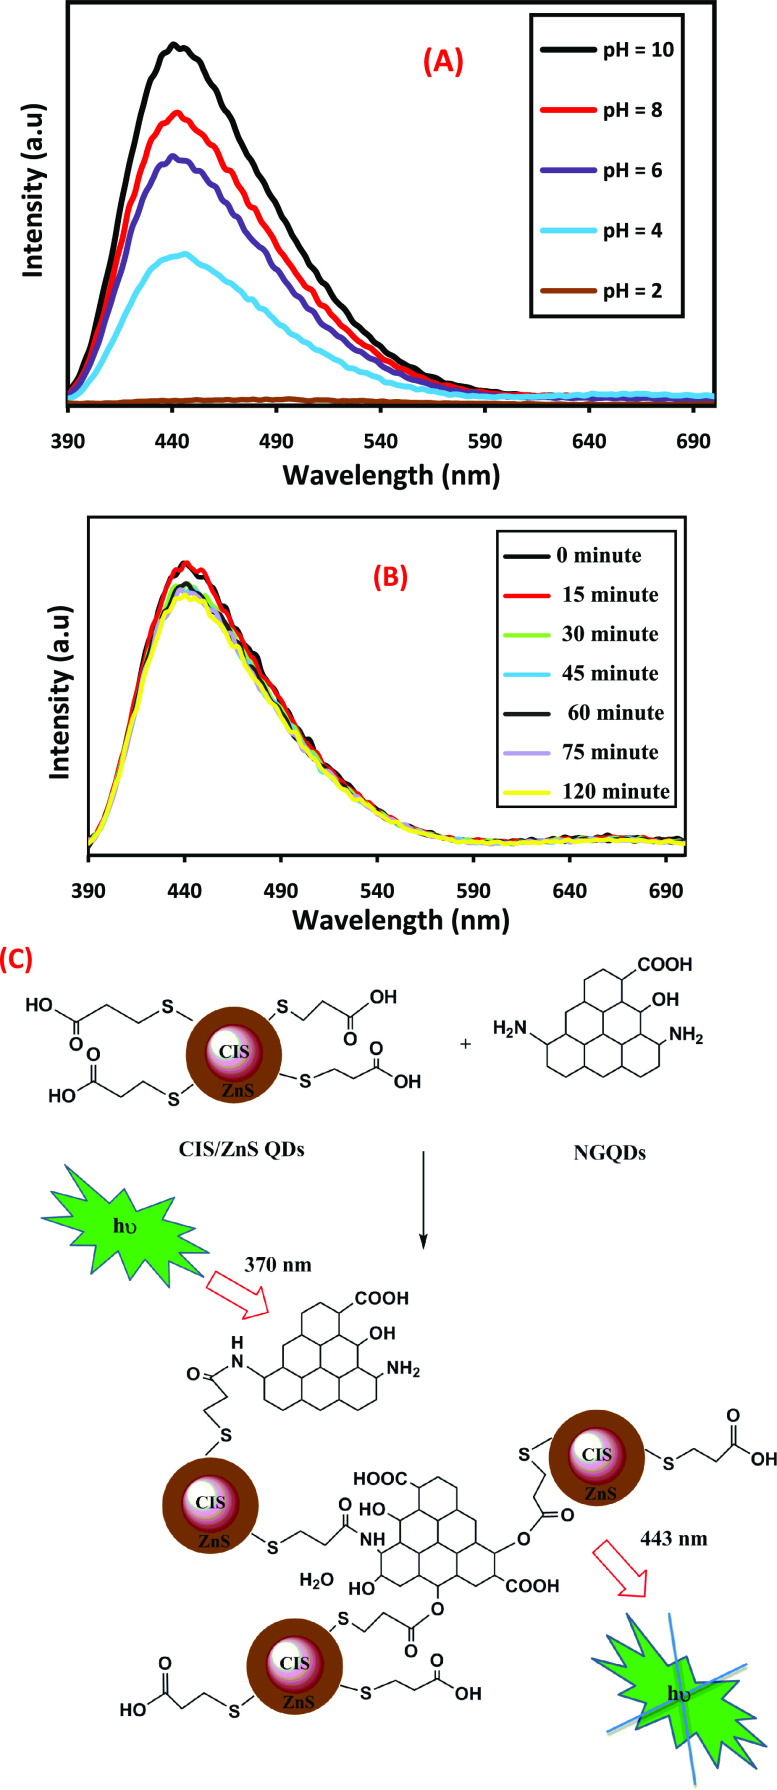
To investigate the effect of pH, 20 μL of the as-prepared luminescent NG/CIS/ZnS QDs solution with a ratio of 1:3 was added to 3 mL of PBS with different pHs of 2, 4, 6, 8, and 10 and incubated in the dark for 20 min at room temperature, as shown in Figure 8A. The PL intensities are completely different at different pH values; in a strongly acidic medium at pH 2 and 4, a very weak emission peak appeared due to the aggregation of the free H+ that promotes the formation of S hole on the surface. This drives the change of the electronic structure of the ZnS shell and results in the decrease of the PL emission peak and the protonation of amino groups in N-GQDs. On the other hand, in a strong basic medium at pH 8 and 10, an increase in PL intensity is observed due to the deprotonation of carboxylate groups in CIS/ZnS QDs and N-GQDs. However, this forms an anionic double layer, disturbs the electron transfer between N-GQDs and CIS/ZnS QDs, and decreases the stability of the nanocomposites.53−64
Figure 8.
PL spectra of NG/CIS/ZnS QD nanocomposite at different pHs (A) and different reaction times (B). Schematic diagram of the PL mechanism of NG/CIS/ZnS QDs (C).
Figure 8B displays the effect of the reaction time of formation of NG/CIS/ZnS QDs measured from 15 to 120 min on the fluorescence intensity. It is observed that the emission peak of N-GQDs is acutely quenched within 30 min upon the addition of CIS/ZnS QDs and remained fixed when this time is prolonged to 120 min. This indicates that the fluorescence quenching rate is fast and the fluorescence intensity remained stable for a long time, which provided the possibility for rapid and stable reaction of carboxylic groups of CIS/ZnS QDs with amine groups of N-GQDs, as shown in Figure 8C. This reaction results in an agglomeration of the NG/CIS/ZnS QD nanocomposite and enhances the quenching process.
The PL quantum yields (QYs) of CIS/ZnS QD, N-GQD, and NG/CIS/ZnS QD nanocomposites are determined by comparing the integrated emissions of the QD samples in aqueous solution with those of a standard fluorescent dye (rhodamine B) with a similar optical density. The QY of the standard dye is 31%.29,65,66 The QYs of CIS/ZnS QDs and N-GQDs are found to be 22.9 and 14.9%, respectively, while the QY of NG/CIS/ZnS QDs shows an increasing trend (38%). The high value of the quantum yield of the nanocomposite QDs is due to summation of two QYs of the two individual QDs.
2.5. NG/CIS/ZnS QDs for Sensing Cholesterol
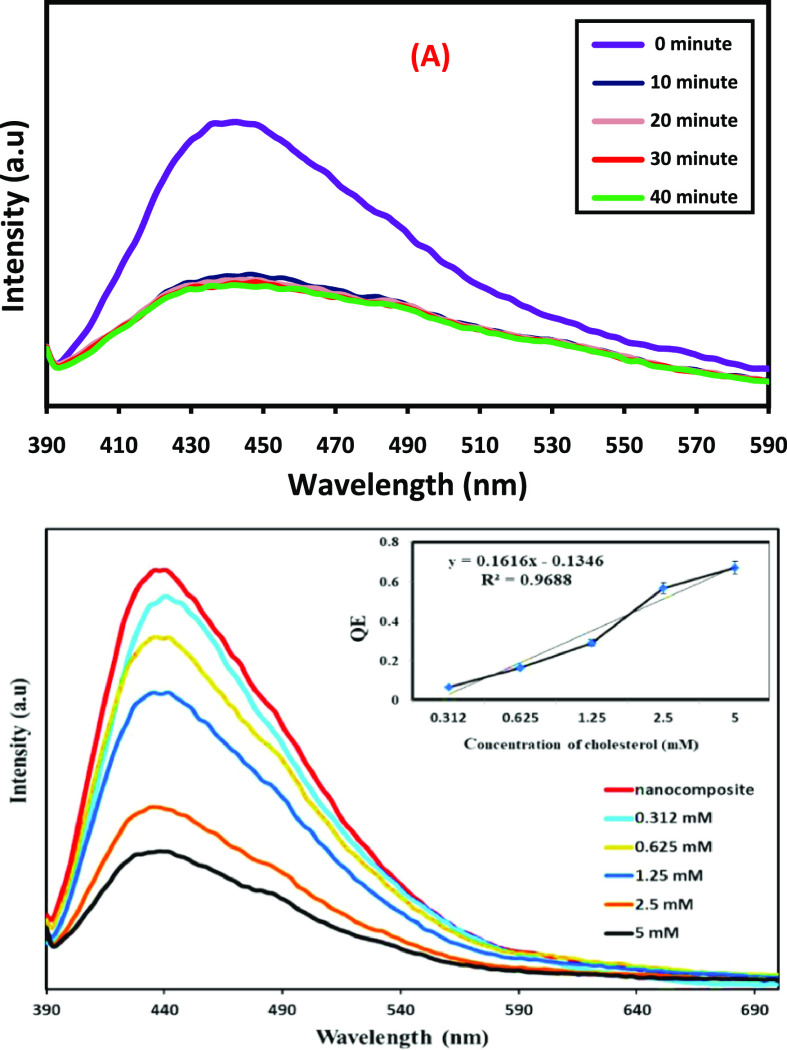
Cholesterol is a lipophilic organic biomolecule having hydrocarbon rings to form a steroid structure. The steroid is linked to a hydroxyl group and produces a hydrophilicity property to the cholesterol unit. NG/CIS/ZnS QDs are used and applied as a sensor for the detection of cholesterol due to its excited photoluminance. The incubation time of cholesterol with the nanocomposite QDs illustrated in Figure 9A indicates that the reaction between the two QDs occurs rapidly and the PL intensity is quenched rapidly within 10 min and then slight quenching after 20 min is observed. The PL is fixed until 40 min, and consequently, the optimal incubation time of 20 min is employed for further experiments.67 The effect of different cholesterol concentrations on the PL emission peak nanocomposite QDs is shown in Figure 9B. It is manifested that the PL intensity of NG/CIS/ZnS QDs decreases with the increase of the cholesterol concentration ranging from 0.312 to 5 mM. In addition, it is noted that cholesterol has good affinity toward nanocomposite QDs with a linear relationship between the change of PL intensity (QE) and cholesterol concentration ranging with a correlation coefficient (R2) of 0.9688, sensitivity of 0.1616 Mm–1, and limit of detection (LOD) of 0.222 mM. Sun et al. combined chromium picolinate (CrPic) and N-GQDs via a facile hydrothermal approach to detect cholesterol by exploiting the fluorescence enhancement of N-GQDs/CrPic. This N-GQDs/CrPic-based sensor had been successfully applied to determine the concentration of cholesterol in a linear range of 0–520 mM and an LOD of 0.4 mM.50 Priyadarshini et al. synthesized gold–carbon dot nanoconjugates of an average size of around 12.6 nm as a sensor for the detection of cholesterol. They showed ultraselectivity to cholesterol and were capable of detecting it even in the presence of possible interfering agents.53 To our knowledge, there is no report on the use of CIS for cholesterol detection.
Figure 9.
PL spectra at different incubation times of cholesterol with nanocomposite QDs (A) and PL spectra of nanocomposite QDs with cholesterol at different concentrations (B) (inset: QE vs concentration of cholesterol).
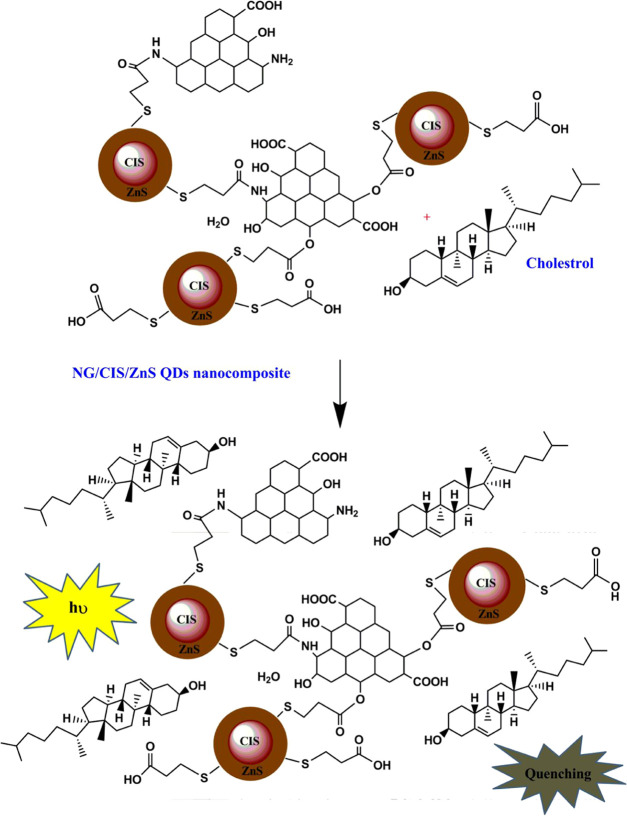
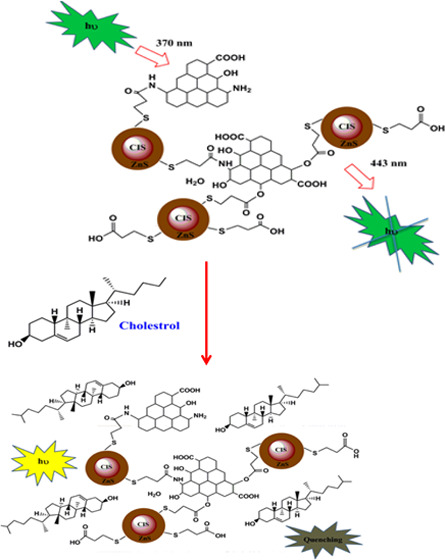
The proposed mechanism of the reaction between the NG/CIS/ZnS QDs and cholesterol is illustrated in Figure 10. NG/CIS/ZnS QDs are negatively charged, which on reaction with cholesterol can electrostatically adsorb the free hydroxyl groups of the latter. Moreover, the chemical reaction can occur between the hydroxyl groups of cholesterol and carboxylic groups or amine groups of the nanocomposite QDs. This produces an agglomeration for the QDs and leads to destabilization of surface charge of the QD nanocomposite and quenching of PL intensity. Moreover, the hydroxyl groups of cholesterol may be oxidized to ketonic groups by the QD nanocomposite and adsorbed on the surface of the nanocomposite.53,68−70
Figure 10.
Schematic diagram of the suggested mechanism of interaction between cholesterol and NG/CIS/ZnS QDs.
2.6. Evaluation of Sensing Selectivity
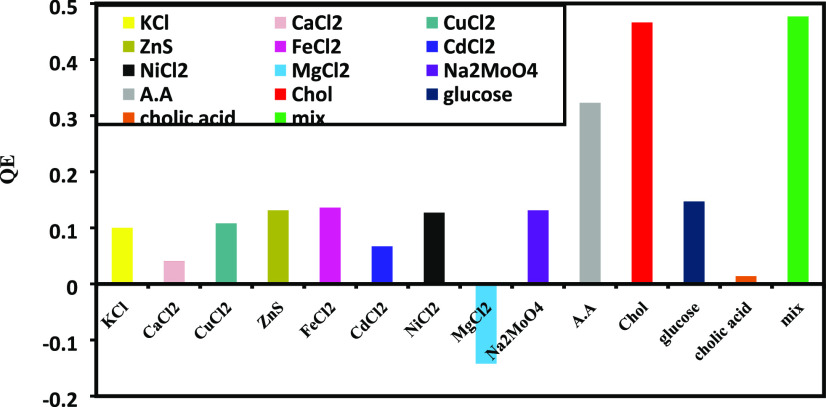
The selectivity of NG/CIS/ZnS QDs due to the existence of several ions of FeCl2, ZnS, NiCl2, KCl, CuCl2, CaCl2, CdCl2, MgCl2, and NaMoO4; biomolecules (ascorbic acid (AA), glucose, cholic acid); and their mixture (Mix) is investigated and discussed as shown in Figure 11, which displays the fluorescence response of NG/CIS/ZnS QDs upon treatment with 1.5 mM of different ions and biomolecules at pH 6 for 20 min incubation time. It is noted that these ions have a quenching effect on the nanocomposite emission except MgCl2. The PL of NG/CIS/ZnS QDs is enhanced by 14.2% due to the reaction between MgCl2 and CIS/ZnS. According to biomolecules, the quenching effects of cholesterol and AA are strongly comparable to those of glucose and cholic acid, which quenched the nanocomposite emission by 46 and 32%, respectively. This is attributed to the presence of hydroxyl groups adsorbed on the surface of NG/CIS/ZnS QDs, and the excited electrons in the nanocomposite are transferred to AA, leading to quenching of the PL spectra of NG/CIS/ZnS QDs.50−72 It can be concluded that there may be a slight interference of detection of cholesterol by the nanocomposite QDs with glucose and cholic acid.
Figure 11.
Fluorescence responses of NG/CIS/ZnS QDs on treatment with 1.5 mM of different analytes.
3. Conclusions
A straightforward route to the synthesis of a new QD nanocomposite material for cholesterol sensor was proposed. N-GQDs were prepared through the hydrothermal technique, and CIS/ZnS QDs were synthesized via a simple aqueous solution method. The HRTEM images of N-GQDs and CIS/ZnS QDs produced mean diameters of approximately 5.30–9.30 and 3.18–4.57 nm, respectively. The NG/CIS/ZnS QD nanocomposite for nonenzymatic cholesterol optical biosensor was used based on the quenching of PL intensity in the range of 0.312–5 mM cholesterol with high selectivity and stability at detection limits of 0.222 mM.
4. Materials and Methods
4.1. Materials
Copper chloride (99%), indium(III) chloride tetrahydrate (97%), and 3-mercaptopropionic acid (MPA) (99%) were supplied by Acros Organics. Sodium sulfide and phosphate buffer solution of pH 7 were obtained from Chem-Lab. Citric acid and Triton X-100 were purchased from Luba-Chem. Urea was supplied by El-Nasr. Zinc acetate dihydrate (98.5%) was supplied by Oxford Instruments. Ethanol (99.9%) was supplied by International Company for Supply and Medical Industries. Isopropanol (99.5%) was obtained from Al-Alamia. Hydrochloric acid was purchased from Fischer Company. Sodium hydroxide was supplied by El-Nasr, and cholesterol standard was received from Vitroscent.
4.2. Synthesis of CIS/ZnS QDs
CIS/ZnS QDs were synthesized by the following steps. Briefly, 0.6 mL of InCl3·4H2O stock solution (0.1 M) was dissolved in 10 mL of deionized water with 1 mL of MPA (4.5 M). In a separate flask containing CuCl2 (0.1 mL, 0.1 M) with 0.5 mL of MPA (4.5 M) dissolved in 10 mL of deionized water, pH was adjusted to 9.0 using 1 M NaOH to remove turbidity of the solution. The solution of CuCl2 was injected into InCl3 solution with continuous stirring for 2 min to produce a 1:6 molar ratio of Cu2+ to In3+. Subsequently, Na2S solution (0.5 mL, 0.04 mmol) was injected into the above mixture at room temperature with vigorous stirring for 5 min. The latter mixture was heated to 90 °C for 30 min and then 1 mL of 0.04 M zinc acetate dihydrate was dropwise added to this mixture under continuous stirring for another 5 min to obtain CIS/ZnS QDs. The color of the reaction mixture progressively changed from yellowish to brown.
4.3. Preparation of N-GQDs
N-GQDs were synthesized using 3.15 g of citric acid as a source of carbon and 2.7 g of urea as a source of nitrogen dissolved in 75 mL of deionized water with stirring for 5 min to form a clear solution. Then, the solution was transferred into a 250 mL Teflon-lined stainless steel autoclave and heated to 160 °C in an electric oven for 4 h.
4.4. Preparation of NG/CIS/ZnS QDs
First, N-GQDs were separated and purified to powder form by adding ethanol with a ratio of 1:2 in a centrifuge at 6000 rpm for 10 min. Three times washing and drying in a vacuum oven at 60 °C were performed to obtain a fine powder (10 mg/mL). Second, CIS QDs were dissolved in isopropanol in a ratio of 1:3, centrifuged at 6500 for 15 min, and dried in air to obtain a powder (0.448 mg/mL). NG/CIS/ZnS QDs were prepared physically at four different ratios of N-GQDs and CIS/ZnS QDs (1:0.5, 1:1, 1:2, 1:3) and shaking for 30 min.
4.5. Characterization Techniques
To study the structural, crystalline, and morphological properties of CIS/ZnS QDs and N-GQDs and their nanocomposites, FTIR, Raman, UV–vis, and fluorescence spectroscopies; XRD; and HRTEM were investigated. The structural identifications of CIS/ZnS QDs and N-GQDs and their nanocomposites were confirmed by Fourier transform infrared spectroscopy (Spectrum BX 11 infrared spectrometer FTIR LX 18-5255, PerkinElmer). To obtain the FTIR spectra, each sample of the QDs and the nanocomposite in powder form were ground with KBr powder. The Raman spectra of N-GQD and NG/CIS/ZnS QD nanocomposites were recorded using a microscope equipped with triple monochromatic combined with a Peltier cooled charge-coupled device detector system (Senterra Bruker). The spectra were acquired in the back-scattering geometry, while the 532 nm line of an argon laser source was focused on the sample for excitation at a power of 2 mW. The phonon frequencies were obtained by fitting Lorentzian line shapes to the experimental peaks after background subtraction.
The crystallography of the prepared CIS/ZnS QDs and N-GQDs and their nanocomposites were investigated using the XRD technique (X-ray 7000, Shimadzu, Japan; copper characteristic wavelength = 1.54 A°). The 2θ angles of the diffractometer were scanned from 10 to 80° at a scan rate of 10°/min.
The surface charges of N-GQD, CIS/ZnS QD, and surface charges of NG/CIS/ZnS QD nanocomposites were estimated by ζ-potential measurement (Nano ZS/ZEN3600 Zetasizer). Suspensions were placed in a universal folded capillary cell equipped with platinum electrodes. The ζ-potential values were calculated from the mean electrophoretic mobility, as determined by laser Doppler anemometry (LDA).
The morphological property was studied using HRTEM images and collected using a JEOL JEM 2100F microscope at an accelerating voltage of 200 kV. Samples for HRTEM were prepared by dispersing the dried powder of the QDs in ethanol and allowing a drop to dry onto a 3 mm diameter carbon-coated fine copper grid. Subsequently, the grid was dried in air before imaging.
UV–vis spectra in the range of 200–900 nm for 5 μL of NGQDs diluted with 3 mL of DI water and 200 μL of CIS/ZnS QDs diluted with 3 mL of DI water to determine the absorbance of materials were recorded by a UV–visible spectrometer (Thermo Scientific Evolution 300). A PerkinElmer LS 55 fluorescence spectrophotometer was used to study the emission spectra of the prepared QDs. All of the measurements were conducted at room temperature. Both the excitation and emission slits were fixed at 10.0 nm.
4.6. Detection of Cholesterol
For detection study, a 5 mM stock solution of cholesterol was prepared by dissolving standard cholesterol in a mixture of Triton X-100, isopropanol, and 0.1 M phosphate-buffered saline (PBS) (1:1:8 v/v). The standard cholesterol solutions were prepared by proper dilution of the stock (0.312–5 mM).27 NG/CIS/ZnS QD (20 μL) was added to 1 mL of the buffer with different concentrations of cholesterol (0.312–5 mM) and incubated at room temperature for 20 min. To examine the selectivity of the NG/CIS/ZnS QD for cholesterol, similar experiments were conducted with different analytes that act as interfering agents with cholesterol. These analytes were nickel chloride, copper chloride, magnesium chloride, calcium chloride, zinc sulfide, and glucose with a concentration of 1.5 mM. For optimization of analytical parameters, the slope of the calibration curve was used based on eq 1.30
| 1 |
where F° and F represent the PL intensity of NG/CIS/ZnS QDs in the absence and presence of cholesterol, respectively; a and b refer to the slope and intercept of the calibration curve, respectively; and Cchol is the concentration of cholesterol. The quantum efficiency (QE) was calculated using eq 2.31
| 2 |
The limit of detection (LOD) of cholesterol was estimated using eq 3.30
| 3 |
where SD and S are the standard deviation and slope, respectively.
Acknowledgments
The authors thank the Nanotechnology and Composite Materials Department, Institute of New Materials and Advanced Technology, City of Scientific Research and Technological Applications, for help.
The authors declare no competing financial interest.
References
- Mukai K. Semiconductor quantum dots for future optical applications. J. Nanosci. Nanotechnol. 2014, 14, 2148–2156. 10.1166/jnn.2014.8608. [DOI] [PubMed] [Google Scholar]
- Novikova A. S.; Ponomaryova S.; Goryacheva I. Y. Fluorescent AgInS/ZnS quantum dots microplate and lateral flow immunoassays for folic acid determination in juice samples. Microchim. Acta. 2020, 187, 427. 10.1007/s00604-020-04398-1. [DOI] [PubMed] [Google Scholar]
- Raevskaya A.; Rozovik O.; Novikova A.; Selyshchev O.; Stroyuk O. V.; Dzhagan V.; Goryacheva I.; Gaponik N.; Zahn D. R. T.; Eychmuller A. Luminescence and photoelectrochemical properties of size-selected aqueous copper-doped Ag–In–S quantum dots. RSC Adv. 2018, 8, 7550. 10.1039/C8RA00257F. [DOI] [PMC free article] [PubMed] [Google Scholar]
- Gerischer H.; Michel-Beyerle M. E.; Rebentrost F.; Tributsch H. Sensitization of charge injection into semiconductors with large band gap. Electrochim. Acta. 1968, 13, 1509–1515. 10.1016/0013-4686(68)80076-3. [DOI] [Google Scholar]
- Pan Z.; Rao H.; Mora-Seró I.; Bisquert J.; Zhong X. Quantum dot-sensitized solar cells. Chem. Soc. Rev. 2018, 47, 7659–7702. 10.1039/C8CS00431E. [DOI] [PubMed] [Google Scholar]
- Martynenko I. V.; Litvin A. P.; Purcell-Milton F.; Baranov A. V.; Fedorov A. V.; Gun’Ko Y. K. Application of semiconductor quantum dots in bioimaging and biosensing. J. Mater. Chem. B 2017, 5, 6701–6727. 10.1039/C7TB01425B. [DOI] [PubMed] [Google Scholar]
- Heydari N.; Ghorashi S. M. B.; Han W.; Park H. H.. Quantum Dot-Based Light Emitting Diodes (QDLEDs), New Progress. Quantum-Dot Based Light-Emitting Diodes; 2017; p 25. http://dx.doi.org /10.5772/intechopen.690142. [Google Scholar]
- Koyun A.; Ahlatcolu E.; Koca Y.; Kara S.. Biosensors and their Principles. A Roadmap of Biomedical Engineers and Milestones, 2012; pp 117–142. [Google Scholar]
- Darsanaki R. K.; Azizzadeh A.; Nourbakhsh M.; Raeisi G.; Aliabadi M. A. Biosensors: functions and applications. J. Biol. Today’s World 2013, 2, 53–61. [Google Scholar]
- Chen F.; Yao Y.; Lin H.; Hu Z.; Hu W.; Zang Z.; Tang X. Synthesis of CuInZnS quantum dots for cell labeling applications. Ceram. Int. 2018, 44, S34–S37. 10.1016/j.ceramint.2018.08.276. [DOI] [Google Scholar]
- Zhang B.; Wang Y.; Yang C.; Hu S.; Gao Y.; Zhang Y.; Yong K. T. The composition effect on the optical properties of aqueous synthesized Cu–In–S and Zn–Cu–In–S quantum dot nanocrystals. Phys. Chem. Chem. Phys. 2015, 17, 25133–25141. 10.1039/C5CP03312H. [DOI] [PubMed] [Google Scholar]
- Park J. C.; Nam Y. S. Controlling surface defects of non-stoichiometric copper-indium-sulfide quantum dots. J. Colloid Interface Sci. 2015, 460, 173–180. 10.1016/j.jcis.2015.08.037. [DOI] [PubMed] [Google Scholar]
- Park J.; Kim S. W. CuInS2/ZnS core/shell quantum dots by cation exchange and their blue-shifted photoluminescence. J. Mater. Chem. 2011, 21, 3745–3750. 10.1039/c0jm03194a. [DOI] [Google Scholar]
- Zhu S.; Song Y.; Zhao X.; Shao J.; Zhang J.; Yang B. The photoluminescence mechanism in carbon dots (graphene quantum dots, carbon nanodots, and polymer dots): current state and future perspective. Nano Res. 2015, 8, 355–381. 10.1007/s12274-014-0644-3. [DOI] [Google Scholar]
- Qu D.; Zheng M.; Du P.; Zhou Y.; Zhang L.; Li D.; Tan H.; Zhao Z.; Xie Z.; Sun Z. Highly luminescent S, N co-doped graphene quantum dots with broad visible absorption bands for visible light photocatalysts. Nanoscale 2013, 5, 12272–12277. 10.1039/c3nr04402e. [DOI] [PubMed] [Google Scholar]
- Tang L.; Ji R.; Li X.; Bai G.; Liu C. P.; Hao J.; Lin J.; Jiang H.; Teng K. S.; Yang Z.; Lau S. P. Deep ultraviolet to near-infrared emission and photoresponse in layered N-doped graphene quantum dots. ACS Nano 2014, 8, 6312–6320. 10.1021/nn501796r. [DOI] [PubMed] [Google Scholar]
- Zhang W.; Zheng J.; Tan C.; Lin X.; Hu S.; Chen J.; You X.; Li S. Designed self-assembled hybrid Au@CdS core– shell nanoparticles with negative charge and their application as highly selective biosensors. J. Mater. Chem. B 2015, 3, 217. 10.1039/C4TB01713G. [DOI] [PubMed] [Google Scholar]
- Mokwebo K. V.; Oluwafemi O. S.; Arotiba O. A. An Electrochemical Cholesterol Biosensor Based on A CdTe/CdSe/ZnSe Quantum Dots—Poly (Propylene Imine) Dendrimer Nanocomposite Immobilisation Layer. Sensors 2018, 18, 3368. 10.3390/s18103368. [DOI] [PMC free article] [PubMed] [Google Scholar]
- Alagappan M.; Immanuel S.; Sivasubramanian R.; Kandaswamy A. Development of cholesterol biosensor using Au nanoparticles decorated f-MWCNT covered with polypyrrole network. Arabian J. Chem. 2020, 13, 2001–2010. 10.1016/j.arabjc.2018.02.018. [DOI] [Google Scholar]
- Paulazo M. A.; Sodero A. O. Analysis of cholesterol in mouse brain by HPLC with UV detection. PloS one. 2020, 15, e0228170 10.1371/journal.pone.0228170. [DOI] [PMC free article] [PubMed] [Google Scholar]
- Lian K.; Zhang P.; Wang W.; Dai T.; Li L. Determination of Total Cholesterol in Serum by Gas Chromatography-Mass Spectrometry. Asian J. Chem. 2014, 26, 2646–2648. 10.14233/ajchem.2014.15780. [DOI] [Google Scholar]
- Sperry W. M.; Brand F. C. The colorimetric determination of cholesterol. J. Biol. Chem. 1943, 150, 315–324. [Google Scholar]
- Mashkour M. S.; Abd N.; Almatori A.; Brbber A. M. Spectrophotometric Determination of Cholesterol by Using Procaine as Coupling Reagent. Int. J. ChemTech Res. 2017, 10, 630–640. [Google Scholar]
- Lan X.; Liu J.; Liu Y.; Luo X.; Lu J.; Ni X. Fluorimetric determination of cholesterol in hypercholesterolemia serum, Optics in Health Care and Biomedical Optics: Diagnostics and Treatment II. Proc. of SPIE, Bellingham 2005, 5630, 322–327. [Google Scholar]
- Hong L.; Liu A. L.; Li G. W.; Chen W.; Lin X. H. Chemiluminescent cholesterol sensor based on peroxidase-like activity of cupric oxide nanoparticles. Biosens. Bioelectron. 2013, 43, 1–5. 10.1016/j.bios.2012.11.031. [DOI] [PubMed] [Google Scholar]
- Xu S.; Wang Y.; Zhou D.; Kuang M.; Fang D.; Yang W.; Wei S.; Ma L. A novel chemiluminescence sensor for sensitive detection of cholesterol based on the peroxidase-like activity of copper nanoclusters. Sci. Rep. 2016, 6, 39157 10.1038/srep39157. [DOI] [PMC free article] [PubMed] [Google Scholar]
- Stewart A. J.; Reilly E. J. O.; Moriarty R. D.; Bertoncello P.; Keyes T. E.; Forster R. J.; Dennany L. A cholesterol biosensor based on the NIR electrogenerated-chemiluminescence (ECL) of water-soluble CdSeTe/ZnS quantum dots. Electrochim. Act. 2015, 157, 8–14. 10.1016/j.electacta.2015.01.073. [DOI] [Google Scholar]
- Hu Y.; Geng X.; Zhang L.; Huang Z.; Ge J.; Li Z. Nitrogen-doped carbon dots mediated fluorescent on-off assay for rapid and highly sensitive pyrophosphate and alkaline phosphatase detection. Sci. Rep. 2017, 7, 5849 10.1038/s41598-017-06356-z. [DOI] [PMC free article] [PubMed] [Google Scholar]
- Zhang R.; Adsetts J. R.; Nie Y.; Sun X.; Ding Z. Electrochemiluminescence of nitrogen-and sulfur-doped graphene quantum dots. Carbon 2018, 129, 45–53. 10.1016/j.carbon.2017.11.091. [DOI] [Google Scholar]
- Shehab M.; Ebrahim S.; Soliman M. Graphene quantum dots prepared from glucose as optical sensor for glucose. J. Lumin. 2017, 184, 110–116. 10.1016/j.jlumin.2016.12.006. [DOI] [Google Scholar]
- Ebrahim S.; Shokry A.; Khalil M. M. A.; Ibrahim H.; Soliman M. Polyaniline/Ag nanoparticles/graphene oxide nanocomposite fluorescent sensor for recognition of chromium (VI) ions. Sci. Rep. 2020, 10, 13617 10.1038/s41598-020-70678-8. [DOI] [PMC free article] [PubMed] [Google Scholar]
- Zhang F.; He X.; Ma P.; Sun Y.; Wang X.; Song D. Rapid aqueous synthesis of CuInS/ZnS quantum dots as sensor probe for alkaline phosphatase detection and targeted imaging in cancer cells. Talanta 2018, 189, 411–417. 10.1016/j.talanta.2018.07.031. [DOI] [PubMed] [Google Scholar]
- Kuo N.-J.; Chen Y. S.; Wu C. W.; Huang C. Y.; Chan Y. H.; Chen I. W. P. One-pot synthesis of hydrophilic and hydrophobic n-doped graphene quantum dots via exfoliating and disintegrating graphite flakes. Sci. Rep. 2016, 6, 30426 10.1038/srep30426. [DOI] [PMC free article] [PubMed] [Google Scholar]
- Li Y.; Zhao Y.; Cheng H.; Hu Y.; Shi G.; Dai L.; Qu L. Nitrogen-doped graphene quantum dots with oxygen-rich functional groups. J. Am. Chem. Soc. 2012, 134, 15–18. 10.1021/ja206030c. [DOI] [PubMed] [Google Scholar]
- Xu X.; Gao F.; Bai X.; Liu F.; Kong W.; Li M. Tuning the photoluminescence of graphene quantum dots by photochemical doping with nitrogen. Materials 2017, 10, 1328. 10.3390/ma10111328. [DOI] [PMC free article] [PubMed] [Google Scholar]
- Chen Y.; He X.; Zhao X.; Song M.; Gu X. Preparation and characterization of copper indium disulfide films by facile chemical method. Mater. Sci. Eng. B 2007, 139, 88–94. 10.1016/j.mseb.2007.01.036. [DOI] [Google Scholar]
- Ilaiyaraja P.; Rakesh B.; Das T. K.; Mocherla P. S.; Sudakar C. CuInS2 quantum dot sensitized solar cells with high VOC≈ 0.9 V achieved using microsphere-nanoparticulate TiO2 composite photoanode. Sol. Energy Mater. Sol. Cells 2018, 178, 208–222. 10.1016/j.solmat.2018.01.018. [DOI] [Google Scholar]
- Jin L.; Wang Y.; Yan F.; Zhang J.; Zhong F. The Synthesis and Application of Nitrogen-Doped Graphene Quantum Dots on Brilliant Blue Detection. J. Nanomater. 2019, 2019, 1471728 10.1155/2019/1471728. [DOI] [Google Scholar]
- Hu C.; Liu Y.; Yang Y.; Cui J.; Huang Z.; Wang Y.; Yang L.; Wang H.; Xiao Y.; Rong J. One-step preparation of nitrogen-doped graphene quantum dots from oxidized debris of graphene oxide. J. Mater. Chem. B 2013, 1, 39–42. 10.1039/C2TB00189F. [DOI] [PubMed] [Google Scholar]
- Bian H.; Wang Q.; Yang S.; Yan C.; Wang H.; Liang L.; Jin Z.; Wang G.; Liu S. F. Nitrogen-doped graphene quantum dots for 80% photoluminescence quantum yield for inorganic γ-CsPbI3 perovskite solar cells with efficiency beyond 16%. J. Mate.r Chem. A 2019, 7, 5740–5747. 10.1039/C8TA12519H. [DOI] [Google Scholar]
- Chuang P. H.; Lin C. C.; Liu R. S. Emission-tunable CuInS2/ZnS quantum dots: structure, optical properties, and application in white light-emitting diodes with high color rendering index. ACS Appl. Mater. Interfaces 2014, 6, 15379–15387. 10.1021/am503889z. [DOI] [PubMed] [Google Scholar]
- Chen Y.; Li S.; Huang L.; Pan D. Green and facile synthesis of water-soluble Cu–In–S/ZnS core/shell quantum dots. Inorg. Chem. 2013, 52, 7819–7821. 10.1021/ic400083w. [DOI] [PubMed] [Google Scholar]
- Song W. S.; Kim J. H.; Lee J. H.; Lee H. S.; Jang H. S.; Yang H. Utilization of LiSrPO4: Eu phosphor and Cu- In- S quantum dot for fabrication of high color rendering white light-emitting diode. Mater. Lett. 2013, 92, 325–329. 10.1016/j.matlet.2012.10.110. [DOI] [Google Scholar]
- Jiang Y.; Zheng L.; Zheng H.; Wu F.; Shao L.; Zheng P.; Zhang Y.; et al. Ultra-highly fluorescent N doped carbon dots-CdTe QDs nanohybrids with excitation-independent emission in the blue-violet region. RSC Adv. 2018, 8, 35700–35705. 10.1039/C8RA06326E. [DOI] [PMC free article] [PubMed] [Google Scholar]
- Liu Y.; Tang X.; Deng M.; Cao Y.; Li Y.; Zheng H.; Li F.; Yan F.; Lan T.; Shi L.; Gao L.; Huang L.; Zhu T.; Lin H.; Bai Y.; Qu D.; Huang X.; Qiu F. Nitrogen doped graphene quantum dots as a fluorescent probe for mercury (II) ions. Microchim. Acta. 2019, 186, 140 10.1007/s00604-019-3249-4. [DOI] [PubMed] [Google Scholar]
- Zheng B.; Chen Y.; Li P.; Wang Z.; Cao B.; Qi F.; Liu J.; Qiu Z.; Zhang W. Ultrafast ammonia-driven, microwave-assisted synthesis of nitrogen-doped graphene quantum dots and their optical properties. Nanophotonics 2017, 6, 259. 10.1515/nanoph-2016-0102. [DOI] [Google Scholar]
- Yang L.; Antanovich A.; Prudnikau A.; Taniya O. S.; Grzhegorzhevskii K. V.; Zelenovskiy P.; Terpinskaya T.; Tang J.; Artemyev M. Highly luminescent Zn–Cu–In–S/ZnS core/gradient shell quantum dots prepared from indium sulfide by cation exchange for cell labeling and polymer composites. Nanotechnology 2019, 30, 395603 10.1088/1361-6528/ab2aa2. [DOI] [PubMed] [Google Scholar]
- Ali M.; El Nady J.; Ebrahim S.; Soliman M. Structural and optical properties of upconversion CuInS/ZnS quantum dots. Opt. Mater. 2018, 86, 545–549. 10.1016/j.optmat.2018.10.058. [DOI] [Google Scholar]
- Hong M.; Xuan T.; Liu J.; Jiang Z.; Chen Y.; Chen X.; Li H. Air-exposing microwave-assisted synthesis of CuInS2/ZnS quantum dots for silicon solar cells with enhanced photovoltaic performance. RSC Adv. 2015, 5, 102682–102688. 10.1039/C5RA21454H. [DOI] [Google Scholar]
- Sun L.; Li S.; Ding W.; Yao Y.; Yang X.; Yao C. Fluorescence detection of cholesterol using a nitrogen-doped graphene quantum dot/chromium picolinate complex-based sensor. J. Mater. Chem. B 2017, 5, 9006–9014. 10.1039/C7TB02037F. [DOI] [PubMed] [Google Scholar]
- Li H.-J.; Sun X.; Xue F.; Ou N.; Sun B. W.; Qian D. J.; Chen M.; Wang D.; Yang J.; Wang X. Redox induced fluorescence on–off switching based on nitrogen enriched graphene quantum dots for formaldehyde detection and bioimaging. ACS Sustainable Chem. Eng. 2018, 6, 1708–1716. 10.1021/acssuschemeng.7b02941. [DOI] [Google Scholar]
- Hasan M. T.; Gonzalez-Rodriguez R.; Ryan C.; Pota K.; Green K.; Coffer J. L.; Naumov A. V. Nitrogen-doped graphene quantum dots: Optical properties modification and photovoltaic applications. Nano Res. 2019, 12, 1041–1047. 10.1007/s12274-019-2337-4. [DOI] [Google Scholar]
- Priyadarshini E.; Rawat K. Au@ carbon dot nanoconjugates as a dual mode enzyme-free sensing platform for cholesterol. J. Mater. Chem. B 2017, 5, 5425–5432. 10.1039/C7TB01345K. [DOI] [PubMed] [Google Scholar]
- Labeb M.; Sakr A.-H.; Soliman M.; Abdel-Fettah T. M.; Ebrahim S. Effect of capping agent on selectivity and sensitivity of CdTe quantum dots optical sensor for detection of mercury ions. Opt. Mater. 2018, 79, 331–335. 10.1016/j.optmat.2018.03.060. [DOI] [Google Scholar]
- Gu J.; Zhang X.; Pang A.; Yang J. Facile synthesis and photoluminescence characteristics of blue-emitting nitrogen-doped graphene quantum dots. Nanotechnology 2016, 27, 165704 10.1088/0957-4484/27/16/165704. [DOI] [PubMed] [Google Scholar]
- Lin L.; Rong M.; Lu S.; Song X.; Zhong Y.; Yan J.; Wang Y.; Chen X. A facile synthesis of highly luminescent nitrogen-doped graphene quantum dots for the detection of 2, 4, 6-trinitrophenol in aqueous solution. Nanoscale 2015, 7, 1872–1878. 10.1039/C4NR06365A. [DOI] [PubMed] [Google Scholar]
- El Nady J.; Ali M.; Kamel O. A.; Ebrahim S.; Soliman M. Room temperature synthesis of aqueous ZnCuInS/ZnS quantum dots. J. Dispersion Sci. Technol. 2019, 41, 1956–1962. 10.1080/01932691.2019.1645022. [DOI] [Google Scholar]
- Yan R.; Zhang W.; Wu W.; Dong X.; Wang Q.; Fan J. Optical spectroscopy reveals transition of CuInS2/ZnS to CuxZn1– xInS2/ZnS: Cu alloyed quantum dots with resultant double-defect luminescence. APL Mater. 2016, 4, 126101 10.1063/1.4971353. [DOI] [Google Scholar]
- Liang Y.; Lu C.; Ding D.; Zhao M.; Wang D.; Hu C.; Tang Z.; et al. Capping nanoparticles with graphene quantum dots for enhanced thermoelectric performance. Chem. Sci. 2015, 6, 4103–4108. 10.1039/C5SC00910C. [DOI] [PMC free article] [PubMed] [Google Scholar]
- Rohom A. B.; Londhe P. U.; Chaure N. B. The effect of pH and selenization on the properties of CuInSe2 thin films prepared by electrodeposition technique for device applications. J. Solid State Electrochem. 2015, 19, 201–210. 10.1007/s10008-014-2582-0. [DOI] [Google Scholar]
- Zhong Y.; Zhang H.; Pan D.; Wang L.; Zhong X. Graphene quantum dots assisted photovoltage and efficiency enhancement in CdSe quantum dot sensitized solar cells. J. Energy Chem. 2015, 24, 722–728. 10.1016/j.jechem.2015.10.006. [DOI] [Google Scholar]
- Chen H.; Li W.; Zhao P.; Nie Z.; Yao S. A CdTe/CdS quantum dots amplified graphene quantum dots anodic electrochemiluminescence platform and the application for ascorbic acid detection in fruits. Electrochim. Acta. 2015, 178, 407–413. 10.1016/j.electacta.2015.08.015. [DOI] [Google Scholar]
- Huang C.-P.; Li Y. K.; Chen T. M. A highly sensitive system for urea detection by using CdSe/ZnS core-shell quantum dots. Biosens. Bioelectron 2007, 22, 1835–1838. 10.1016/j.bios.2006.09.003. [DOI] [PubMed] [Google Scholar]
- Luan W.; Yang H.; Wan Z.; Yuan B.; Yu X.; Tu S. T. Mercaptopropionic acid capped CdSe/ZnS quantum dots as fluorescence probe for lead (II). J. Nanopart. Res. 2012, 14, 762. 10.1007/s11051-012-0762-3. [DOI] [Google Scholar]
- Shokry A.; Khalil M. M. A.; Ibrahim H.; Soliman M.; Ebrahim S. Highly Luminescent ternary nanocomposite of polyaniline, Silver nanoparticles and Graphene oxide Quantum Dot. Sci Rep. 2019, 9, 16984 10.1038/s41598-019-53584-6. [DOI] [PMC free article] [PubMed] [Google Scholar]
- Ortiz S. N. C.; Ospino E. M.; Cabanzo R. Spectroscopy characterization and quantum yield determination of quantum dots. J. Phys.: Conf. Ser. 2016, 687, 012097 10.1088/1742-6596/687/1/012097. [DOI] [Google Scholar]
- Saha M.; Das S. Fabrication of a nonenzymatic cholesterol biosensor using carbon nanotubes from coconut oil. J. Nanostruct. Chem. 2014, 4, 94 10.1007/s40097-014-0094-1. [DOI] [Google Scholar]
- Morzycki J. W.; Sobkowiak A. Electrochemical oxidation of cholesterol. Beilstein J. Org. Chem. 2015, 11, 392–402. 10.3762/bjoc.11.45. [DOI] [PMC free article] [PubMed] [Google Scholar]
- Khayyat S. A.; Ansari S. G.; Umar A. Glucose sensor based on copper oxide nanostructures. J. Nanosci. Nanotechnol. 2014, 14, 3569–3574. 10.1166/jnn.2014.7918. [DOI] [PubMed] [Google Scholar]
- Yang J.; Lee H.; Cho M.; Nam J.; Lee Y. Nonenzymatic cholesterol sensor based on spontaneous deposition of platinum nanoparticles on layer-by-layer assembled CNT thin film. Sens. Actuators, B 2012, 171–172, 374–379. 10.1016/j.snb.2012.04.070. [DOI] [Google Scholar]
- Ankireddy S. R.; Kim J. Selective detection of dopamine in the presence of ascorbic acid via fluorescence quenching of InP/ZnS quantum dots. Int. J. Nanomedicine 2015, 10, 113. 10.2147/IJN.S88388. [DOI] [PMC free article] [PubMed] [Google Scholar]
- Kim D.-Y.; Shinde S.; Ghodake G. Colorimetric detection of magnesium (II) ions using tryptophan functionalized gold nanoparticles. Sci. Rep. 2017, 7, 3966 10.1038/srep43596. [DOI] [PMC free article] [PubMed] [Google Scholar]


