Abstract
Raman spectra are molecular structure-specific and hence are employed in applications requiring chemical identification. The advent of efficient handheld and smartphone-based Raman instruments is promoting widespread applications of the technique, which often involve less trained end users. Software modules that enable spectral library searches based on spectral pattern matching is an essential part of such applications. The Raman spectrum recorded by end users will naturally have varying levels of signal to noise (SN), baseline fluctuations, etc., depending on the sample environment. Further, in biological, forensic, food, pharmaceuticals, etc., fields where a vast amount of Raman spectral data is generated, careful removal of background is often impossible. In other words, a 100% match between the library spectrum and user input cannot be often guaranteed or expected. Often, such influences are discounted upon developing mathematical methods for general applications. In this manuscript, we carefully examine how such effects would determine the results of spectral similarity-based library search. We show that several popular mathematical spectral matching approaches give incorrect results under the influence of small changes in the baseline and/or the noise. We also discuss the points to be carefully considered while generating a spectral library. We believe our results will be a guiding note for developing applications of Raman spectroscopy that uses a standard spectral library and mathematical spectral matching.
Introduction
Analytical applications of Raman spectroscopy are on the rise recently.1 Raman spectroscopy is now extensively used in environmental applications,2 quality check of food products,3,4 drug control,5 forensic purposes,6 archaeology,7 etc., particularly because of the recent developments in affordable portable spectrometers. With the advent of smartphone-integrated Raman devices,8 cloud computing-based data analysis will be demanded in the near future. Raman spectra are molecular structure-specific and hence are effective in chemical identification. Chemical identification can be performed by comparing the Raman spectrum of the test sample with the Raman spectra in a spectral library of known compounds. Suitable mathematical spectral matching methods are necessary for spectral library-based chemical analysis. Several mathematical methods such as squared correlation, Pearson’s correlation,9,10 Euclidean distances,11 relative spectral discriminatory probability,12 relative spectral discriminatory entropy,12,13 etc., are currently used for spectral matching applications. These methods had been tested on model spectral profiles and are reliable in distinguishing differences in spectral pattern.10 However, when it comes to real-world applications, spectral matching is often not straightforward. The environment of the reference sample, i.e., conditions under which one records the reference spectrum (often pure chemicals), and that of the test sample (collected from another environment) often will not be the same, for instance, the microplastics collected from the ocean, blood samples from a crime scene, etc.2,5 Environmental factors affect spectral characteristics, such as, signal-to-noise ratio (SNR), baseline, etc. Further, it is also possible that each spectrum in the reference spectral library (may take years to create) itself may have varying levels of background/noise. Hence, it is necessary to investigate the efficiency of the spectral matching methods under real situations.
We have constructed a Raman spectral library (called DB here) of 47 biologically relevant compounds. Majority of these compounds are isolated from bio-organisms and hence represent a real scenario. We have performed spectral matching analysis using input spectra with different SNR and baselines. Further, we have included spectra of structural analogues in the DB, which are only marginally different from each other. The ability of spectral matching methods to distinguish spectra from structural analogues has also been tested. In all the abovementioned spectral matching methods, the similarity of the search spectrum to the library spectrum can be expressed in terms of a range of values within specific limits. A search algorithm can then be formulated to pick the best matching spectrum based on the value (we call here similarity). For instance, Pearson’s correlation is one of the widely used linear correlation methods, where perfectly identical spectra give a Pearson’s correlation coefficient value of 1 (i.e., similarity = 1) while a value of −1 indicates a complete mismatch. The analysis is rather effortless when the search spectrum and the library spectrum are baseline free and with high SNR. However, we show in this manuscript that these mathematical methods could fail under the influence of varying background and SNR. We also suggest points to critically consider when developing applications based on spectral library.
Spectral Matching Methods: Background
Pearson’s Correlation Coefficient (PC)
PC is a linear correlation method frequently used for pixel to pixel correlation of images to investigate colocalization of molecules, spatiotemporal behavior, etc.15,16 It is also used to compare similarities between two Raman spectra since essentially a spectrum is intensity at different pixels of CCD. Pearson’s correlation coefficient (r; called similarity here)8,9 has been calculated using the following equation:
 |
1 |
where Θ represents a spectrum in the DB and s is a search input spectrum. n is the number of datapoints in each spectrum. The wavenumber axis of the spectra being compared should exactly be the same. A perfect match between Θ and s gives r = 1 and dissimilar Θ and s spectra gives an r value closer to zero.
Unit Normalized Euclidean Distance (UNED), Squared Euclidean Cosine (SEC), and Squared First-Difference Euclidean Cosine (SFEC)
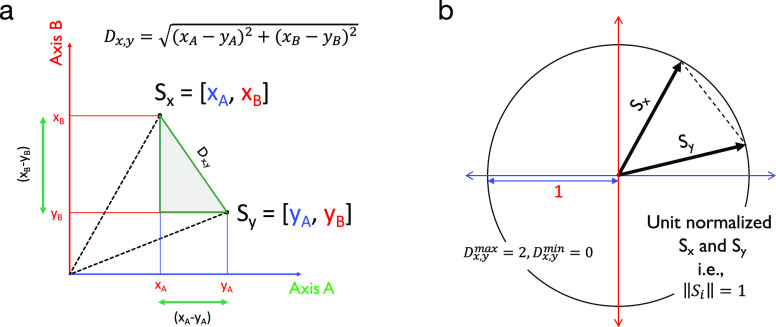
Consider two vectors Sx and Sy as shown in Figure 1 in a space defined by axes A and B. The A, B coordinates of Sx and Sy are xA, xB and yA, yB, respectively. From Figure 1, it is clear that by applying the Pythagoras theorem (shaded triangle), the distance between vectors Sx and Sy, denoted by Dx,y, can be given as
| 2 |
Figure 1.
Vectorial representation of unit normalized Euclidean distance (UNED). (a) Arriving at a formula for distance between vectors. (b) Arriving at the boundary condition for the maximum and minimum values for Dx,y when the vectors are unit normalized.
If Sx and Sy are unit normalized, i.e., ∥Si∥ = 1, then the maximum value of the distance between them can be 2 and the minimum value can be 0 (Dx,ymax = 2, Dx,y = 0). This method can be extended to an n dimensional vector such as a Raman spectrum. In that case, eq 2 becomes
| 3 |
The value of Dx,y then is a measure of similarity between the corresponding Raman spectra.
UNED gives the distance between the vectors. The angle between these vectors can also be calculated. On the basis of the Euclidean inner product formula, the cosine of the angle between Sx and Sy can be given as (called Euclidean cosine (EC))
| 4 |
The squared Euclidean cosine (SEC) can be calculated as
| 5 |
This value (eq 5) is used as the SEC in the manuscript as the measure of similarity between the spectra. For identical spectra, the SEC similarity will be 1, and for orthogonal spectra, the similarity will be zero. An extension of the SEC is the squared first-difference Euclidean cosine (SFEC), and it can be calculated using eq 6:
| 6 |
where Δs = si + 1 – si and ΔΘ = Θi + 1 – Θi. The value of (cos θ)first Diff.2 is represented as SFEC similarity. For identical spectra, the SFEC similarity will be 1, and for orthogonal spectra, the similarity will be zero.
Estimating Δrms Noise
The root mean square (rms) value of noise has been estimated from a baseline region of the spectrum where there is no Raman band present using the following equation:
| 7 |
where Ri is the intensity at a pixel of the Raman spectrum in a range of spectral region (n = 51 in the present case) where there is no Raman band and Rav is the corresponding average value. The difference in rms values (Δrms) between two spectra was estimated as follows. Consider a hypothetical spectrum R1 and an identical spectrum with a different level of noise R2. Calculate R2 – R1 for the region of interest. By using this difference spectrum as Ri in eq 7, Δrms can be calculated.
Results and Discussion
After considering several spectral matching procedures, we have selected four methods for a detailed comparative study. These methods are Pearson’s correlation (PC), squared Euclidean cosine (SEC), squared first-difference Euclidean cosine (SFEC), and unit normalized Euclidean distance (UNED). It should be noted that the boundary values (called similarity) for the perfect match and the complete mismatch are different for these methods. Perfect match should give a similarity index value of 1 in PC, SEC, and SFEC and zero in UNED. A library of 48 Raman spectra with unique spectral profiles (Supporting information S1) was constructed for the study (called database (DB)). DB includes spectra with different intensity profiles containing Raman bands with different bandwidths, which represents a real situation. The compounds used for recording Raman spectra were extracted from microorganism biocultures and purified to >95%.
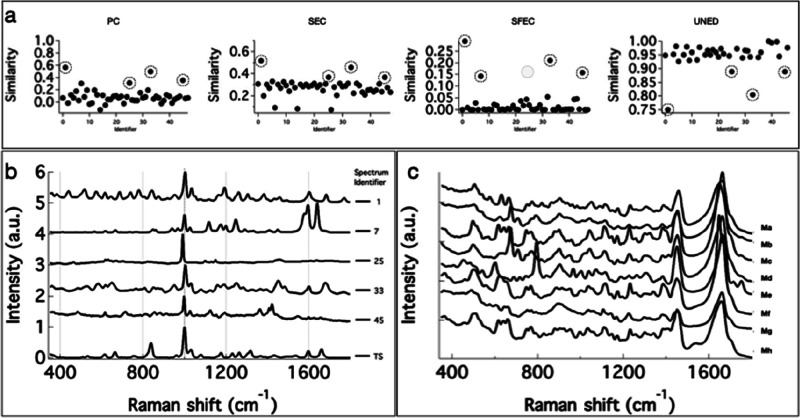
The abovementioned methods are, in fact, good at finding the matching spectrum from the DB library when the search input is one of the DB spectra itself. However, in real-world applications, the test input spectrum could have background or signal-to-noise (SN) associated differences. The effectiveness of a search method, therefore, is in its ability to eliminate of false positives and false negatives. To test false positive rejection ability, we chose a Raman spectrum of acetanilide (TS), which is absent in the DB, as a test input. The results of spectral matching are provided in Figure 2a. Several spectra in the DB have closely similar spectral profiles. In spite of this, none of the four methods predicted a false positive. A closer look at Figure 2a reveals a few interesting aspects. The partially matching spectra (circled in Figure 2a) are better separated from highly dissimilar spectra in SFEC and UNED (Figure 2a). Note that spectrum 25 (identifier in the DB; Figure 2b) does not appear in the SFEC methods but instead spectrum 7 appears. These top hits (Figure 2b) exhibit a common feature of strong band at around 1000 cm–1. Spectrum 25 (Figure 2b) does not appear in the SFEC hits owing to a very small peak shift. Other methods failed to reject this spectrum despite this characteristic difference.
Figure 2.
Results of spectral matching DB search with TS as the search input. (a) Similarity values for each DB spectrum to TS estimated using PC, SEC, SFEC, and UNED methods. (b) Spectra in the DB showing the highest similarity to search input TS. Numbers on the RHS are the identifier in the DB. The corresponding similarity values are circled in Figure 3a. (c) Raman spectra of mangromycin analogues (Ma to Mh)
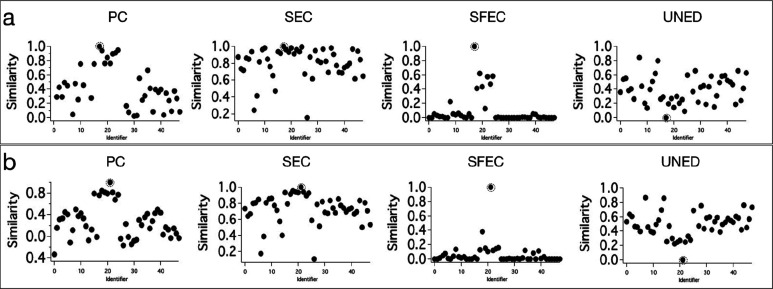
Next, it is important to see how efficient these methods are in distinguishing the Raman spectra from structurally analogues molecules (the corresponding spectra are similar). Therefore, we included the Raman spectra of eight different mangromycin analogues (Ma to Mh; Figure 2c) isolated from Lechevalieria aerocolonigenes(17) in the DB. Two among these, viz.Ma and Me, were used as search inputs to evaluate the efficiency of spectral matching methods. The results of the spectral matching analysis with Ma as the search input are provided in Figure 3a. All the four methods gave the highest similarity for the identical spectrum in the DB. However, PC, SEC, and UNED methods gave moderate separation of the true match from the spectra of analogues. The efficiency of SEC was the lowest. However, the SFEC method efficiently separated the true match, even from the spectra of analogues. A slight improvement in the performance of PC, SEC, and UNED methods can be noticed when the search input was Me (Figure 3b). This is because the Raman spectrum Me has a strong peak at 800 cm–1 and two small peaks above 1700 cm–1, which makes it slightly different from the Raman spectra of other structural analogues. Even in this case, SFEC outperformed all other methods.
Figure 3.
Results of spectral matching DB search using PC, SEC, SFEC, and UNED methods with (a) Ma (b) Me as the search input. Search hits are highlighted.
Effect of Noise and Background
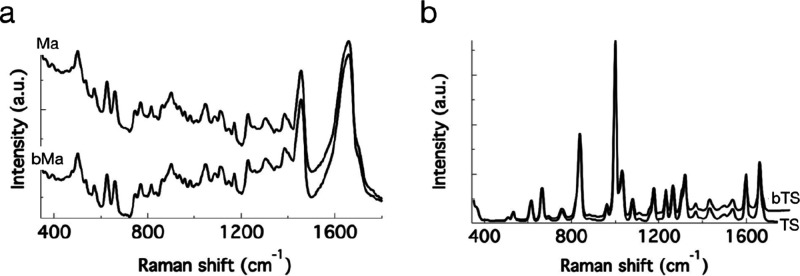
Background and noise are important features that could challenge the outcome of the spectral similarity estimates. That is, will these methods find the true target if the search input spectrum has a different background and noise level compared to the target spectrum in DB? We generated the background modified search input spectra in the following way. We generated a baseline modified input spectrum bMa by changing the background of Ma by multiplying it with a straight line having an appropriate slope (Figure 4a). In a similar way, we also generated another search spectrum, bTS, by modifying the baseline in the Raman spectrum TS (Figure 4b). The change in background is very clear from the plots.
Figure 4.
Baseline modified search input spectra: (a) bMa and the DB target Ma and (b) bTS and TS.
The results of spectral matching, with bMa as the search input, are provided in Figure 5a. The spectrum with the highest similarity (search hit) obtained in each case is given in Figure 5b. Except SFEC, all other methods gave wrong results. PC indicates that bMa has the highest similarity to Mc but not to the actual spectrum Ma. SEC and UNED hit a completely different spectrum and not even analogues. The difference in background affects the results of PC, SEC, and UNED considerably. Despite the presence of a different background in the search input, SFEC gave accurate results. Further, it has also separated the spectrum of mangromycin A (Ma) from that of other analogues. Mangromycin analogues Mb to Mh were also separated from the rest of the least matching spectra in SFEC (see also Supporting information S2).
Figure 5.
Results of spectral matching DB search with a bMa. (a) Similarity value obtained for PC, SEC, SFEC, and UNED. The best hit in each case is circled. (b) Search input spectrum bMa (filled trace) and the best hit spectrum obtained in PC, SEC, SFEC, and UNED methods. SFEC accurately hits the target in DB.
The results of spectral matching, with bTS as the search input, are provided in Supporting information S3. None of the methods gave a false positive. It can be noted that the search hits are the same for both TS and bTS in the case of the SFEC method, indicating a negligible influence of spectral background on this method.
In reality, baselines can be more complicated than a simple slope. Baselines may also originate from substrates such as glass (e.g., microscope slide). A situation representing a complex baseline has also been tested (Supporting information S4), and only SFEC gave accurate results. From the studies so far, SFEC appears better suited for spectral matching applications compared to other methods.
Another important factor that could affect search results is the noise in the spectrum. Let us first inspect the effect of noise in the test input spectrum. We have added random noise (each time a new random noise was generated throughout the study) with two different amplitudes to Ma to generate two search input spectra, viz. nMa1 and nMa2 (Figure 6a). Contrary to the expectations, all four search methods found the accurate spectrum in the DB irrespective of the levels of noise tested. The results for nMa1 are given in Figure 6b, and the results for nMa2 are given in Supporting information S5. The best hit in PC and SEC gave a similarity index of >0.93, and UNED gave a similarity index of 0.06 (a value close to zero) as expected. However, the separation of the best hit from the remaining unmatching spectra was not large. On the other hand, the best hit was much separated from the poor hits in SFEC compared to other methods. However, the SFEC similarity index was 0.004 for the best hit, much lower than the expected theoretical maximum of 1. For practical purposes, however, we could scale the highest value to 1 and scale the rest accordingly. This process assumes that the noise in the spectrum does not alter the accuracy of the top hit but only reduces the similarity value from the expected value of 1.
Figure 6.

Signal-to-noise (SN) modified search input spectra: (a) nMa1 and nMa2, with two different noise levels compared to target spectrum Ma in the DB. (b) Results of spectral matching DB search with nMa1. Similarity values obtained for PC, SEC, SFEC, and UNED. The best hits are circled (see also Supporting information S5).
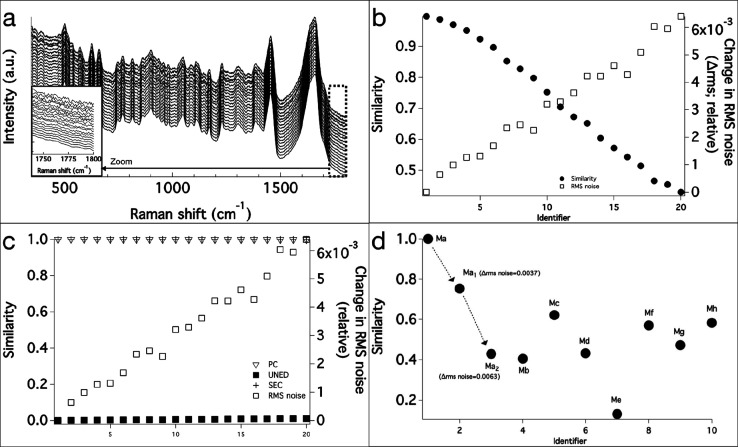
The above result prompted us to look into details of noise influence on SFEC and other methods systematically. For this purpose, 20 spectra were simulated by adding varying degrees of noise to Ma (Figure 7a). In order to give a representation of level of noise in the data, change in root mean square noise (Δrms) from the original Ma data was estimated from a specific region in the Raman spectra where no Raman bands were present (see Experimental Methods for details). These 20 spectra now constitute a test spectral library. The SFEC similarity of the original Ma to each of these 20 spectra was then estimated using Ma as the search input. The estimated SFEC similarity values and the corresponding Δrms noise for the simulated spectra are given in Figure 7b. It can be seen that noise strongly affects SFEC results. It is important to note that the noise levels introduced into the spectra were not very large (Figure 7a). It is also interesting to note that PC, SEC, and UNED methods are not equally sensitive to small levels of noise (Figure 7c).
Figure 7.
Effect of noise in the target spectra on the similarity index. (a) Twenty simulated Raman spectra with different rms noise (see main text). (b) SFEC similarity of each simulated spectrum to Ma and the corresponding rms noise in the simulated spectra. (c) Variation of similarity of each simulated spectrum estimated using PC, SEC, and UNED. Noise variation (Δrms) is also shown. (d) Effect of increasing noise in the target spectrum on the spectral matching results. Search input: Ma.
The above results indicate that the SFEC similarity value not only depends on the likeness of spectral profiles but also is heavily influenced by the noise levels in the individual DB spectra. Different spectral profiles in the DB may have slightly different noise levels. Hence, the consequence of individual spectra in the DB having varying levels of SN needs to be investigated particularly when the target spectrum in the DB has a “slightly” low SN compared to others. Intuitively, this influence will be detrimental when the DB constitutes spectra from structural analogues. In order to test this aspect, we created two search input spectra, Ma1 and Ma2, by adding different noise levels to the DB target spectrum Ma. The spectrum Ma1 has a Δrms noise of 0.0037, and Ma2 has a Δrms noise of 0.0063 higher than the original Ma. Then, we constituted a new library of 10 spectra: Ma to Mh, Ma1 and Ma2, where Ma to Mh were with comparable noise levels. When the search input Ma is identical to the library spectrum, SFEC should give a similarity value of 1. However, we found that the SFEC similarity value dropped to 0.75 for Ma1 and 0.43 for Ma2. It is important to note that, in the case of Ma2, the SFEC similarity of the target spectrum falls below that of the analogues resulting in a wrong search hit. The SFEC method is very sensitive to the noise difference between the constituent spectra in a DB. This raises a question: why the higher noise levels in the search input does not affect the accuracy of the search results in SFEC while a relatively small level of Δrms in the target spectrum is detrimental? The reason is that the noise in the search input equally affects each individual pair (Θ and s; eq 6). On the other hand, when one DB spectrum has a poorer SN, the similarity calculated for that pair will only be affected (eq 6).
A case where the test input spectrum having both different background and noise was also tested. As expected, only SFEC gave accurate results (Supporting information S6). However, the similarity index was much lower than 1.
Conclusions
Spectral matching is an important part of developing analytical applications of Raman spectroscopy.13,18,19 Raman spectral library presents a unique case differently from other spectral libraries. It is very difficult to remove the background and noise contributions from the spectrum: if arbitrary background removal is performed, it will bring subjective variations to the spectral profile. We have compared the efficiencies of four different mathematical methods toward Raman spectral matching applications by carefully evaluating the effect of baseline fluctuations and noise. The main conclusions from the study are listed below:
-
a)
PC-, SEC-, and UNED-based methods cannot be trusted for practical spectral matching applications primarily because they fail under the influence of baseline fluctuations.
-
b)
SFEC is a suitable method for spectral matching applications. However, it is not possible to decide a cutoff value for the “similarity” of the true match in SFEC (not necessarily 1 for the true match under practical conditions). The only solution apparently is to select the spectrum that gives the highest similarity value.
-
c)
A different noise level in the search input can the lower SFEC similarity value significantly below 1. But still, the true match gives the largest similarity value (relatively).
-
d)
In cases b and c, the highest value can be scaled to 1 for practical applications.
-
e)
SFEC faces difficulties when the constituent spectra in the DB have different levels of noise. Even a small difference of noise (Δrms noise = 0.0063) between different DB spectra can result in a wrong search hit. Therefore, the noise levels in different DB spectra should not vary considerably. Based on our results, it is better to keep the Δrms noise below 0.004.
-
f)
General practice of scaling the SFEC similarity of the top hit to 1 should be cautiously dealt with in automated software routines.
We believe that the above noted points will be useful for developing automated applications of Raman spectroscopy that uses mathematical spectral matching routines.
Experimental Methods
Raman Spectroscopy
All Raman spectroscopic measurements were carried out by using a Raman microspectrometer (XploRA PLUS, HORIBA Scientific Corp., Japan). Two laser wavelengths, viz. 532 and 785 nm, were used for collecting the spectra. An objective lens (50X, NA = 0.75) was used for laser excitation and for the collection of Raman spectra. The collected spectra were interpolated to the same Raman axis after wavenumber calibration with indene. Depending on the scattering efficiency of the sample, a range of laser powers (4–40 mW) were used. The exposure time was also different depending on the sample, and it varied from 10 to 180 s. All spectra were accumulated 50 times such that the SN is high.
Chemicals
All the compounds used in the study were obtained from the microbial library of Kitasato University, Tokyo, Japan.14 The names of the compounds are as follows: amphotericin B, ampicillin, azithromycin, cationomycin, cephalothin, chloramphenicol, cinnamamide, cyclosporine, cytovaricin, erythromycin, harziandione, latrunculin A, louisianin A, mangromycin A to H, megalomycin A, metronidazole, nanomycin E, natamycin, neomycin, nicarbazin, nystatin, penicillin, piperacillin, piraziquantel, polyoxin B, polyoxin C, reveromycin A, reveromycin A, staurosporine, streptomycin sulfate, streptomycin, sulfisoxazole, takaokamycin, tirandamycin A, tirandamycin B, F0-2787, and JBIR75. For a few samples, spectra were recorded with both 532 and 785 nm laser wavelengths. The spectra are not arbitrary baseline subtracted but only corrected for dark noise and the CCD profile.
Acknowledgments
This work was supported by a Grant-in-Aid for Scientific Research S from The Ministry of Education, Culture, Sports, Science and Technology (no. 17H06158).
Supporting Information Available
The Supporting Information is available free of charge at https://pubs.acs.org/doi/10.1021/acsomega.0c05041.
All the 48 spectra (DB) used in the study, results of DB search, and effect of glass baseline on spectral similarity (PDF)
The authors declare no competing financial interest.
Supplementary Material
References
- Kudelski A. Analytical applications of Raman spectroscopy. Talanta 2008, 76, 1–8. 10.1016/j.talanta.2008.02.042. [DOI] [PubMed] [Google Scholar]
- Frère L.; Paul-Pont I.; Moreau J.; Soudant P.; Lambert C.; Huvet A.; Rinnert E. A. Semi-automated Raman micro-spectroscopy method for morphological and chemical characterizations of microplastic litter. Mar. Pollut. Bull. 2016, 113, 461–468. 10.1016/j.marpolbul.2016.10.051. [DOI] [PubMed] [Google Scholar]
- Li-Chan E. C. Y. The applications of Raman spectroscopy in food science. Trends Food Sci. Tech. 1996, 7, 361–370. 10.1016/S0924-2244(96)10037-6. [DOI] [Google Scholar]
- Miyaoka R.; Ando M.; Harada R.; Osaka H.; Samuel A. Z.; Hosokawa M.; Takeyama H. Rapid inspection method for investigating the heat processing conditions employed for chicken meat using Raman spectroscopy. J. Biosci. Bioeng. 2020, 129, 700–705. 10.1016/j.jbiosc.2020.01.002. [DOI] [PubMed] [Google Scholar]
- Perez-Alfonso C.; Galipienso N.; Garrigues S.; de la Guardia M. A green method for the determination of cocaine in illicit samples. Forensic Sci. Int. 2014, 237, 70–77. 10.1016/j.forsciint.2014.01.015. [DOI] [PubMed] [Google Scholar]
- Doty K. C.; Lednev I. K. Raman spectroscopy for forensic purposes: Recent applications for serology and gunshot residue analysis. TrAC, Trends Anal. Chem. 2018, 103, 215–222. 10.1016/j.trac.2017.12.003. [DOI] [Google Scholar]
- Vandenabeele P.; Edwards H. G. M.; Moens L. A Decade of Raman Spectroscopy in Art and Archaeology. Chem. Rev. 2007, 107, 3675–3686. 10.1021/cr068036i. [DOI] [PubMed] [Google Scholar]
- Mu T.; Li S.; Feng H.; Zhang C.; Wang B.; Ma X.; Guo J.; Huang B.; Zhu L. High-Sensitive Smartphone-Based Raman System Based on Cloud Network Architecture. IEEE J. Sel. Top. Quantum Electron. 2019, 25, 1–6. 10.1109/JSTQE.2018.2832661. [DOI] [Google Scholar]
- Pearson K. Mathematical contributions to the theory of evolution: regression, heredity, and Panmixia. Philos. Trans. R. Soc. Lon. 1896, 187, 253–318. 10.1098/rsta.1896.0007. [DOI] [Google Scholar]
- Piovani J. I. The historical construction of correlation as a conceptual and operative instrument for empirical research. Qual. Quant. 2008, 42, 757–777. 10.1007/s11135-006-9066-y. [DOI] [Google Scholar]
- Li J.; Hibbert D. B.; Fuller S.; Vaughn G. A comparative study of point-to-point algorithms for matching spectra. Chemom. Intell. Lab. Syst. 2006, 82, 50–58. 10.1016/j.chemolab.2005.05.015. [DOI] [Google Scholar]
- Chang C. I. An information-theoretic approach to spectral variability, similarity, and discrimination for hyperspectral image analysis. IEEE Trans. Inf. Theory. 2000, 46, 1927–1932. 10.1109/18.857802. [DOI] [Google Scholar]
- Ma D.; Liu J.; Huang J.; Li H.; Liu P.; Chen H.; Qian J. Spectral Similarity Assessment Based on a Spectrum Reflectance-Absorption Index and Simplified Curve Patterns for Hyperspectral Remote Sensing. Sensors 2016, 16, 152. 10.3390/s16020152. [DOI] [PMC free article] [PubMed] [Google Scholar]
- Nakashima T.; Takahashi Y.; O̅mura S. Search for New Compounds From Kitasato Microbial Library by Physicochemical Screening. Biochem. Pharmacol. 2017, 134, 42–55. 10.1016/j.bcp.2016.09.026. [DOI] [PubMed] [Google Scholar]
- Samuel A. Z.; Miyaoka R.; Ando M.; Gaebler A.; Thiele C.; Takeyama H. Molecular profiling of lipid droplets inside HuH7 cells with Raman micro-spectroscopy. Commun Biol. 2020, 3, 372. 10.1038/s42003-020-1100-4. [DOI] [PMC free article] [PubMed] [Google Scholar]
- Somorjai R. L.; Vivanco R.; Pizzi N. A novel, direct spatio-temporal approach for analyzing fMRI experiments. Artif. Intell. Med. 2002, 25, 5–17. 10.1016/S0933-3657(02)00005-2. [DOI] [PubMed] [Google Scholar]
- Nakashima T.; Kamiya Y.; Yamaji K.; Iwatsuki M.; Sato N.; Takahashi Y.; O̅mura S. J. Antibiot. 2015, 68, 348–350. 10.1038/ja.2014.152. [DOI] [PubMed] [Google Scholar]
- Tan X.; Chen X.; Song S. A computational study of spectral matching algorithms for identifying Raman spectra of polycyclic aromatic hydrocarbons. J. Raman Spectrosc. 2017, 48, 113–118. 10.1002/jrs.4978. [DOI] [Google Scholar]
- Park J. K.; Park A.; Yang S. K.; Baek S. J.; Hwang J.; Choo J. Raman spectrum identification based on the correlation score using the weighted segmental hit quality index. Analyst 2017, 142, 380. 10.1039/C6AN02315K. [DOI] [PubMed] [Google Scholar]
Associated Data
This section collects any data citations, data availability statements, or supplementary materials included in this article.


