Abstract
The α-β tubulin heterodimer undergoes subtle conformational changes during microtubule assembly. These can be modulated by external factors, whose effects on microtubule structure can be characterized on 2D views obtained by cryo-electron microscopy. Analysis of microtubule images is facilitated if they are straight enough to interpret and filter their image Fourier transform, which provide useful information concerning the arrangement of tubulin molecules inside the microtubule lattice. Here, we describe the use of the TubuleJ software to straighten microtubules and determine their lattice parameters. Basic 3D reconstructions can be performed to evaluate the relevance of these parameters. This approach can be used to analyze the effects of nucleotide analogues, drugs or MAPs on microtubule structure, or to select microtubule images prior to high-resolution 3D reconstructions.
Keywords: Tubulin, Microtubules, Microtubule lattice parameters, Microtubule polarity, Cryo-electron microscopy, Image analysis, Helical assemblies, Three-dimensional reconstructions
Background
Microtubules are polymers of the α-β tubulin heterodimer that form tubes of about 25 nm in diameter and several µm in length. Tubulin binds two molecules of guanosine triphosphate (GTP), one of which is hydrolyzed to GDP during assembly. GTP-hydrolysis is key to microtubule dynamics, since it destabilizes their lattice and allows their fast rearrangements and turn-over during cell activity. Works with GTP analogues such as guanylyl-(α, β)-methylene-diphosphonate (GMPCPP) or guanosine 5'-(γ-thio)-triphosphate (GTPγS) gave rise to a model in which GTP-tubulin undergoes a compaction and rotation between its subunits during assembly and GTP-hydrolysis ( Zhang et al., 2015 ). This model was recently challenged by a study that involved a range of nucleotide analogues and structural approaches, including X-ray crystallography, small angle X-ray diffraction and cryo-electron microscopy (Estévez-Gallego et al., 2020 ). This study led to the proposal that if tubulin sustains an expansion-compaction conformational change, this would occur after GTP-hydrolysis to facilitate inorganic phosphate release.
Other factors have been shown to modulate the tubulin compaction state or the protofilament skew angle of microtubules (Manka and Moores, 2018). End-binding proteins (EBs) that bind in-between protofilaments have been proposed to accelerate GTP-hydrolysis by compacting tubulin and to induce a left-handed lattice twist ( Zhang et al., 2018 ). Taxol has been reported to give rise to an expanded state similar to that found in GMPCPP microtubules (Vale et al., 1994; Estévez-Gallego et al., 2020 ), suggesting that this state reflects a stable conformation of tubulin in microtubules.
While high-resolution analysis of microtubules is prone to describe these conformational changes at the near-atomic level, it requires a careful selection of homogeneous types of microtubules. When reassembled in vitro from pure tubulin, microtubules form a range of structures that differ in terms of protofilament and/or lateral helical start numbers (Chrétien and Fuller, 2000). To accommodate these variations, the protofilaments skew relative to the microtubule longitudinal axis (Langford, 1980). This produces moiré patterns in 2D projection views obtained by cryo-electron microscopy, which provide a direct measure of their protofilament skew angle (Chrétien and Wade, 1991). Moreover, this moiré pattern has an arrowhead shape that reflects microtubule polarity, providing that the protofilament handedness has been unambiguously determined ( Chrétien et al., 1996 ; Sosa and Chrétien, 1998). The compaction state of tubulin can be accurately measured on diffraction patterns of the microtubule images (Vale et al., 1994; Hyman et al., 1995 ), and the helical rise of the tubulin subunits, which reflects how they interact laterally, can be deduced when all other parameters are known (Chrétien and Fuller, 2000; Estévez-Gallego et al., 2020 ).
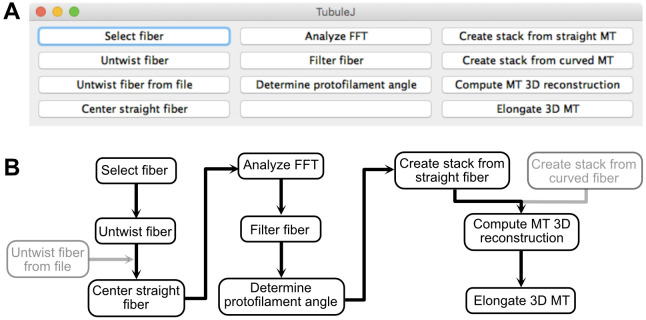
To facilitate analysis of microtubule images obtained by cryo-electron microscopy, we have developed TubuleJ as a plugin to the multi-platform ImageJ software ( Schneider et al., 2012 ). The basic principles of TubuleJ were originally described in ( Blestel et al., 2009 ). The current version has been updated with new routines, and incorporates TomoJ ( Messaoudi et al., 2007 ) to perform fast 3D reconstructions of microtubules. The workflow of TubuleJ is presented in Figure 1.
Figure 1. TubuleJ workflow.
A. TubuleJ menu. B. TubuleJ processing routines. Only the steps in black are described in this protocol. The steps ‘Untwist fiber from file’ and ‘Create stack from curved fiber’ are not described in this protocol. TubuleJ is divided in three “modules”. Module 1 (left) can be used with any type of fiber, while modules 2 (middle) and 3 (right) are specific to microtubules. Module 2 allows determination of microtubule lattice parameters, while module 3 allows basic 3D reconstructions, without differentiating the α-β tubulin monomers.
Equipment
-
Mac-Pro (mi-2010), 2 x 3.46 GHz, 2 x 6-Core Intel Xeon, 96 Go 1333 MHz DDR3 RAM, SSD 1 To, 3 x 6 To Sata disks, 2 x NVIDIA Quadro K5000 graphic cards, macOS version 10.13.6 (Apple Inc.)
Notes:
With the current configuration, determination of microtubule lattice parameters and calculation of a 3D reconstruction can be performed in less than 10 min.
Since ImageJ is multi-platform, the TubuleJ plugin can be installed and run on any computer equipped with compatible operating systems (MacOs, Linux, Windows). TubuleJ takes advantage of parallel processing (fast Fourier transforms with parallel FFTJ, 3D reconstructions with TomoJ). Therefore, mutli-core processors will speed up the calculations. Allocate a sufficient amount of RAM to ImageJ depending on your configuration and make sure it uses parallel processing (‘Edit -> Options -> Memory & Threads…’).
Software
ImageJ software: https://imagej.nih.gov/ij/
TubuleJ plugin to ImageJ: https://igdr.univ-rennes1.fr/TubuleJ/
-
FFTJ (implemented in TubuleJ): https://sites.google.com/site/piotrwendykier/software/parallelfftj
Parallel FFTJ is a multithreaded Fast Fourier Transform plugin for ImageJ.
-
TomoJ (implemented in TubuleJ): https://sourceforge.net/projects/tomoj/
TomoJ allows the preprocessing and registration of tilt series before performing 3D reconstructions.
UCSF Chimera: https://www.cgl.ucsf.edu/chimera/
Procedure
-
TubuleJ install
Download TubuleJ and the test image from https://igdr.univ-rennes1.fr/TubuleJ/.
Unzip TubuleJ.zip and install the TubuleJ folder inside the plugin folder of ImageJ.
-
Microtubule selection
Open the electron microscope image in ImageJ.
Select ‘Plugins -> TubuleJ -> TubuleJ’. The interface of TubuleJ opens (Figure 1A).
-
Click on ‘Select fiber’ and create a folder named ‘MTa’. Select this folder as your working directory.
Note: Several microtubules are frequently present in a single image, which requires creating a separate folder for each microtubule that will be analyzed.
-
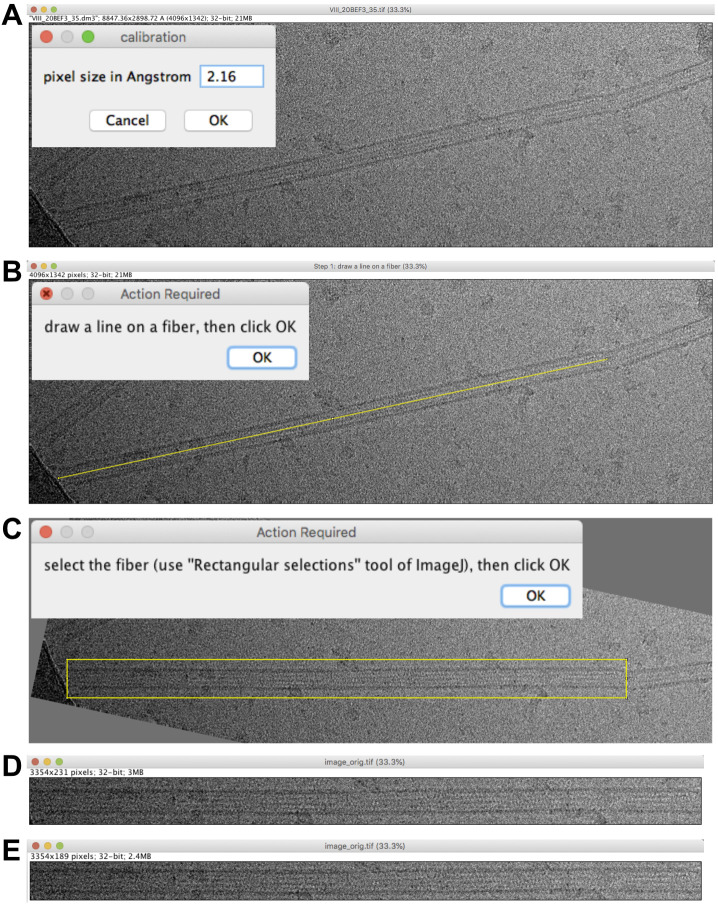
Fix the pixel size to 2.16 Å (Figure 2A) and press ‘OK’.
Note: The pixel size is automatically recovered from the header if present. If absent or inaccurate, it must be set at this stage. In the present case, the image header proposes 2.21 Å, but the actual magnification was calibrated using Tobacco Mosaic Virus, which gave a pixel size of 2.16 Å. If one aims to analyze the compaction state of tubulin (Hyman et al., 1995), it is important to calibrate precisely the images at the working magnifications, since changes in subunit monomer repeats are on the order of a few Å.
Draw a line on the fiber of interest (Figure 2B) and press ‘OK’. This defines the rotation angle of the image.
-
Draw a box around the fiber of interest (Figure 2C) and press ‘OK’. An image named ‘image_orig.tif’ is presented (Figure 2D). Select the whole image (Edit->Select All) and resize the image to, e.g., 189 in height, to minimize background (Image->Crop; Figure 2E). Save this image in the working directory.
Notes:
The procedure from microtubule selection (B) to 3D reconstruction (I) is provided in Video 1.
As the plugins starts with the current image opened in ImageJ, any file format that can be opened in ImageJ can be used with TubuleJ. It includes classical formats such as tiff. With the install of TomoJ, formats dedicated to electron microscopy such as dm3, mrc, spider or mrc.bz2 are also accepted.
-
Microtubule straightening
-
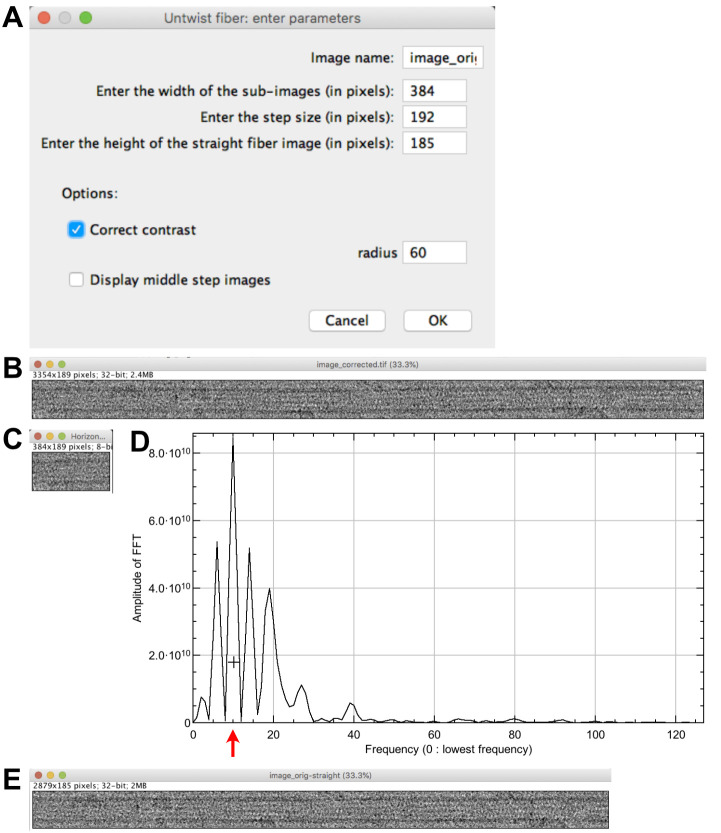
Select ‘image_orig.tif’ and click on ‘Untwist fiber’. Set the following parameters (Figure 3A): ‘Enter the width of the sub-images (pixels): 384’; ‘Enter the step size (pixels): 192’; ‘Enter the height of the straight fiber image (pixels): 185”. Let checked ‘Correct contrast’; ‘radius: 60’, let unchecked ‘Display middle step images’ and press ‘OK’. Orientations of the microtubule sub-regions with respect to the horizontal are indicated in the log window. The extracted image corrected for contrast variations is presented (Figure 3B), together with the first sub-region from the left roughly aligned horizontally (Figure 3C), and a line profile of the equator of the microtubule sub-region Fourier transform (Figure 3D).
Notes:
The width of the sub-regions will depend on the pixel size and the signal/noise ratio present in the images. We commonly use sub-image lengths comprised between 50 and 100 nm at the specimen level. The step size can be set to half the width size, and the height of the straight fiber about 65% larger than the width of a microtubule image (in pixels). Use an odd value for the width size to allow a proper centering of the microtubule image.Note: Grey gradients are essentially due to variations in ice thickness, e.g., from the border to the center of the carbon holes. These must be corrected for proper filtering of the microtubule images. The ‘radius’ option corresponds to the value of the Gaussian filter in ImageJ, which is used to produce a background image that is subtracted from the original image.
The option ‘Display middle step images’ presents all the extracts (image named ‘Horizontal and centered windows’), as well as an image showing the local centers (white crosses) connected with a dark line. Analysis of these images can be useful to determine why the algorithm failed during the local determination of microtubule centers.
-
Click at the level of the second large peak starting from the left (around 10 in frequency, Figure 3D). The progress of local center calculation can be followed in the log window. A straightened image corrected for contrast variations named ‘image_orig-straight’ is presented (Figure 3E).
Notes:
TubuleJ uses the phase of the J0 Bessel function to center the microtubule image (Blestel et al., 2009), which correspond to the 3 to 4 first large peaks in Figure 3D. The higher resolution peaks may overlap with JN (N = number of protofilaments, here N = 15). Selection of the second large peak at ~10 in frequency limits the contribution of the JN term that could corrupt the centering process.
The straightened image is shorter than the original image, since point centers are taken from the middle of the first sub-region to that of the last sub-region. A procedure to straighten the entire image is provided in the TubuleJ manual. This procedure uses the ‘Untwist fiber from file’ routine not described in this protocol. This routine can also be used to adjust mis-centered points.
-
-
Microtubule centering
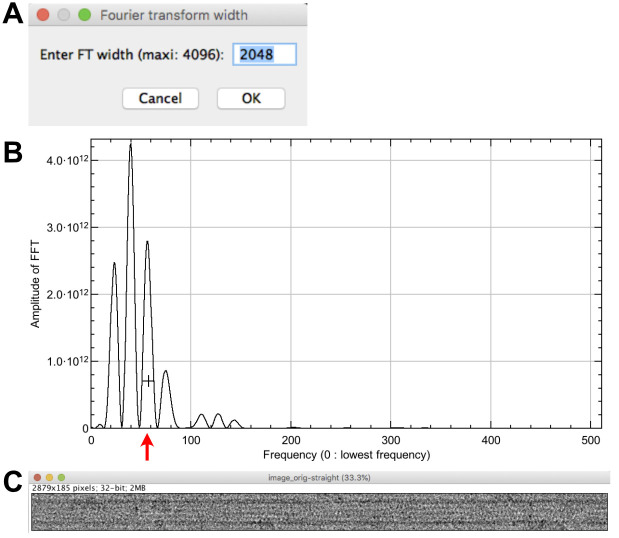
Select ‘image_orig-straight’ and click on ‘Center straight fiber’, set the max width of the FFT to 2048 pixels (Figure 4A) and press ‘OK’. The Fourier transform of the image is presented (not shown) together with a profile on the equator of the microtubule image FFT (Figure 4B).
-
Click at the level of the third large peak starting from the left (around 55 in frequency). An image named ‘image_orig-straight-Centered’ is presented’ (Figure 4C), and the translation along the ‘Y-axis’ is indicated in the log window. It should be minimal (less than 1 pixel) if the ‘image_orig-straight’ image has not been cropped.
Notes:
When protofilaments are skewed with respect to the longitudinal axis of the microtubule, the profile plot of the equator should be composed only of J0, without contribution of JN (see the power spectra in Figures 5A-5B and 6A). Hence, it is safe to click on a peak at higher resolution than in the straightening process.
We have limited the size of the Fourier transform to 4,096 x 4,096 pixels since the centering procedure is computationally intensive. This process can take time, wait until it is finished.
-
Determination of protofilament handedness and tubulin subunit repeat along protofilaments
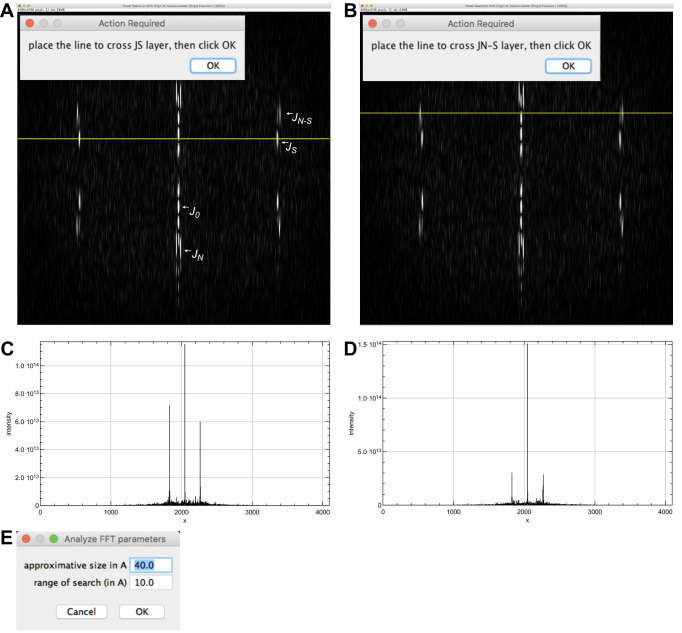
Select ‘image_orig-straight-Centered’ and click on ‘Analyze FFT’. The Fourier transform of the image is presented together with a horizontal line crossing the power spectrum. Select the FFT window and zoom in until the diffraction pattern fills the image. Adjust the contrast to emphasize the layer-line pattern (e.g., from 0 to ~3.0E13 in the B&C window).
Move the yellow line to cross the JS layer line (Figure 5A) and press ‘OK’.
Move the yellow line to cross the JN-S layer line (Figure 5B) and press ‘OK’. Line profiles of JS and JN-S are presented (Figures 5C-5D).
-
In the window ‘Analyze FFT parameters’ (Figure 5E), let the default values (‘approximate size in Å: 40.0’, and ‘range of search (in Å): 10’), and press ‘OK’. This sets the interval for searching peaks in the FFT. A window opens asking if you want to close intermediate windows. Press ‘OK’. Results are provided in the log window: The ‘monomer repeat’ is 40.87 Å and the protofilament skew angle ‘theta’ is positive. These values will be used to determine the protofilament skew angle (G) and to build image stacks suitable for 3D reconstruction (H).
Notes:
The Fourier transform of a helical fiber is characterized by layer lines that correspond to the different helical families present in this fiber. These layer lines are mathematically described by Bessel functions. In the case of microtubules, the Bessel function of order ‘0’ (J0) is due to the tubular nature of microtubules. It lies on the ‘equator’ of the Fourier transform, and is used to precisely center microtubule images (see Blestel et al., 2009, for details). The Bessel function of order ‘N’ (JN) arises from the linear arrangement of the tubulin molecules along the N protofilaments. Since the protofilaments are almost parallel to the microtubule longitudinal axis, JN lies close to J0 (Figure 5A). The Bessel function of order ‘S’ is due to the lateral interactions between tubulin monomers around the microtubule lattice. A full turn of this helix includes S monomers in height (between S = 2 and S = 4 in most microtubule types). JS lies close to the ‘meridian’ of the Fourier transform of microtubule images (Figure 5A, the meridian is perpendicular to the equator). The Bessel function of order ‘N-S’ is geometrically related to JN and JS. JN-S is further away from the meridian than JS (Figure 5A).
Determination of the protofilament skew angle sign is based on the following rule (Chrétien et al., 1996): When JS is farther away from the equator than JN-S, theta is negative, and when JS is closer to the equator than JN-S, theta is positive.
-
Microtubule image filtering and determination of microtubule polarity
Select ‘image_orig-straight_Centered’ and click on ‘Filter fiber’.
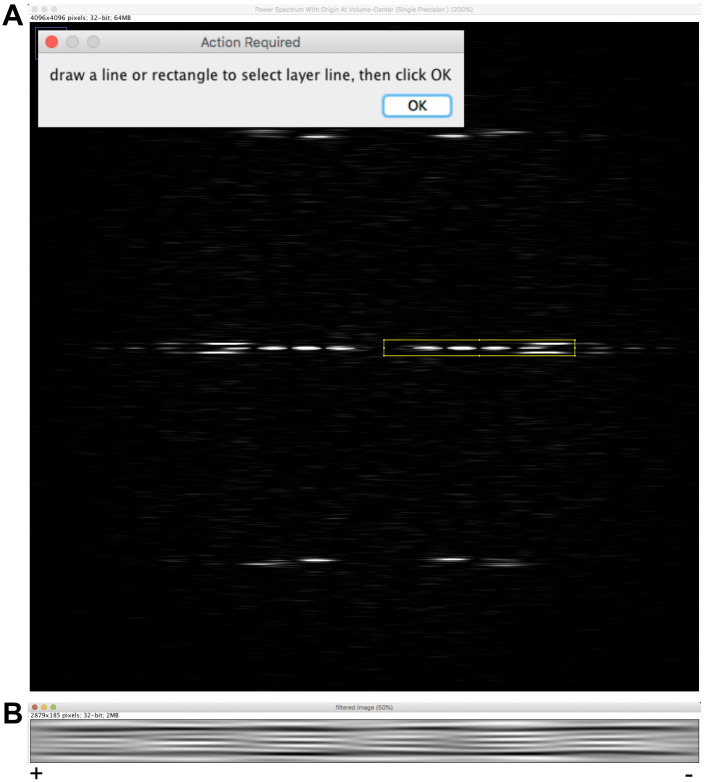
Select the FFT window (Figure 6A) and zoom in until the diffraction pattern fills the image.
Select the rectangular tool of ImageJ and draw a rectangle that incorporate the J0 and the first peak of the JN term on each side of the equator and press ‘OK’.
Enter 21 lines and press ‘OK’. Click ‘Yes’ to accept the selected region and answer ‘No’ in the window ‘Do you want to select other layer lines?’. An image named ‘filtered image’ is presented (Figure 6B), which emphasizes the moiré pattern originating from the skewed protofilaments imaged in projection.
The moiré pattern has an ‘arrowhead’ shape pointing to the left of the image. Since the protofilaments are right-handed (theta is positive), the microtubule is oriented with its plus end pointing to the left. Note: The arrowhead pattern is due to the asymmetric shape of tubulin when viewed along the microtubule axis (see Figures 9D and 10). The directionality of this pattern reverses when protofilament have opposite chirality (Chrétien et al., 1996; Sosa and Chrétien, 1998). The rule to determine microtubule polarity is the following: The fringe pattern points towards the plus end of microtubules with right-handed protofilaments (θ > 0), and towards the minus end of microtubules with left-handed protofilaments (θ < 0).
-
Determination of the protofilament skew angle
-
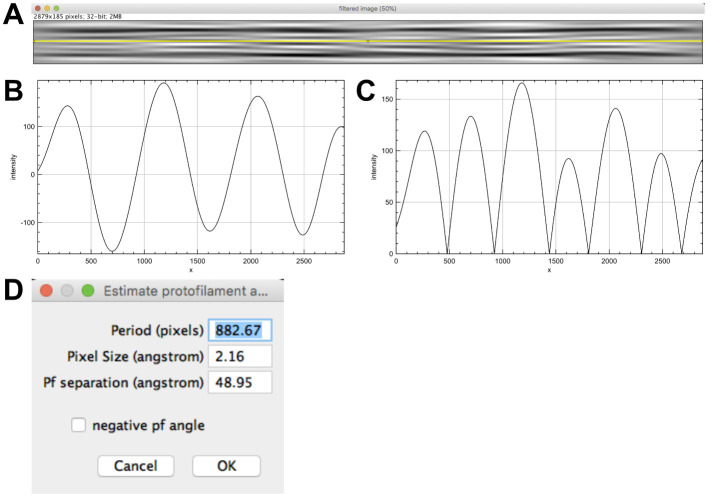
Select ‘filtered image’ and click on ‘Determine protofilament angle’. Select the ‘filtered image’ (Figure 7A) and move the line with the arrow key so that it crosses minima and maxima of the fringe pattern (6 pixels up) and press ‘OK’.
Note: In the case of a microtubule with an even protofilament number, the line should be adequately placed in the middle of the filtered image. Here, the protofilament number is odd (N = 15), which necessitates moving the line slightly off center to cross maxima and minima of the moiré pattern.
Three line plots open corresponding to the line profile (‘line intensities’, Figure 7B), a smoothed version to attenuate local variations if present (not shown), and the absolute value of the smoothed line profile (‘line intensities after abs()’ Figure 7C). A window opens providing the measured period (in pixels, Figure 7D), the pixel size and the protofilament separation (set as default to 48.95 Å). Let the ‘negative pf angle’ unchecked since it has been previously determined to be positive and press ‘OK’. A window opens to close intermediate windows, press ‘OK’.
-
Close the filtered image.
The moiré period L (1906.56 Å) and the protofilament skew angle theta (+1.47 Å) are given in the log window.
Note: The protofilament skew angle θ is calculated according to the following formula:
where x denotes the separation between adjacent protofilaments. The separation between protofilaments x is difficult to retrieve from individual images. If several types of microtubules are present in the specimen, this can be estimated by measuring the change in image width with protofilament number (Chrétien and Wade, 1991). The default value of 48.95 Å was derived from medium-resolution 3D maps of microtubules with from 11 to 16 protofilaments (Sui and Downing, 2010).
-
-
Stack generation
-
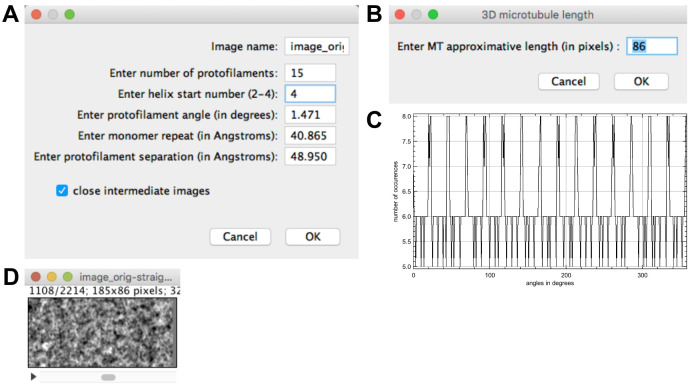
Select ‘image_orig-straight_Centered’ and press ‘Create stack from straight MT’. Fix the protofilament number to 15 and the helical-start number to 4 (Figure 8A). Let the other parameters as provided and press ‘OK’.
Notes:
A ‘Create stack from curved MT’ routine is provided to extract stack images from the original (contrast corrected) microtubule image (saved as ‘orig_corrected.tif’ in the working directory). This option can be useful if one wishes to process the image stack with other 3D reconstruction software.
A rigorous determination of N and S would require a detailed analysis of the positions and phases of the layer lines in the Fourier transform of the images (Stewart, 1988), which goes beyond the scope of this protocol. The parity of N can be determined from the symmetry of the fringe pattern: it is centered for even protofilament numbers, and off-center for odd protofilament numbers. The value of N can then be estimated by comparing the microtubule diameter with that of other microtubules present in the specimen, and also by comparing the fringe pattern with published images of microtubules with different N_S configurations (Chrétien and Fuller, 2000). The helical start number S can be estimated from the sign of the protofilament skew angle (Table 1). In the present case, N = 15 and θ is positive, hence S = 4.
-
A window opens asking the approximate MT length (86 pixels; Figure 8B). Let this value and press ‘OK’. The incremental ‘Z-shift ‘(1.26 pixels) and ‘Angular shift’ (-95.966°) assigned to the stack images are given in the result window.
Notes:
-
The ‘Helical rise’ (r = 9.64 Å) corresponds to the longitudinal stagger between tubulin monomers in adjacent protofilaments. It is calculated according to the following formula:
where S denotes the monomer helical start number, ‘a’ the tubulin subunits repeat along protofilaments, N the protofilament number,x the separation between protofilaments, and L the moiré period (with the sign of θ).
The ‘approximate MT length’ value determines the height of the volume that will be calculated at the following step so that it encompasses at least 4 monomer helical starts.
-
A histogram opens showing the angle distribution assigned to the images of the stack (‘Angle distribution’), Figure 8C. A stack is presented (‘image_orig-straight_Centered_angle_-95.966’, Figure 8D), which is composed of 2214 images corresponding to views extracted at each subunit monomer position along the microtubule image.
-
Table 2 summarizes the microtubule lattice parameters derived from this analysis:
Table 2. Microtubule lattice parameters.
Polarity is from plus end (left) to minus end (right) in the original image.N S a (Å) r (Å) θ (°) Polarity 15 4 40 .87 9.64 +1.47 + / -
-
-
3D reconstruction
-
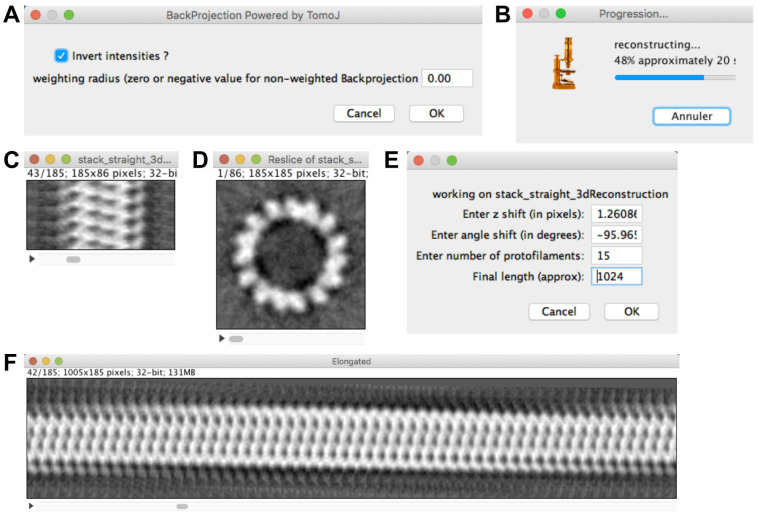
Click on ‘Compute MT 3D reconstruction’. Let ‘Invert intensities?’ checked and the ‘weighting radius’ to 0.0 (Figure 9A), then press ‘OK’.
Notes:
Images taken on a camera under defocused conditions display protein as dark. Contrast inversion is thus necessary to examine these data in UCSF Chimera (J). Scanned images recorded on negatives display the protein density as white. In that case, uncheck the ‘Invert intensities?’ button.
The weighting radius can be set to higher values (between 0 and 0.5) in order to attenuate the contribution of low frequencies, which are amplified during back projection (Radermacher, 1992). Yet, this is done at the expense of increasing the noise in the final 3D reconstruction.
A ‘Progression…’ window opens (Figure 9B): wait until the ‘stack_straight_3dReconstruction’ is calculated (Figure 9C). Scroll through this volume, the tubulin subunits (shown in white) are clearly visible in the volume. Select ‘Image -> Stacks -> Reslice [/]…’ then select ‘Start at: top’ and press ‘OK’ (Figure 9D). The asymmetry of the tubulin subunits indicates that we are looking at this map from the plus end ( Chrétien et al., 1996 ; Sosa and Chrétien, 1998; see also (J)). The top-to-bottom orientation of the 3D map corresponds to the left-to-right orientation in the original image, which indicates that the polarity was well assigned.
-
Select ‘stack_straight_3dReconstruction’ and click on ‘Elongate 3D MT’ (Figure 9E). Let the 3 first parameters as default, fix the final length to 1024 and press ‘OK’. This generates an elongated version of the microtubule where the protofilament skew and its handedness can be observed (Figure 9F).
Note: The z shift and angle shift used to elongate the microtubule correspond to the parameters of the basic one start helix that join all the tubulin subunits within the microtubule lattice. These values are also used to perform the 3D reconstruction of the microtubule, see Blestel et al. (2009) for deeper details.
-
Examine the working directory, several files have been created (listed in chronological order):
calibration.cvs: pixelSize, the pixel size in Å.
image_orig.tif: the region extracted from the original image.
image_corrected.tif: the region extracted from the original image corrected for contrast variations.
centers.txt: number of local centers and their x, y coordinates.
straight_image.tif: the straightened image.
image_orig-straight_Centered.tif: the straight image centered.
analyzeFFT.csv: pixelSize, the pixel size in Å; monomerRepeat, the monomer repeat along protofilaments (in Å); thetaSign, the sign of theta (1 positive, -1 negative).
filtered image.tif: the filtered image.
protofilament.csv: l(pixel), the moiré period in pixels; pixelSize, the pixel size (in Å); L(angstrom), the moiré period (in Å), Pf separation(angstrom); the protofilament separation (in Å); theta, the protofilament skew angle (in °).
angle_distribution.csv: the number of views assigned in the stack for each angle (Y), from 0° to 359° (X).
angles.txt: the angular orientation assigned to the images of the stack.
elongation.csv: zshift, the Z-rise of tubulin monomers with respect to the longitudinal axis of the microtubule; angleshift, the angular increment of tubulin monomers around the microtubule Z axis; nbProtofilaments, the protofilament number; helicalRise, the helical rise of tubulin subunits along adjacent protofilaments.
stack_straight.tif: the image stack used for 3D reconstruction.
stack_straight_3dreconstruction.tif: the 3D reconstruction of the microtubule.
3dReconstruction_elongated.tif: the elongated version of the 3D reconstruction.
-
-
Observation of the 3D reconstructions with UCSF Chimera
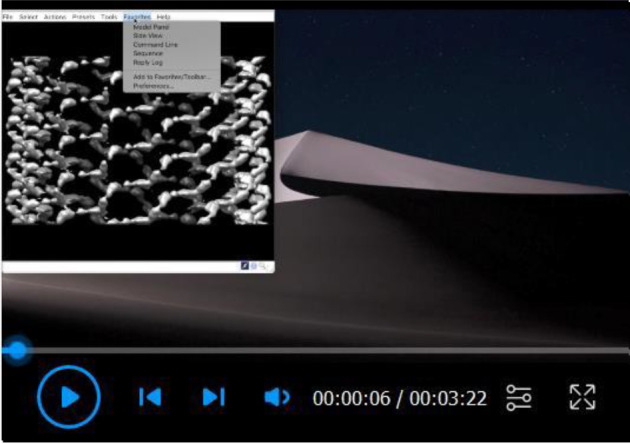
Open the ‘stack_straight_3dreconstruction.tif’ volume saved in the working directory into UCSF Chimera.
Display the command line: ‘Menu->Favorites->Command line’.
Open the camera viewer: ‘Menu->Tools->Viewing Controls->Camera’ and select ‘orthographic’.
Open the Volume viewer: ‘Menu->Tools->Volume Data->Volume Viewer’, and in the ‘Features’ menu, check ‘Brightness and Transparency’, ‘Coordinates’, and ‘Threshold and Color’.
Adjust the ‘Level’ to enlarge tubulin densities (e.g., to ‘Level = 300’) and set the ‘Transparency’ to 0.50.
In the command line, enter ‘turn x 90 1’.
Set the voxel size to 2.16 Å and press center.
Select the ‘Side View’ tab of the ‘Viewing window’ and press ‘View All’.
Open the tubulin map 1tub: ‘Menu->File->Fetch by ID…’, check the ‘PDB’ button, enter 1tub and press ‘Fetch’.
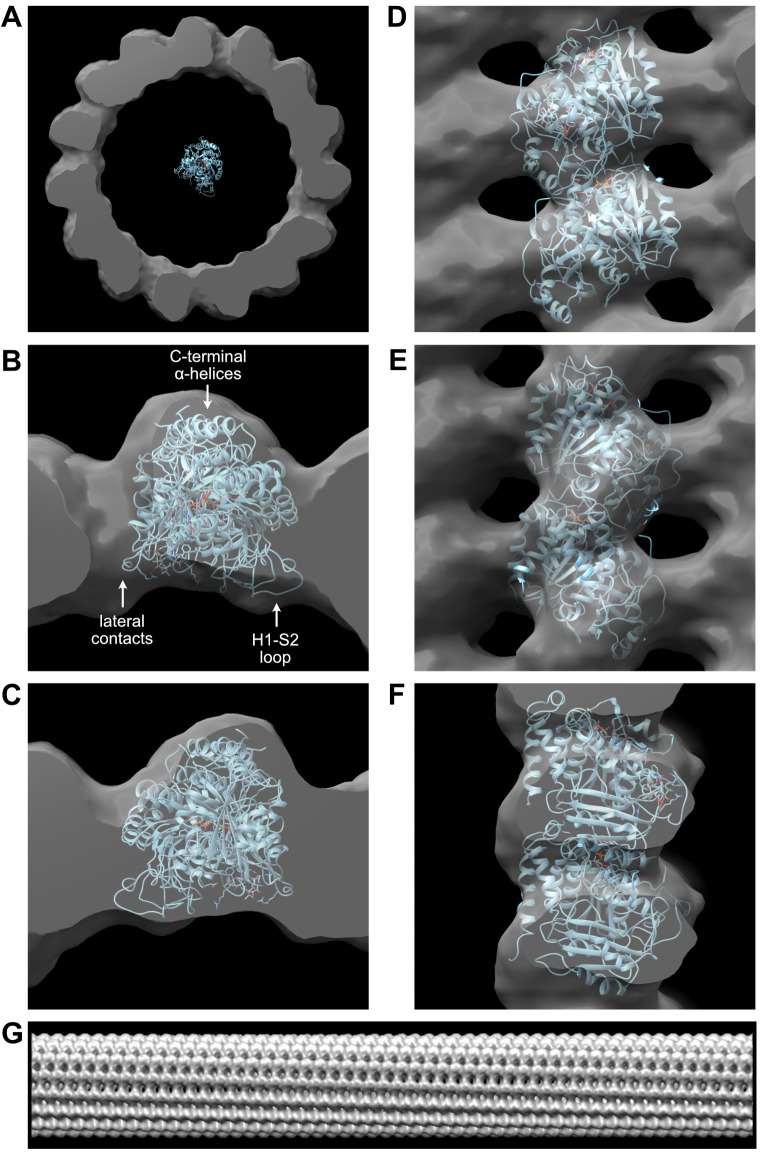
In the command line, enter ‘move 62,-30,-30 mod #1; turn y 90 1 mod #1 center #1’. The tubulin map is oriented with its plus end viewed from the top (Figure 10A). Comparison of the overall shape of the 1tub model with that of the microtubule map confirms that the plus end points towards the top of the reconstruction.
-
In the command line, enter ‘move -45,-110,0 mod #0’. Select ‘Volume Viewer->Tools->Fit in Map’ and fit ‘1tub (#1) in map ‘stack_straight_3dreconstruction.tif (#0)’. Inspect the fit of the 1tub model inside the 3D density of the microtubule (Figures 10B-10F).
Notes:
The good agreement between the overall shape of the 1tub model and the 3D reconstruction, including the correspondence of structural motifs such as densities corresponding to the lateral interactions, the H1-S2-loop pointing inward and the C-terminal α -helices pointing outward (Figure 10B), give a fair confidence that the parameters derived from the analysis were adequately determined.
The original image has not been corrected for the effect of the Contrast Transfer Function. This can be performed before processing the images in TubuleJ in order to improve the quality of the final reconstruction.
Save the session in the working directory as ‘MTa.py’.
Close the session and open ‘3dReconstruction_elongated.tif’.
Set the step size to 2 and adjust the ‘Level’ to 300. The right-handed skew of the protofilaments is clearly visualized in this elongated version of the microtubule 3D reconstruction (Figure 10G).
-
Save the session as ‘MTa_Elongated.py’.
Note: The visualization procedure using UCSF Chimera is provided in Video 2.
Figure 2. Microtubule selection.
A. Pixel size setting. B. Rotation of the microtubule image. C. Microtubule image boxing. D. Extracted region. E. Extracted region cropped to minimize background.
Video 1. Microtubule image analysis and 3D reconstruction.
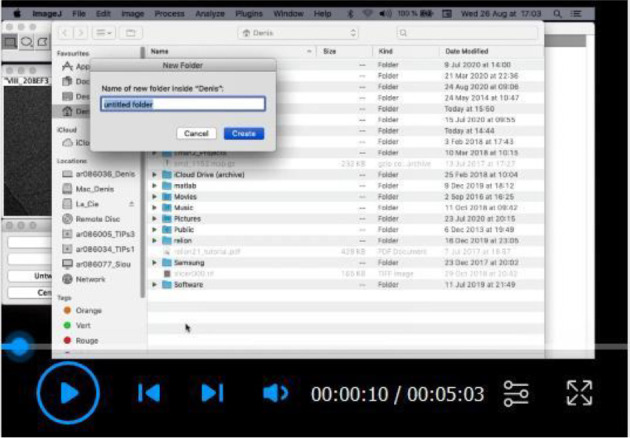
Figure 3. Microtubule straightening.
A. Straightening parameters. B. Contrast corrected image. C. First sub-region from the left. D. Line profile of the equator of the microtubule sub-region Fourier transform. The cross is placed at the level of the second large peak of the J0 Bessel term (red arrow). E. Straightened microtubule image.
Figure 4. Microtubule centering.
A. Setting of the FFT size. B. Line profile of the equator of the straightened microtubule image Fourier transform. The cross is placed at the level of the third large peak of the J0 Bessel term (red arrow). C. Centered image.
Figure 5. Analysis of the microtubule Fourier transform.
A. Selection of the JS layer line. The main layer lines are indicated. J0 lies on the equator of the Fourier transform. JS is closer to the equator than JN-S, indicating that the microtubule has right-handed protofilaments. B. Selection of the JN-S layer line. C. Line profile along JS. D. Line profile along JN-S. E. Peak search interval.
Figure 6. Microtubule image filtering.
A. Selection of J0 and of the first peak JN. B. Filtered image. The moiré pattern displays an arrowhead shape that points toward the left of the image.
Figure 9. Microtubule 3D reconstruction.
A. 3D reconstruction parameters. B. Progression bar. C. 3D reconstruction. D. 3D reconstruction observed from the top. E. Elongation parameters. F. Elongated version of the microtubule. The right-handed skew of the protofilaments is clearly visible.
Figure 10. Visualization of the 3D reconstruction with UCSF Chimera.
A. Comparison of the 3D reconstruction with the 1tub tubulin model. B. Fit of 1tub into the 3D reconstruction. Plus end view. Structural features that allow a good match between the tubulin model and the 3D reconstruction are indicated. C. Minus end view. D. Inside view. E. Outside view. F. Side view. G. Elongated version of the 3D reconstruction.
Figure 7. Determination of the protofilament skew angle.
A. Selection of the moiré profile. B. Line profile revealing the moiré period (distance between two maxima or minima). C. Absolute value of the moiré period. This strategy has been implemented to measure low protofilament skew angles where only half the moiré repeat is present (like in most 13_3 microtubules).
Figure 8. Stack generation.
A. Stack generation parameters. B. Stack height. C. Angular distribution of the stack images. D. Image stack.
Table 1. Sign of θ for the main microtubule types assembled in vitro from purified tubulin (taken from Chrétien and Fuller, 2000), n. o.: not observed.
These latter N_S configurations require protofilament skew angles > ± 4°, which may represent a limit in the twist that the tubulin molecule can accommodate.
| N | 10 | 11 | 12 | 13 | 14 | 15 | 16 |
| S = 2 | - | - | - | - | - | n. o. | n. o. |
| S = 3 | + | + | + | +/- | - | - | - |
| S = 4 | n. o. | n. o. | n. o. | + | + | + | + |
Video 2. Observation of the 3D reconstruction using UCSF Chimera.
Acknowledgments
This work was funded by the Agence Nationale de la Recherche (ANR-16-C11-0017-01). We thank S. Blestel who wrote the original version of TubuleJ. The determination of microtubule centers used in TubuleJ was published in Blestel et al. (2009). TubuleJ was used in Estévez-Gallego et al. (2020) to analyze the structure of microtubules assembled in the presence of GTP, GMPCPP and GDP-BeF3-.
Competing interests
TubuleJ was deposited to the Agency for the Protection of programs (APP) under the code number IDDN.FR.001.240023.000.S.P.2011.000.21000.
Citation
Readers should cite both the Bio-protocol article and the original research article where this protocol was used.
References
- 1. Blestel S., Kervrann C. and Chrétien D.(2009). A Fourier-based method for detecting curved microtubule centers: Application to straightening of cryo-electron microscope images. Proceedings of the IEEE International Symposium on Biomedical Imaging: From Nano to Macro, Boston. 2009, June 28-July 1. 298-301. [Google Scholar]
- 2. Chrétien D. and Fuller S. D.(2000). Microtubules switch occasionally into unfavorable configurations during elongation. J Mol Biol 298(4): 663-676. [DOI] [PubMed] [Google Scholar]
- 3. Chrétien D., Kenney J. M., Fuller S. D. and Wade R. H.(1996). Determination of microtubule polarity by cryo-electron microscopy. Structure 4(9):1031-1040. [DOI] [PubMed] [Google Scholar]
- 4. Chrétien D. and Wade R. H.(1991). New data on the microtubule surface lattice. Biol Cell 71(1-2): 161-174. [DOI] [PubMed] [Google Scholar]
- 5. Hyman A. A., Chrétien D., Arnal I. and Wade R. H.(1995). Structural changes accompanying GTP hydrolysis in microtubules: information from a slowly hydrolyzable analogue guanylyl-(alpha, beta)-methylene-diphosphonate. J Cell Biol 128(1): 117-125. [DOI] [PMC free article] [PubMed] [Google Scholar]
- 6. Estévez-Gallego J., Josa-Prado F., Ku S., Buey R. M., Balaguer F. A., Prota A. E., Lucena-Agell D., Kamma-Lorger C., Yagi T., Iwamoto H., Duchesne L., Barasoain I., Steinmetz M. O., Chrétien D., Kamimura S., Díaz J. F. and Oliva M. A.(2020). Structural model for differential cap maturation at growing microtubule ends. eLife 9: e50155. [DOI] [PMC free article] [PubMed] [Google Scholar]
- 7. Langford G. M.(1980). Arrangement of subunits in microtubules with 14 protofilaments. J Cell Biol 1): 521-526. [DOI] [PMC free article] [PubMed] [Google Scholar]
- 8. Manka S. W. and Moores C. A.(2018). Microtubule structure by cryo-EM: snapshots of dynamic instability. Essays Biochem 62(6):737-751. [DOI] [PMC free article] [PubMed] [Google Scholar]
- 9. Messaoudi C., Boudier T., Sanchez Sorzano C. O. and Marco S.(2007). TomoJ: tomography software for three-dimensional reconstruction in transmission electron microscopy. BMC Bioinformatics 8: 288-296. [DOI] [PMC free article] [PubMed] [Google Scholar]
- 10. Radermacher M.(1992). Weighted Back-Projection Methods. In: Frank, J.(Ed.). Electron Tomography Springer, Boston, MA: 91-115. [Google Scholar]
- 11. Stewart M.(1988). Computer image processing of electron micrographs of biological structures with helical symmetry. J Electron Microsc Tech 9:325-358. [DOI] [PubMed] [Google Scholar]
- 12. Schneider C. A., Rasband W. S. and Eliceiri K. W.(2012). NIH Image to ImageJ: 25 years of image analysis. Nat Methods 9: 671-675. [DOI] [PMC free article] [PubMed] [Google Scholar]
- 13. Sosa H. and Chrétien D.(1998). Relationship between moire patterns, tubulin shape, and microtubule polarity. Cell Motil Cytoskeleton 40(1): 38-43. [DOI] [PubMed] [Google Scholar]
- 14. Sui H. and Downing K. H.(2010). Structural basis of interprotofilament interaction and lateral deformation of microtubules. Structure 18:1022-1031. [DOI] [PMC free article] [PubMed] [Google Scholar]
- 15. Vale R. D., Coppin C. M., Malik F., Kull F. J. and Milligan R. A.(1994). Tubulin GTP hydrolysis influences the structure, mechanical properties, and kinesin-driven transport of microtubules. J Biol Chem 269(38): 23769-23775. [PubMed] [Google Scholar]
- 16. Zhang R., Alushin G. M., Brown A. and Nogales E.(2015). Mechanistic origin of microtubule dynamic instability and its modulation by EB proteins. Cell 162(4): 849-859. [DOI] [PMC free article] [PubMed] [Google Scholar]
- 17. Zhang R., LaFrance B. and Nogales E.(2018). Separating the effects of nucleotide and EB binding on microtubule structure. Proc Natl Acad Sci U S A 115(27): E6191-E6200. [DOI] [PMC free article] [PubMed] [Google Scholar]


