Abstract
G-protein coupled receptors (GPCRs) remain at the forefront of drug discovery efforts. Detailed assessment of features contributing to GPCR ligand engagement in a physiologically relevant environment is imperative to the development of new therapeutics with improved efficacy. Traditionally, binding properties such as affinity and kinetics were obtained using biochemical radioligand binding assays. More recently, the high specificity of resonance energy transfer has been leveraged toward the development of homogeneous cell-based proximity assays with capacity for real-time kinetic measurements. This suite of ligand binding protocols couples the specificity of bioluminescent resonance energy transfer (BRET) with the sensitivity afforded by the luminescent HiBiT peptide. The BRET format is used to quantify dynamic interactions between ligands and their cognate HiBiT-tagged GPCRs through competitive binding with fluorescent Tracers. At the same time, high affinity complementation of HiBiT with the cell impermeable LgBiT limits the bright bioluminescence donor signal to the cell surface and eliminates luminescence background from unoccupied receptors present in intracellular compartments.
Keywords: HiBiT, G-protein-coupled receptor (GPCR), Bioluminescence resonance energy transfer (BRET), Ligand binding, Kinetics
Background
G protein-coupled receptors (GPCRs) play critical roles in driving cell signaling pathways and remain a prominent target class for drug development ( Santos et al., 2017 ). Accordingly, GPCR ligand binding assays that can quantify biophysical properties critical to drug action are essential for both basic research and drug discovery campaigns (Fang, 2012; Stoddart et al., 2016 ). Biochemical assessment of ligand binding affinity under equilibrium conditions has traditionally been viewed as an acceptable indicator for in vivo pharmacology of drug candidates (Hulme and Trevethick, 2010). However, there is growing understanding that this approach might be too simplistic. The kinetics of ligand binding provides insights into duration of drug action including residence time and potential for rapid rebinding, which have been postulated to be relevant predictors for in vivo efficacy (Fang, 2012; Copeland, 2016; Sykes et al., 2019 ). In addition, many GPCRs function as parts of multi-protein signaling complexes, which might influence distinct characteristics of ligand binding (Kenakin, 2010; Fang, 2012). As a result, there is increasing interest in comprehensive measurements of GPCR ligand engagement in the physiological context of living cells in both equilibrium and real-time.
GPCR ligand binding assays routinely employ ligands labeled with either radioisotopes or fluorophores in order to track the binding to a target (Fang, 2012; Stoddart et al., 2016 ). The most common biochemical GPCR ligand binding assays utilize radioligands in a competitive binding format to measure interactions between ligands and their unmodified cognate GPCRs (Flanagan, 2016). The specificity of these assays relies on the use of highly selective radioligands in combination with overexpressed GPCRs within membrane preparations. In addition, these non-homogenous assays require separation of free from bound radioligand, which limits the resolution and throughput of kinetic analyses ( Sykes et al., 2019 ). Furthermore, the wash steps are more difficult to perform in high throughput screenings.
Proximity binding assays relying on time resolved fluorescence resonance energy transfer (TR-FRET) or bioluminescent resonance energy transfer (BRET) have emerged as attractive alternatives to radioligand binding assays, particularly for high throughput screenings ( Stoddart et al., 2016 ; Sykes et al., 2019 ). These assays typically use fluorescently labeled ligands (fluorescent Tracers) in a competitive binding format to measure interactions between unmodified ligands and their cognate GPCRs genetically fused to an energy donor (i.e., a lanthanide-labeled protein tag or a luciferase). Although both ligand and GPCR need to be modified, these approaches provide high specificity as signal is generated only when the fluorescent Tracer and tagged GPCR are in close proximity. The inherent distance constraints of energy transfer (Ciruela, 2008) eliminates the requirement for highly selective labeled ligands and permits homogeneous cell-based assays. The homogeneous format allows for real-time kinetic measurements and is generally more compatible with high throughput settings.
The development of the bright NanoLuc luciferase ( Hall et al., 2012 ) enabled BRET-based GPCR ligand binding assays previously impossible with other luciferases ( Stoddart et al., 2015 ; Soave et al., 2016 ). Still, due to the cell permeability of the NanoLuc substrate furimazine, the use of full length NanoLuc as the energy donor results in signal generation regardless of NanoLuc’s cellular localization. This could lead to an elevated background from NanoLuc-tagged receptors that are present in intracellular compartments and are unable to engage the Tracer. This issue was recently addressed by genetically fusing GPCRs to the luminescent peptide HiBiT rather than the full length NanoLuc ( Soave et al., 2019 ; Boursier et al., 2020 ). HiBiT is a small 11-amino acid peptide that produces bright luminescence upon high affinity complementation with LgBiT, an 18 kDa subunit derived from NanoLuc ( Schwinn et al., 2018 ). The use of HiBiT restricts signal generation in endpoint assays to the cell surface. This is because LgBiT is cell impermeable and therefore incapable to complement any HiBiT-tagged receptors located in intracellular compartments. An added benefit is the use of a small peptide tag, which is less likely to interfere with protein function and trafficking to the cell surface.
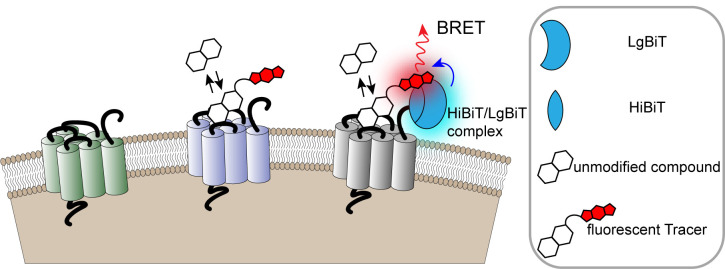
The binding protocols described here couple the specificity of BRET with the sensitivity and inherent cell-surface localization of the HiBiT/LgBiT reporter for quantification of binding interactions with selective GPCRs on the surface of living cells (Figure 1). They include four principal types of assays using β2-AR ligand binding as an example. Two of these assays utilize increasing concentrations of a fluorescent Tracer to measure its binding characteristics in equilibrium and real-time. The other two assays employ increasing concentrations of an unmodified test compound to derive its binding properties through the competition with a fixed concentration of a fluorescent Tracer. These competition analyses can be performed under equilibrium or in a kinetic format, which take advantage of a method reported by Motulsky and Mahan (1984).
Figure 1. Monitoring cell surface ligand engagement with selective HiBiT-tagged GPCRs via BRET.
BRET assay utilizing fluorescent Tracers in a competitive binding format to quantify dynamic cell-surface interactions between ligands and their cognate HiBiT-tagged GPCRs. This approach benefits from high specificity as signal is generated only when the fluorescent Tracer and tagged GPCR are in close proximity.
Materials and Reagents
White, Tissue Culture-Treated (TC) 96-well plates (Corning, catalog number: 3917)
Non-binding V bottom plates (for serial dilutions; for example, Costar, catalog number: 3896)
Tissue Culture-Treated (TC) flasks (growth area 150 or 75 cm2; Falcon, catalog number: 355001 or 353107)
HEK293 cells
0.05% Trypsin/EDTA (Life Technologies, catalog number: 25300)
Dulbecco's Modified Eagle Medium (DMEM) (Life Technologies, catalog number: 11995)
Fetal Bovine Serum (FBS) (HyClone, catalog number: SH30070.03)
100x Penicillin-streptomycin (Sigma, catalog number: P4333)
Opti-MEM without Phenol Red (Life Technologies, catalog number: 11058)
-
FuGENE HD (Promega, catalog number: E2311) or ViaFect (Promega, catalog number: E4981)
Note: Other transfection reagents can also be used.
DMSO (Sigma, catalog number: D2650-5X5ML)
Tracer dilution buffer (Promega, catalog number: N2191)
Nano-Glo HiBiT Extracelular Detection System (Promega, catalog number: N2420 or N2421)
Transfection Carrier DNA (Promega, catalog number: E4881)
Test compound of interest
-
DNA construct encoding a HiBiT- tagged GPCR fusion
Note: HiBiT-tagged GPCR constructs can be obtained from Promega Custom Assays Systems or generated via cloning into pFN39K secHiBiT CMV-neo Flexi Vector (Promega, catalog number: N2411) or pBiT3.1-secN [CMV/HiBiT/Blast] vector (Promega, catalog number: N2381).
-
Fluorescent Tracer
Note: Several NanoBRET GPCR Tracers can be obtained from Promega Custom Assays Systems. In addition a fluorescent GPCR Tracer can be generated according to the published protocol (Robers et al., 2019) using building blocks that can be obtained from Promega Custom Assays Systems.
Miscellaneous tissue culture reagents
DMEM Cell Culture Medium (see Recipes)
Opti-MEM Assay Medium (see Recipes)
Equipment
BRET-compatible microplate luminometer equipped with 450 nm (bandpass) and 600 nm (longpass) filters (e.g., Promega GloMax Discover, PerkinElmer EnVision, or BMG Clariostar)
Orbital plate shaker
Miscellaneous tissue culture equipment
Software
GraphPad Prism (https://www.graphpad.com/scientific-software/prism)
Procedure
-
Transient transfection of HEK293 cells with HiBiT-tagged GPCR constructs
Note: The transfection conditions described below are recommended for adequate translocation and cell surface expression of HiBiT-tagged GPCRs. These include:
Dilution of DNA encoding the HiBiT-tagged GPCR into a promoterless Carrier DNA. This maintains the total amount of transfected DNA but allows for lower expression levels across the population of transfected cells. A 100-fold dilution is generally recommended, however in some cases this might require further optimization.
DNA: Transfection reagent complexes should account for 10% (vol/vol) of transfected cell culture.
-
Cultivate HEK293 cells in Culture Medium (Recipe 1) in a TC-75 or TC-150 flask prior to assay.
Note: Cell density at time of harvest can affect transfectability. For optimal transfectability use freshly passaged HEK293 cells (ideally within 1-2 days) at 80-95% confluency.
Aspirate medium from flask, add 5 ml or 8 ml trypsin to TC-75 or TC-150 flask, respectively and allow cells to dissociate from the flask.
Neutralize trypsin using 20 ml or 25 ml Culture Medium (for TC-75 or TC-150, respectively), and pellet cells via centrifugation at 200 × g for 5 min.
Aspirate medium and resuspend cells into a single cell suspension using Opti-MEM Assay Medium (Recipe 2).
Adjust the cell density to 2.2 x 10⁵ cells/ml in Opti-MEM Assay Medium in a sterile, conical tube.
-
Prepare transfection reagent: DNA complexes.
Below is an example for transfection of 10 ml culture:
-
Prepare a 10 µg DNA solution in Opti-MEM without serum. This solution should contain the following ratios of carrier DNA and DNA encoding the HiBiT-tagged GPCR construct:
9.9 µg/ml of Transfection Carrier DNA.
0.1 µg/ml of DNA encoding the HiBiT-tagged GPCR (100-fold dilution).
0.5 ml of Opti-MEM without serum.
Mix thoroughly.
-
Combine 30 µl transfection reagent (i.e., FuGENE HD or ViaFect) with 0.5 ml Opti-MEM without serum and mix by pipetting.
Note: If using another transfection reagent, follow manufacturer recommendation.
Combine the DNA and transfection reagent solutions and mix by pipetting 10-15 times.
Incubate at room temperature for 15 min to allow transfection reagent, DNA complexes to form.
-
-
Combine one part (e.g., 1 ml) of transfection reagent: DNA complexes with 9 parts (e.g., 9 ml) of HEK293 cells in suspension at 2.2 x 10⁵ cells/ml. Mix gently by inversion 5 times and plate in a white TC-treated 96-well plate at 95 µl/well.
Note: Larger or smaller bulk transfections should be scaled accordingly, using this ratio.
Incubate for at least 20 h at 37 °C + 5% CO2.
-
NanoBRET GPCR-ligand engagement protocols
Saturation binding of a fluorescent tracer to a HiBiT-tagged GPCR
-
Treat cells with a serial dilution of a fluorescent Tracer.
-
Prepare a 20x serially diluted Tracer.
-
First prepare a 100x serially diluted Tracer in DMSO. Prepare 3-fold serial dilutions starting at 300 µM, which corresponds to a final 1x concentration of 3 µM. In some cases, a higher or lower Tracer concentration may provide a better assay window.
Note: Make sure to include within the serial dilution a no Tracer control.
Dilute the Tracer Dilution Buffer (TDB) 3-fold in Opti-MEM without phenol red to generate a 0.3x TDB.
Dilute the 100x serially diluted Tracer 5-fold in 0.3x TDB to generate a 20x serially diluted Tracer.
-
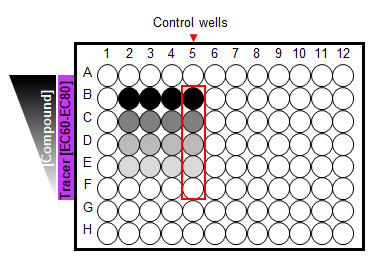
Add 5 µl of 20x serially diluted Tracer per well of transfected cells (Figure 2 portrays a 96-well plate set-up).
Mix briefly on an orbital plate shaker.
-
-
To determine specific binding treat control cells with excess unmodified compound.
-
Prepare a 20x unmodified compound solution.
Prepare a 10% (vol/vol) DMSO solution in Opti-MEM without phenol red.
Prepare a 600 µM unmodified compound solution in 10% DMSO, which corresponds to a final 1x concentration of 30 µM.
Add 5 µl of the 20x unmodified compound solution to the control wells (Figure 2 portrays a 96-well plate set-up).
Mix briefly on an orbital plate shaker.
-
Incubate plate at room temperature (to minimize receptor internalization) for 90 min protected from light, then proceed to NanoBRET detection section below.
Note: Agonist binding promotes receptor internalization to different extents, which can be detected through dose dependent decrease in donor signal (e.g., signal at 450 nm). Still, binding experiments at room temperature (22-25 °C) decease the rate of internalization and the ratiometric nature of BRET further minimizes the influence of internalization on binding analyses. Accordingly, binding analyses at 37 °C may require a shorter incubation time.
-
-
Detect NanoBRET
Immediately prior to BRET measurements prepare 2x HiBiT detection reagent in Opti-MEM without phenol red. This reagent consists of 100-fold dilution of LgBiT and 50-fold dilution of Nano-Glo HiBiT Extracellular Substrate. Mix thoroughly by pipetting.
Add 100 µl detection reagent/well.
Mix on an orbital plate shaker for 15 min.
Measure donor emission (e.g., 450 nm) and acceptor emission (e.g., 610 nm or 630 nm) using a NanoBRET-compatible luminometer.
-
Determine BRET ratio and process data.
To generate raw BRET ratio values, divide the acceptor emission value (e.g., 610 nm) by the donor emission value (e.g., 450 nm).
-
Convert raw BRET units to milli BRET units (mBU) by multiplying each raw BRET value by 1,000. NanoBRET equation:
BRET (mBU) = (Acceptorsample/Donorsample) x 1,000
-
Determine specific BRET by subtracting BRET values in the presence of excess unmodified compound from BRET values in the absence of excess unmodified compound.
Specific BRET (mBU) = BRETTracer - BRETTracer+ unmodified compound
Plot the data in GraphPad Prism software using the log(agonist) vs. response–variable slope fitting and determine the apparent affinity for the Tracer (EC50) (see Figures 3A and 3B for representative analyses).
Use the special calculation in GraphPad Prism “Find EC anything” to determine the EC60-EC80.
Plot the specific binding data in GraphPad Prism software using the one site-specific binding fitting and determine the binding constant (KD) (see Figure 3C for representative analysis).
Competitive displacement of a fluorescent tracer by unmodified test compound
-
Treat cells with fluorescent Tracer at a fixed concentration.
-
Prepare 20x Tracer solution.
Using the Tracer saturation binding analysis described above chose a fixed concentration between the EC60 to EC80 values.
First prepare a 200x Tracer solution in DMSO.
Dilute the Tracer Dilution Buffer (TDB) 3-fold in Opti-MEM without phenol red to generate a 0.3x TDB.
Dilute the 200x Tracer 10-fold in 0.3x TDB to generate a 20x Tracer solution.
Add 5 µl of the 20x Tracer solution per well of transfected cells (Figure 4 portrays a 96-well plate set-up).
Mix briefly on an orbital plate shaker.
-
-
Treat cells with a serial dilution of an unmodified test compound,
-
Prepare a 20x serially diluted unmodified test compound.
Prepare a 10% (vol/vol) DMSO solution in Opti-MEM without phenol red.
-
Prepare a 20x serially diluted unmodified test compound in 10% DMSO. Prepare 3-fold serial dilutions starting at 600 µM or 200 µM, which corresponds to a final 1x concentration of 30 µM or 10 µM.
Depending on the binding affinity of the test compound, further optimization of the serial dilution range may be required.
Note: Make sure to include within the serial dilution a no test compound control.
Add 5 µl of the 20x serially diluted unmodified test compound per well of transfected cells (Figure 4 portrays a 96-well plate set-up).
Mix briefly on an orbital plate shaker.
-
Incubate plate at room temperature (to minimize receptor internalization) for 90 min protected from light, then proceed to NanoBRET detection section below.
Note: Binding analysis at 37 °C may require a shorter incubation time.
-
-
Detect NanoBRET
Immediately prior to BRET measurements prepare 2x HiBiT detection reagent in Opti-MEM without phenol red. This reagent consists of 100-fold dilution of LgBiT and 50-fold dilution of Nano-Glo HiBiT Extracellular Substrate. Mix thoroughly by pipetting.
Add 100 µl detection reagent/well.
Mix on an orbital plate shaker for 15 min.
Measure donor emission (e.g., 450 nm) and acceptor emission (e.g., 610 nm or 630 nm) using a NanoBRET-compatible luminometer.
-
Determine BRET ratio and process data.
To generate raw BRET ratio values, divide the acceptor emission value (e.g., 610 nm) by the donor emission value (e.g., 450 nm).
-
Convert raw BRET units to milli BRET units (mBU) by multiplying each raw BRET value by 1,000. NanoBRET equation:
BRET (mBU) = (Acceptor sample / Donor sample) x 1,000
Plot the data in GraphPad Prism software using the log(inhibitor) vs. response–variable slope fitting and determine IC50 for the test compound (see Figure 5 for representative analysis).
-
Use the IC50 value to calculate binding constant for the test compound (Ki) according the Cheng-Pursoff equation (Cheng and Prusoff, 1973) where [L] is the concentration of fluorescent Tracer in the assay and KD is its affinity in the saturation binding experiment from above.
Ki = (IC50)/(1 + ([Tracer]/ KD)
Binding kinetics of a fluorescent tracer to HiBiT-tagged GPCR
Note: To minimize time intervals and better capture rapid binding, it is recommended to limit the number of tested Tracer concentrations to 4 or 5 (Figure 6 portrays a plate set-up).
-
Treat cells with detection reagent.
Prepare 2x HiBiT detection regent in Opti-MEM without phenol red. This reagent consists of 100-fold dilution of LgBiT and 50-fold dilution of Nano-Glo HiBiT Extracellular Substrate. Mix thoroughly by pipetting 10-15 times.
Add to a plate containing the transfected cells 95 µl of detection reagent per well and mix on an orbital plate shaker.
-
Pretreat control wells with excess unmodified compound.
Note: For background correction, pretreat the control wells (Figure 6 portrays a plate set-up) with excess unmodified compound to block Tracer binding.
-
Prepare a 20x excess unmodified compound solution.
Prepare a 10% (vol/vol) DMSO solution in Opti-MEM without phenol red.
Prepare a 600 µM unmodified compound solution in 10% DMSO, which corresponds to a final 1x concentration of 30 µM.
Add 10 µl of the 20x excess unmodified compound solution to the control wells.
Mix briefly on an orbital plate shaker.
Mix gently for additional 15 min to allow for HiBiT/LgBiT complementation.
-
-
Treat cells with serially diluted fluorescent Tracer.
-
During the 15 min incubation prepare a 20x serially diluted fluorescent Tracer.
Note: It is recommended to use 10x EC50 as the highest final concentration.
First prepare a 100x serially diluted Tracer in DMSO. Start with 2- or 3-fold serial dilutions and limit the number of dilutions to 4 or 5 to minimize the time intervals between reads.
Dilute the Tracer Dilution Buffer (TDB) 3-fold in Opti-MEM without phenol red to generate a 0.3x TDB.
Dilute the 100x serially diluted Tracer 5-fold in 0.3x TDB to generate a 20x serially diluted Tracer.
Immediately prior to kinetic measurements add 10 µl of 20x serially diluted Tracer per well of transfected cells.
Mix briefly on an orbital plate shaker and start kinetic reads on a NanoBRET-compatible luminometer, measuring donor emission (e.g., 450 nm) and acceptor emission (e.g., 610 nm or 630 nm). To capture rapid binding, use 0 min intervals between reads.
-
-
Determine BRET ratios and process data.
To generate raw BRET ratio values, divide the acceptor emission value (e.g., 610 nm) by the donor emission value (e.g., 450 nm).
-
Convert raw BRET units to milli BRET units (mBU) by multiplying each raw BRET value by 1,000. NanoBRET equation:
BRET (mBU) = (Acceptor sample/Donor sample) x 1,000
Determine specific BRET with time by subtracting BRET values in the presence of excess unmodified compound from BRET values in the absence of excess unmodified compound.
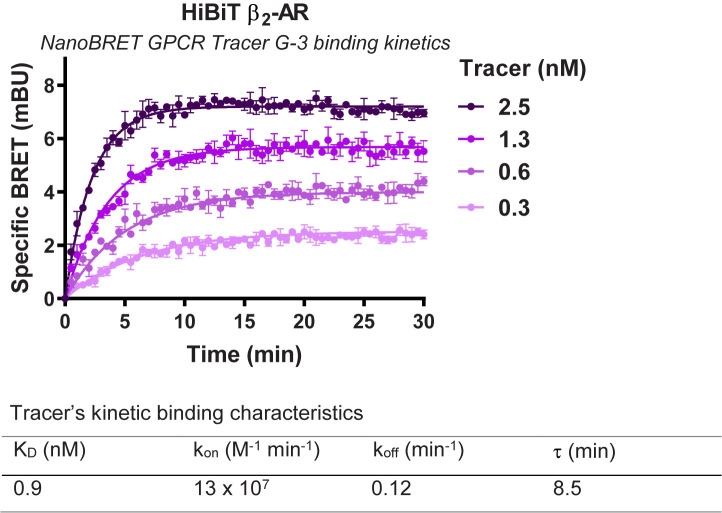
Plot the data in GraphPad Prism software using the association kinetics two or more concentrations of hot fitting and determine the kinetic constants (kon and koff) and binding constant (KD) for the Tracer (see Figure 7 for representative analysis).
Calculate residence time (τ) as 1/koff.
Competitive binding kinetics for unmodified test compound to HiBiT-tagged GPCR in the presence of a fluorescent tracer
Note: To minimize time intervals and better capture rapid binding, it is recommended to limit the number of tested unmodified compound concentrations to 4 or 5 (Figure 8 portrays a plate set-up).
-
Treat cells with detection reagent.
Prepare 2x HiBiT detection regent in Opti-MEM without phenol red. This reagent consists of 100-fold dilution of LgBiT and 50-fold dilution of Nano-Glo HiBiT Extracellular Substrate. Mix thoroughly by pipetting 10-15 times.
Add to a plate containing the transfected cells 95 µl of detection reagent per well and mix on an orbital plate shaker.
-
Pretreat control well with excess unmodified compound.
Note: For background correction, pretreat the control wells (Figure 8 portrays a plate set-up) with excess unmodified compound to block Tracer/test compound binding.
-
Prepare a 20x excess unmodified compound solution.
Prepare a 10% (vol/vol) DMSO solution in Opti-MEM without phenol red.
Prepare a 600 µM unmodified compound solution in 10% DMSO, which corresponds to a final 1x concentration of 30 µM.
Add 10 µl of the 20x excess unmodified compound solution to the control wells.
Mix briefly on an orbital plate shaker.
Mix gently for additional 15 min to allow for HiBiT/LgBiT complementation.
-
-
Treat cells with a fixed concentration of fluorescent Tracer and serial dilution of test compound.
During the 15 min incubation prepare a 20x fixed concentration of Tracer and serially diluted test compound.
-
Prepare 20x fluorescent Tracer solution.
Using the Tracer saturation binding analysis described above choose a fixed concentration between the EC60 to EC80 values.
First prepare a 200x Tracer solution in DMSO.
Dilute the Tracer Dilution Buffer (TDB) 3-fold in Opti-MEM without phenol red to generate a 0.3x TDB.
Dilute the 200x Tracer 10-fold in 0.3x TDB to generate a 20x Tracer solution.
-
Prepare 20x serially diluted unmodified test compound.
Note: It is recommended to use 5-10x KI as the highest final concentration.
Prepare a 10% (vol/vol) DMSO solution in Opti-MEM without phenol red.
-
Prepare a 20x serially diluted unmodified test compound in 10% DMSO. Start with 2- to 3-fold serial dilutions and limit the number of dilutions to 4 or 5 to minimize the time intervals between reads.
Note: Make sure to include within the serial dilution a no unmodified test compound control.
Immediately prior to kinetic measurements, add 11 µl/well of 20x serially diluted unmodified test compound and 11 µl/well of 20x Tracer solution.
Mix briefly on an orbital plate shaker and start kinetic reads on a NanoBRET-compatible luminometer, measuring donor emission (e.g., 450 nm) and acceptor emission (e.g., 610 nm or 630 nm). To capture rapid binding, use 0 min intervals between reads.
-
-
Determine BRET ratios and process data.
To generate raw BRET ratio values, divide the acceptor emission value (e.g., 610 nm) by the donor emission value (e.g., 450 nm).
-
Convert raw BRET units to milli BRET units (mBU) by multiplying each raw BRET value by 1,000. NanoBRET equation:
BRET (mBU) = (Acceptorsample/Donorsample) x 1,000
Determine specific BRET with time by subtracting BRET values in the presence of excess unmodified compound from BRET values in the absence of excess unmodified compound.
-
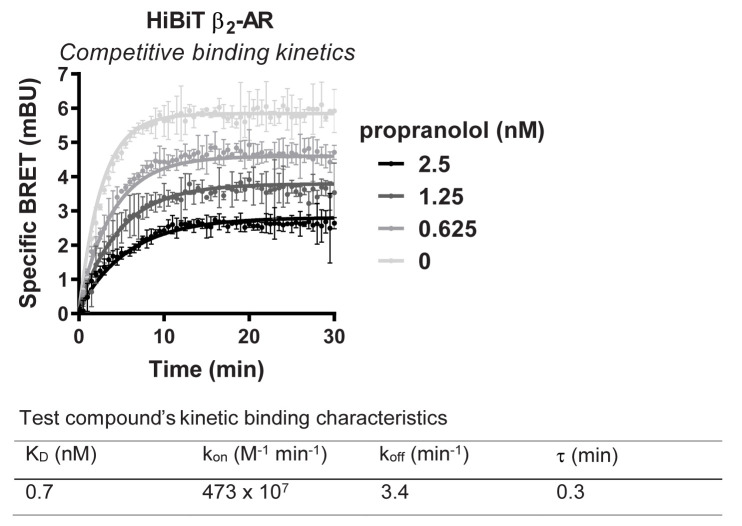
Plot the data in GraphPad Prism software using the Kinetic competitive binding fitting (Motulsky-Mahan model for kinetics of competitive binding (Motulsky and Mahan, 1984)), which takes in account the concentration of the Tracer as well as its kon and koff values (see Figure 9 for representative analysis).
Determine the kinetic constants (kon and koff) for the test compound.
Calculate binding constant for the unmodified compound (KD) for the unmodified test compound (Koff/kon) and residence time (τ) as 1/koff.
-
Figure 2. A 96-well plate set-up for saturation binding assay.
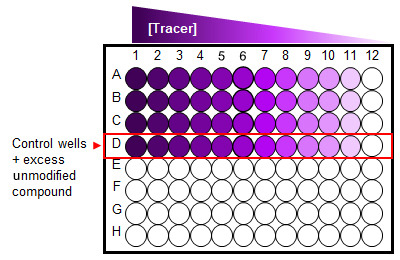
Cells treated with serial dilution of a fluorescent Tracer in the absence and presence (control wells) of excess unmodified compound.
Figure 3. Representative analyses for NanoBRET GPCR Tracer G-3 saturation binding to transiently expressed HiBiT-β2-AR.
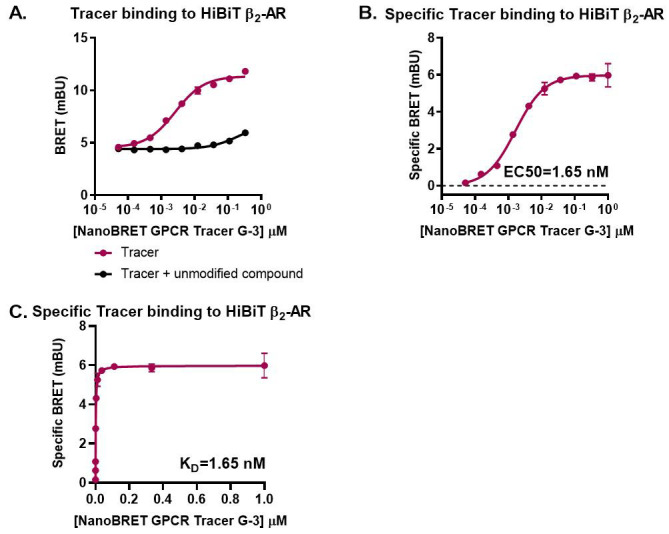
HEK293 cells expressing HiBiT-β2-AR were assayed as indicated in the protocol. Briefly, cells were transfected, grown overnight, and next day treated with serially diluted NanoBRET GPCR Tracer G-3 (i.e., the previously described propranolol-BODIPY ( Boursier et al., 2020 )) in the presence or absence of 30 µM propranolol. Following 90 min binding, HiBiT detection reagent was added, and cells were incubated for additional 15 min. Filtered luminescence was measured using GloMax Discover Microplate Reader (Promega) equipped with a 450 nm (8-nm bandpass) filter (donor) and a 600-nm long pass filter (acceptor) (n = 3; Error bars indicate SD). A. Binding in the presence and absence of excess propranolol, B. Specific binding, and C. Specific binding on a non-logarithmic scale.
Figure 4. A 96-well plate set-up for competition binding assay.
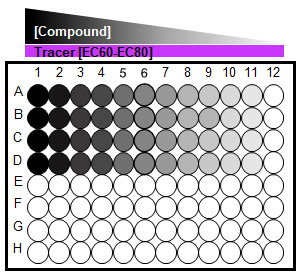
Cells treated with serial dilution of an unmodified test compound in the presence of a fluorescent Tracer at a fixed EC60-EC80 concentration.
Figure 5. Representative analysis for NanoBRET GPCR Tracer G-3 displacement from transiently expressed HiBiT-β2-AR by propranolol.
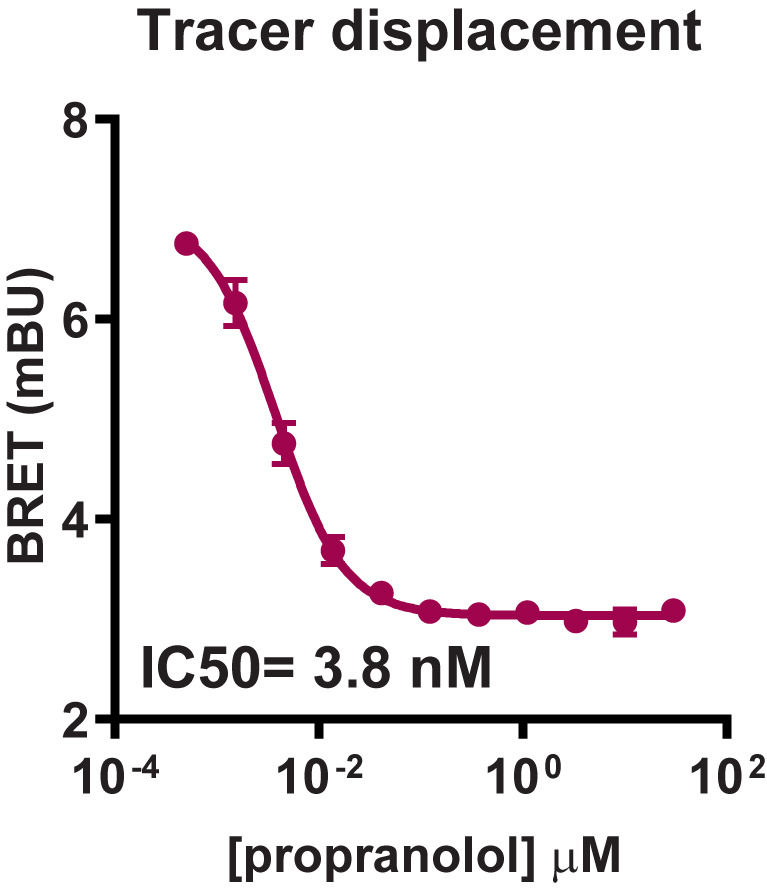
HEK293 cells expressing HiBiT-β2-AR were assayed as indicated in the protocol. Briefly, cells were transfected, grown overnight, and next day treated with propranolol titration along with NanoBRET GPCR Tracer G-3 (i.e., the previously described propranolol-BODIPY ( Boursier et al., 2020 )) at a final EC80 concentration. Following 90 min binding, HiBiT detection reagent was added, and cells were incubated for additional 15 min. Filtered luminescence was measured using GloMax Discover Microplate Reader (Promega) equipped with a 450 nm (8-nm bandpass) filter (donor) and a 600-nm long pass filter (acceptor) (n = 4; Error bars indicate SD).
Figure 6. A 96-well plate set-up for binding kinetics of a Fluorescent Tracer.
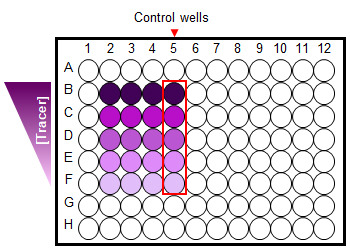
Cells treated with a limited serial dilution of a fluorescent Tracer (4-5 concentrations) in the absence and presence (control wells) of excess unmodified compound.
Figure 7. Representative analysis for binding kinetics of NanoBRET GPCR Tracer G-3 to transiently expressed HiBiT-β2-AR.
HEK293 cells expressing HiBiT-β2-AR were assayed as indicated in the protocol. Briefly, cells were transfected, grown overnight, and next day pre-treated with HiBiT detection reagent for 15 min prior to treatment with a titration of NanoBRET GPCR Tracer G-3 (i.e., the previously described propranolol-BODIPY ( Boursier et al., 2020 )). Kinetic measurements of filtered luminescence were taken using GloMax Discover Microplate Reader (Promega) equipped with a 450 nm (8-nm bandpass) filter (donor) and a 600-nm long pass filter (acceptor) (n = 3; Error bars indicate SD).
Figure 8. A 96-well plate set-up for competitive binding kinetics.
Cells treated with a limited serial dilution of unmodified test compound (4-5 concentrations including “0” unmodified test compound) in the presence of a fluorescent Tracer at a fixed EC60-EC80 concentration. Control wells treated with additional excess of unmodified compound.
Figure 9. Representative analysis for binding kinetic of propranolol to transiently expressed HiBiT-β2-AR in the presence of NanoBRET GPCR Tracer G-3.
HEK293 cells expressing HiBiT-β2-AR were assayed as indicated in the protocol. Briefly, cells were transfected, grown overnight, and next day treated with HiBiT detection reagent for 15 min prior to the treatment with propranolol titration alongside a fixed EC80 concentration of NanoBRET GPCR Tracer G-3 (i.e., the previously described propranolol-BODIPY ( Boursier et al., 2020 )). Kinetic measurements of filtered luminescence were taken using GloMax Discover Microplate Reader (Promega) equipped with a 450 nm (8-nm bandpass) filter (donor) and a 600-nm long pass filter (acceptor) (n = 3; Error bars indicate SD).
Recipes
-
DMEM Cell Culture Medium
Component Final Concentration
DMEM 90%
FBS 10%
100x Penicillin-streptomycin 1% (1x)
-
Opti-MEM Assay Medium
Component Final Concentration
Opti-MEM WITHOUT PHENOL RED 98 %
FBS 2%
100x Penicillin-streptomycin 1% (1x)
Acknowledgments
This protocols were derived from the work of Boursier et al., which was published in The Journal of Biological Chemistry ( Boursier et al., 2020 )
Competing interests
All authors were Promega employees at the time the protocols were developed.
Citation
Readers should cite both the Bio-protocol article and the original research article where this protocol was used.
References
- 1. Boursier M. E., Levin S., Zimmerman K., Machleidt T., Hurst R., Butler B. L., Eggers C. T., Kirkland T. A., Wood K. V. and Friedman Ohana R.(2020). The luminescent HiBiT peptide enables selective quantitation of G protein-coupled receptor ligand engagement and internalization in living cells. J Biol Chem 295(15): 5124-5135. [DOI] [PMC free article] [PubMed] [Google Scholar]
- 2. Cheng Y. and Prusoff W. H.(1973). Relationship between the inhibition constant(K1) and the concentration of inhibitor which causes 50 per cent inhibition(I50) of an enzymatic reaction. Biochem Pharmacol 22(23): 3099-3108. [DOI] [PubMed] [Google Scholar]
- 3. Ciruela F.(2008). Fluorescence-based methods in the study of protein-protein interactions in living cells. Curr Opin Biotechnol 19(4): 338-343. [DOI] [PubMed] [Google Scholar]
- 4. Copeland R. A.(2016). The drug–target residence time model: a 10year retrospective. Nat Rev Drug Discov 15(2): 87-95. [DOI] [PubMed] [Google Scholar]
- 5. Fang Y.(2012). Ligand-receptor interaction platforms and their applications for drug discovery. Expert Opin Drug Discov 7(10): 969-988. [DOI] [PubMed] [Google Scholar]
- 6. Flanagan C. A.(2016). GPCR-radioligand binding assays. Methods Cell Biol 132: 191-215. [DOI] [PubMed] [Google Scholar]
- 7. Hall M. P., Unch J., Binkowski B. F., Valley M. P., Butler B. L., Wood M. G., Otto P., Zimmerman K., Vidugiris G., Machleidt T., Robers M. B., Benink H. A., Eggers C. T., Slater M. R., Meisenheimer P. L., Klaubert D. H., Fan F., Encell L. P. and Wood K. V.(2012). Engineered luciferase reporter from a deep sea shrimp utilizing a novel imidazopyrazinone substrate. ACS Chem Biol 7(11): 1848-1857. [DOI] [PMC free article] [PubMed] [Google Scholar]
- 8. Hulme E. C. and Trevethick M. A.(2010). Ligand binding assays at equilibrium: validation and interpretation. Br J Pharmacol 161(6): 1219-1237. [DOI] [PMC free article] [PubMed] [Google Scholar]
- 9. Kenakin T.(2010). Being mindful of seven-transmembrane receptor'guests' when assessing agonist selectivity. Br J Pharmacol 160(5): 1045-1047. [DOI] [PMC free article] [PubMed] [Google Scholar]
- 10. Motulsky H. J. and Mahan L. C.(1984). The kinetics of competitive radioligand binding predicted by the law of mass action. Mol Pharmacol 25(1): 1-9. [PubMed] [Google Scholar]
- 11. Robers M. B., Vasta J. D., Corona C. R., Ohana R. F., Hurst R., Jhala M. A., Comess K. M. and Wood K. V.(2019). Quantitative, real-time measurements of intracellular target engagement using energy transfer. Methods Mol Biol 1888: 45-71. [DOI] [PubMed] [Google Scholar]
- 12. Santos R., Ursu O., Gaulton A., Bento A. P., Donadi R. S., Bologa C. G., Karlsson A., Al-Lazikani B., Hersey A., Oprea T. I. and Overington J. P.(2017). A comprehensive map of molecular drug targets. Nat Rev Drug Discov 16(1): 19-34. [DOI] [PMC free article] [PubMed] [Google Scholar]
- 13. Schwinn M. K., Machleidt T., Zimmerman K., Eggers C. T., Dixon A. S., Hurst R., Hall M. P., Encell L. P., Binkowski B. F. and Wood K. V.(2018). CRISPR-mediated tagging of endogenous proteins with a luminescent peptide. ACS Chem Biol 13(2): 467-474. [DOI] [PubMed] [Google Scholar]
- 14. Soave M., Kellam B., Woolard J., Briddon S. J. and Hill S. J.(2019). NanoBiT complementation to monitor agonist-induced adenosine A1 receptor internalization . SLAS Discov 25(2): 186-194. [DOI] [PMC free article] [PubMed] [Google Scholar]
- 15. Soave M., Stoddart L. A., Brown A., Woolard J. and Hill S. J.(2016). Use of a new proximity assay(NanoBRET) to investigate the ligand-binding characteristics of three fluorescent ligands to the human beta1-adrenoceptor expressed in HEK-293 cells. Pharmacol Res Perspect 4(5): e00250. [DOI] [PMC free article] [PubMed] [Google Scholar]
- 16. Stoddart L. A., Johnstone E. K. M., Wheal A. J., Goulding J., Robers M. B., Machleidt T., Wood K. V., Hill S. J. and Pfleger K. D. G.(2015). Application of BRET to monitor ligand binding to GPCRs. Nat Methods 12(7): 661-663. [DOI] [PMC free article] [PubMed] [Google Scholar]
- 17. Stoddart L. A., White C. W., Nguyen K., Hill S. J. and Pfleger K. D. G.(2016). Fluorescence- and bioluminescence-based approaches to study GPCR ligand binding. Br J Pharmacol(173): 3028-3037. [DOI] [PMC free article] [PubMed] [Google Scholar]
- 18. Sykes D. A., Stoddart L. A., Kilpatrick L. E. and Hill S. J.(2019). Binding kinetics of ligands acting at GPCRs. Mol Cell Endocrinol 485: 9-19. [DOI] [PMC free article] [PubMed] [Google Scholar]


