

Abstract
The natural history of small cell lung cancer (SCLC) includes rapid evolution from chemosensitivity to chemoresistance, although mechanisms underlying this evolution remain obscure due to scarcity of post-relapse tissue samples. We generated circulating tumor cell (CTC)-derived xenografts (CDXs) from SCLC patients to study intratumoral heterogeneity (ITH) via single-cell RNAseq of chemo-sensitive and -resistant CDXs and patient CTCs. We found globally increased ITH including heterogeneous expression of therapeutic targets and potential resistance pathways, such as EMT, between cellular subpopulations following treatment-resistance. Similarly, serial profiling of patient CTCs directly from blood confirmed increased ITH post-relapse. These data suggest that treatment-resistance in SCLC is characterized by coexisting subpopulations of cells with heterogeneous gene expression leading to multiple, concurrent resistance mechanisms. These findings emphasize the need for clinical efforts to focus on rational combination therapies for treatment-naïve SCLC tumors to maximize initial responses and counteract the emergence of ITH and diverse resistance mechanisms.
Keywords: SCLC, CDX, CTC, single-cell RNAseq, intratumoral heterogeneity
INTRODUCTION
SCLC is a high-grade neuroendocrine lung carcinoma notable for early dissemination and robust, albeit transient, responses to frontline platinum-based therapy that are rapidly followed by refractory relapses. Initial responses occur in more than 60% of patients. However, following relapse, approved therapies are effective in less than 20% of patients – underscoring a dramatic shift toward resistance. As a result, the median survival for these patients is only 12 months40. Improved molecular understanding of SCLC has translated into only modest clinical improvements, and, consequently, the National Cancer Institute identified SCLC as a recalcitrant malignancy with urgent areas of research needs including: identifying and targeting novel vulnerabilities, developing xenograft models, and defining mechanisms underlying rapid therapeutic resistance (https://www.congress.gov/bill/112th-congress/house-bill/733)41.
Tissue sampling of SCLC tumors typically occurs only at the time of diagnosis, and is often limited to scant cells acquired via fine needle aspiration. Patients rarely undergo surgical resection at any time or post-relapse biopsy. Several groups have illustrated the utility of engineering xenograft models of SCLC using circulating tumor cells (CTCs)42–44. SCLC CTCs represent metastatic cell populations and their abundance reflects burden of disease45. SCLC CTC-derived xenograft (CDX) models faithfully reflect the molecular landscape and clinical response of the original patient tumors42,43,46. In addition to CDX generation, liquid biopsies from SCLC patients provide a valuable resource to perform protein or transcriptional profiling of circulating tumor and immune cells. Furthermore, venipuncture is a minimally invasive procedure enabling valuable access to tumor cells at instances in SCLC’s natural history that were previously elusive, including post-relapse or longitudinally43.
SCLC was once considered a molecularly homogeneous malignancy; however, recent analyses led to the classification of molecular subtypes based on intertumoral heterogeneity in the expression of ASCL1, NEUROD147,48, POU2F349, NKX2–150, Notch pathway genes51, MYC family genes, and neuroendocrine genes among others52. Often, the predominant subtype mediates specific therapeutic vulnerabilities, as in the relative sensitivity of MYC/NEUROD1-driven SCLC to Aurora kinase inhibitors48,50. Intratumorally, heterogeneity is evidenced in genetically engineered mouse models (GEMMs) of SCLC by the juxtaposition of persistent neuroendocrine cells and non-neuroendocrine, chemoresistant cells51. These data suggest that coexistence of transcriptionally heterogeneous tumor cell populations with distinct vulnerabilities and resistance mechanisms could underlie SCLC’s ability to evolve rapidly from chemosensitive to overwhelmingly chemoresistant. The exploration of such intratumoral heterogeneity (ITH), however, requires genomic and/or expression analysis of large numbers of cells, which, in SCLC, has been hindered by the lack of biopsy specimens and animal models of relapsed disease. Overall, many questions remain regarding the scale and evolution of ITH in SCLC and how it contributes to clinical outcomes.
To investigate the contribution of heterogeneity to therapeutic resistance, we generated CDX models from SCLC patients that mimic patient tumor genomics and response to chemotherapy. We performed baseline single-cell RNAseq analyses of platinum-sensitive and resistant CDX models, as well as longitudinal single-cell RNAseq analyses of CDX models and patient CTCs over the course of therapy. With the onset of resistance in each model, we observe not only increases in ITH, but the emergence of distinct cellular populations defined by established drug resistance gene signatures. To confirm this relationship between ITH and resistance, platinum-sensitive CDX models were subjected to extended treatment with cisplatin chemotherapy or DNA damage response inhibitors until relapse. Single-cell RNAseq confirmed that untreated tumors were molecularly homogeneous, while relapse was associated with increased ITH and distinct variations in expression of therapeutic targets or EMT genes between cellular populations. Longitudinal single-cell profiling of CTCs directly from patient blood before, during, and after platinum-relapse confirmed increased ITH post-relapse accompanying unique gene expression patterns within specific cell populations that are reflected in a paired CDX. These data suggest that, in response to treatment, SCLC develops increasing transcriptional ITH marked by concurrent, diverse resistant cell clusters. Clinically, these data underscore the importance of maximizing and maintaining the initial response in platinum-sensitive SCLC tumors and highlight the intrinsic transcriptional fluidity underlying SCLC’s profound treatment resistance following initial therapy.
RESULTS
Single-cell Transcriptomic Analysis of CDXs
We generated CDX models from SCLC patients at various treatment milestones. From these, we selected models to represent a range of expected platinum-responses. The predicted platinum-sensitive models included those derived from patients (MDA-SC39, MDA-SC68, HCI-008) who were treatment-naïve and another (MDA-SC4) who had received only a single cycle of platinum-based chemotherapy. Meanwhile, predicted platinum-resistant models included those derived from patients (MDA-SC16, MDA-SC49, MDA-SC55) following relapse post-frontline platinum therapy and another (MDA-SC75) who, while treatment-naïve, had minimal response to frontline platinum chemotherapy (Figure 1a). As expected42,43, these tumors were histologically consistent with SCLC and with the diagnostic IHC performed on the corresponding patient tumors (patient IHC data in Extended Data Figure 1a,b). Interestingly, spontaneous leptomeningeal disease developed and was detected in mice with MDA-SC39 flank tumors (Figure 1b). This observation provides histological evidence of spontaneous leptomeningeal disease in SCLC xenograft models and is consistent with the presence of central nervous system metastasis in the patient (Extended Data Figure 1c).
Figure 1.
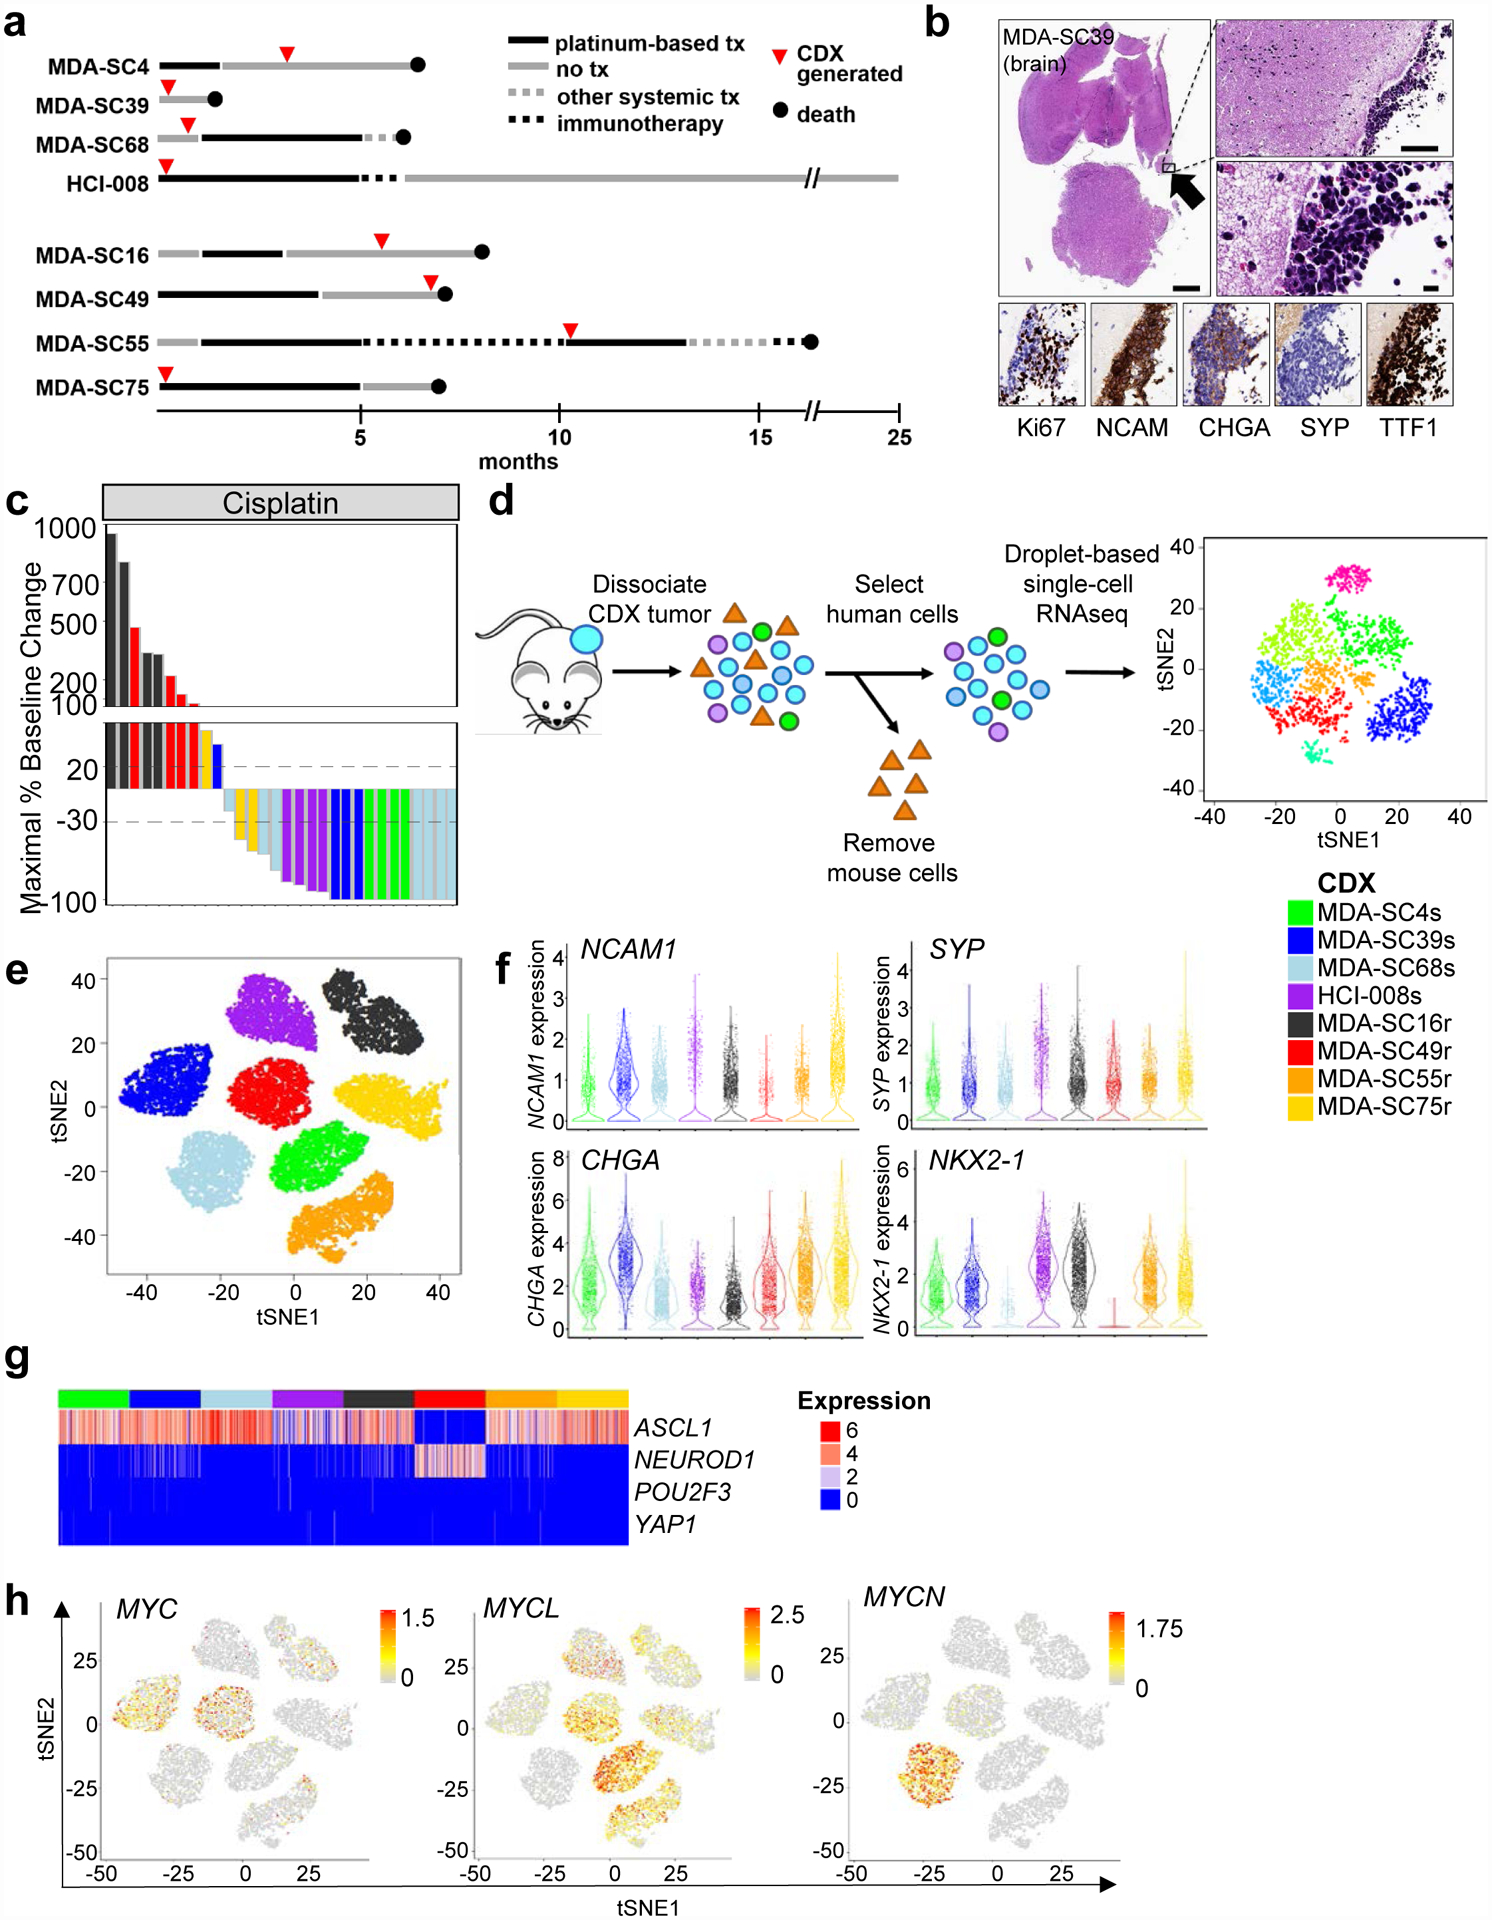
SCLC CDXs mimic patient disease at the single-cell transcriptional level and by platinum-response. a, Representation of patient clinical course including the time point at which blood was collected for CDX generation (red circles). Arrows indicate treatment and are drawn to scale. b, Histological images of leptomeningeal disease detected in MDA-SC39, including characterization of standard SCLC markers. The presence of leptomeningeal disease was detected in one of five mice whose brains were examined. Scale bars = 1mm, 100 μm, or 10 μm. c, Waterfall plot of maximal baseline change from treatment of CDXs with cisplatin. MDA-SC4s, MDA-SC39s, MDA-SC68s and HCI-008s are platinum-sensitive, while MDA-SC16r, MDA-SC49r, MDA-SC55r, and MDA-SC75r are platinum-resistant. d, Schematic describing method for performing single-cell RNAseq on CDXs. e, Cells from each CDX are more similar to themselves than to other models. t-SNE analysis of eight CDXs. f, Violin plots indicating range of expression of NCAM1, SYP, CHGA, and NKX2–1 (TTF1) in single cells from each CDX. Each dot represents one cell and the violin curve represent the density of the cells at different expression levels. g, Expression pattern of ASCL1/NEUROD1/POU2F3/YAP1 genes within each CDX. h, t-SNE feature plots showing heterogeneity of expression of MYC, MYCL, and MYCN in all CDXs. In e, f, and g n=2,000 cells.
Consistent with the patients’ clinical histories, MDA-SC4, MDA-SC39, and MDA-SC68 were extremely sensitive to cisplatin in vivo, while MDA-SC16 and MDA-SC49 were resistant and MDA-SC75 exhibited an intermediate response (stable disease; Figure 1c). Additionally, CDX tumors were genomically consistent with SCLC, including universal loss of TP53 and frequent loss of RB1 (Extended Data Figure 1d). Tumor genomics were stably preserved across multiple passages (Extended Data Figure 1e). Of note, for patient MDA-SC49, a PDX model was derived from a malignant pleural effusion on the same day blood was collected for CTCs, yielding paired CDX and conventional PDX models for this patient. These models are genomically, transcriptionally, and proteomically (Extended Data Figure 1a, f, g) similar and match what is known of the patient from whom they were derived (e.g., loss of TTF1 in Extended Data Figure 1b).
To investigate ITH, CDX tumors (n=1–3 per model) were dissociated, sorted for human cells to remove any potential mouse contribution and subjected to single-cell RNAseq analysis (>3,500 cells per model; Figure 1d). The sequenced cells represent specifically the cancer cell population, as confirmed by expression of neuroendocrine (NE) markers (UCHL1, NCAM1, SYP, and CHGA) in sequenced cells from all models (Extended Data Figure 2a). As with other cancers53, clustering of cells was primarily driven by the patient/CDX of origin (intertumoral heterogeneity; Figure 1e). The existence of such intertumoral heterogeneity is representative of SCLC and lung cancers, in general54,55. Furthermore, intertumoral heterogeneity between patients has previously been demonstrated in single-cell profiling of tumor biopsies53.
The ITH is not driven by individual tumors, as single-cell RNAseq analysis of replicate samples reveal admixing of cells from distinct, biological CDX replicates from the same model and passage grown in different mice (Extended Data Figure 2b). Consistent with SCLC and corresponding patient tumor IHC, all CDXs contained large numbers of cells expressing neuroendocrine-specific genes (NCAM1, SYP, CHGA), while one CDX exhibited loss of NKX2–1 and high MYC (confirmed by WES), a feature observed in ~20% of SCLC tumors56 (Figure 1f). Expression of these SCLC marker genes as with other genes investigated demonstrate variability in expression within cells from each model.
Classifying SCLC molecular subtypes via single-cell RNAseq
Using the single-cell RNAseq data, we first established the molecular subtypes of the CDX models based on their expression of both neuroendocrine and non-neuroendocrine markers, ASCL1/NEUROD1/POU2F3/YAP1 transcription factors, MYC family members, and EMT score in CDXs49,55,57,58. Single-cell RNAseq analyses revealed that CDXs are predominantly neuroendocrine (Extended Data Figure 2c). Abundant expression of ASCL1 was detected both platinum-sensitive (MDA-SC4s, MDA-SC39s, MDA-SC68s, and HCI-008s) and platinum-resistant CDXs (MDA-SC16r, MDA-SC55r, and MDA-SC75r), while one platinum-resistant model (MDA-SC49r) expressed high NEUROD1 (Figure 1g; Extended Data Figure 2d). No CDX contained large populations of cells expressing POU2F3 or YAP1.
As MYC family members are amplified in ~20% of SCLC58 and play a role in tumor propagation and drug resistance in SCLC and other tumors48,50,59, we investigated whether expression of MYC, MYCL, and MYCN were enriched in our CDX tumors. MYC was expressed by a moderate number of cells in two CDXs (MDA-SC39s and MDA-SC49r), while MYCL was expressed in three CDXs (MDA-SC4s, MDA-SC49r, MDA-SC55r) and MYCN was abundantly expressed in only MDA-SC68s (Figure 1h; Extended Data Figure 2e). Notably, we also witnessed evidence in vivo of aggressive behavior imparted by MYC activation, as in MDA-SC39s wherein we observed spontaneous leptomeningeal metastasis (Figure 1b). This is consistent with a known role for MYC in driving CNS metastatic potential60,61.
Like MYC family genes, EMT is associated with treatment resistance and metastasis62,63. SCLC is a primarily epithelial malignancy, with high expression of epithelial genes (CDH1, EPCAM, etc.) in most CDXs at the single-cell level. However, three CDX models (MDA-SC39s, HCI-008s and MDA-SC49r) have a relatively higher proportion of cells expressing the mesenchymal gene encoding vimentin (VIM) and elevated EMT scores, consistent with epithelial-to-mesenchymal transformation (Extended Data Figure 2f). As with MYC family gene expression, we observe that EMT score is not uniform across cells within a single tumor, suggesting that more complex transcriptional programs also demonstrate ITH. In the platinum-resistant model MDA-SC49r, for example, we observe significant fractions of high and low MYC expressing cells, high and low MYCL expressing cells, and mesenchymal and epithelial cells (Figure 1h; Extended Data Figure 2e,f). Observations like these suggested that ITH may underlie the capacity for concurrent, seemingly unrelated resistance mechanisms within individual tumors and that global increases in ITH may accompany the onset of therapeutic resistance.
Baseline ITH in CDX Models
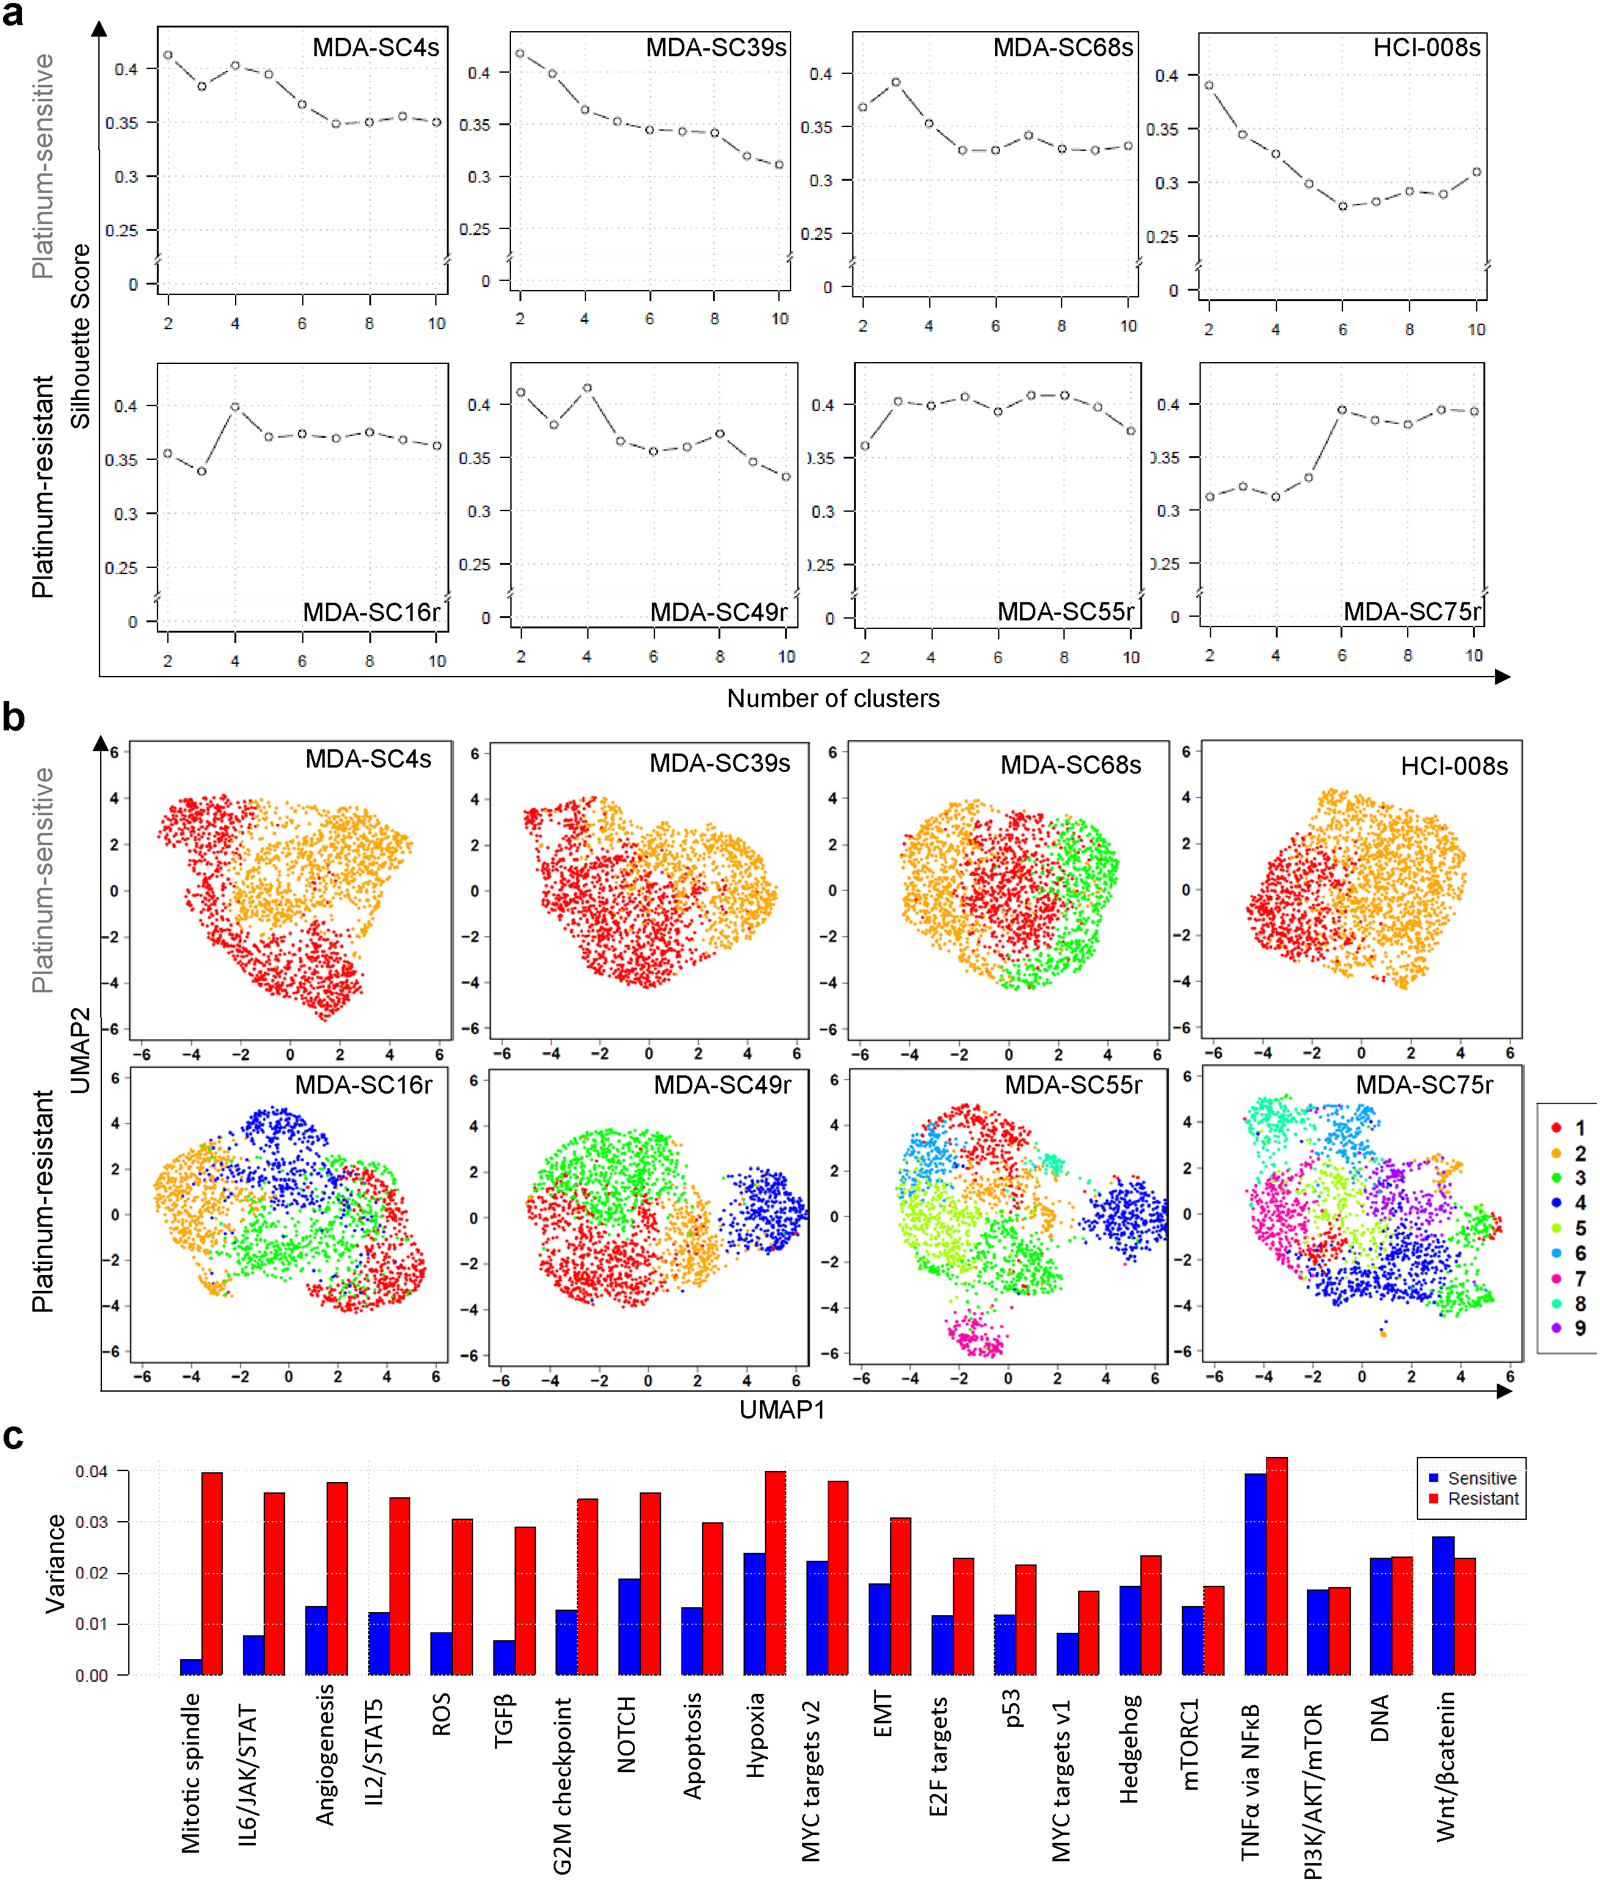
To estimate the degree of ITH in our models, we identified genes with highly variable expression within individual CDXs after correcting for cell cycle. To quantitate heterogeneity, an ITH score was calculated for each CDX tumor. We define the ITH score as the average distance between the normalized expression profiles of each cell to all other cells in the sample and found higher ITH-scores in the platinum-resistant CDXs (P<2.2e-16, Figure 2a). ITH score selects first for most highly variable genes followed by comparison in principle component space, introducing some limitations to this approach. As an alternative measure of ITH, we also calculated the dispersion between cells within the t-SNE plot for each tumor and similarly found greater dispersion in the gene expression profiles of the platinum-resistant CDXs (P=0.05, Figure 2b). Using t-distributed stochastic neighbor embedding (t-SNE) analysis for each individual CDX, we determined the optimal number of clusters in each model (Extended Data Figure 3a). We discovered between two and three distinct single-cell clusters in each platinum-sensitive model, whereas between four and nine single-cell clusters were observed in platinum-resistant models (platinum-sensitive vs. -resistant, P<0.01; Figure 2c and Extended Data Figure 3b). We observed that MDA-SC75r, although derived after minimal exposure to platinum, possessed high ITH and cluster number. Notably, the patient from which this tumor was derived demonstrated de novo platinum-resistance.
Figure 2.
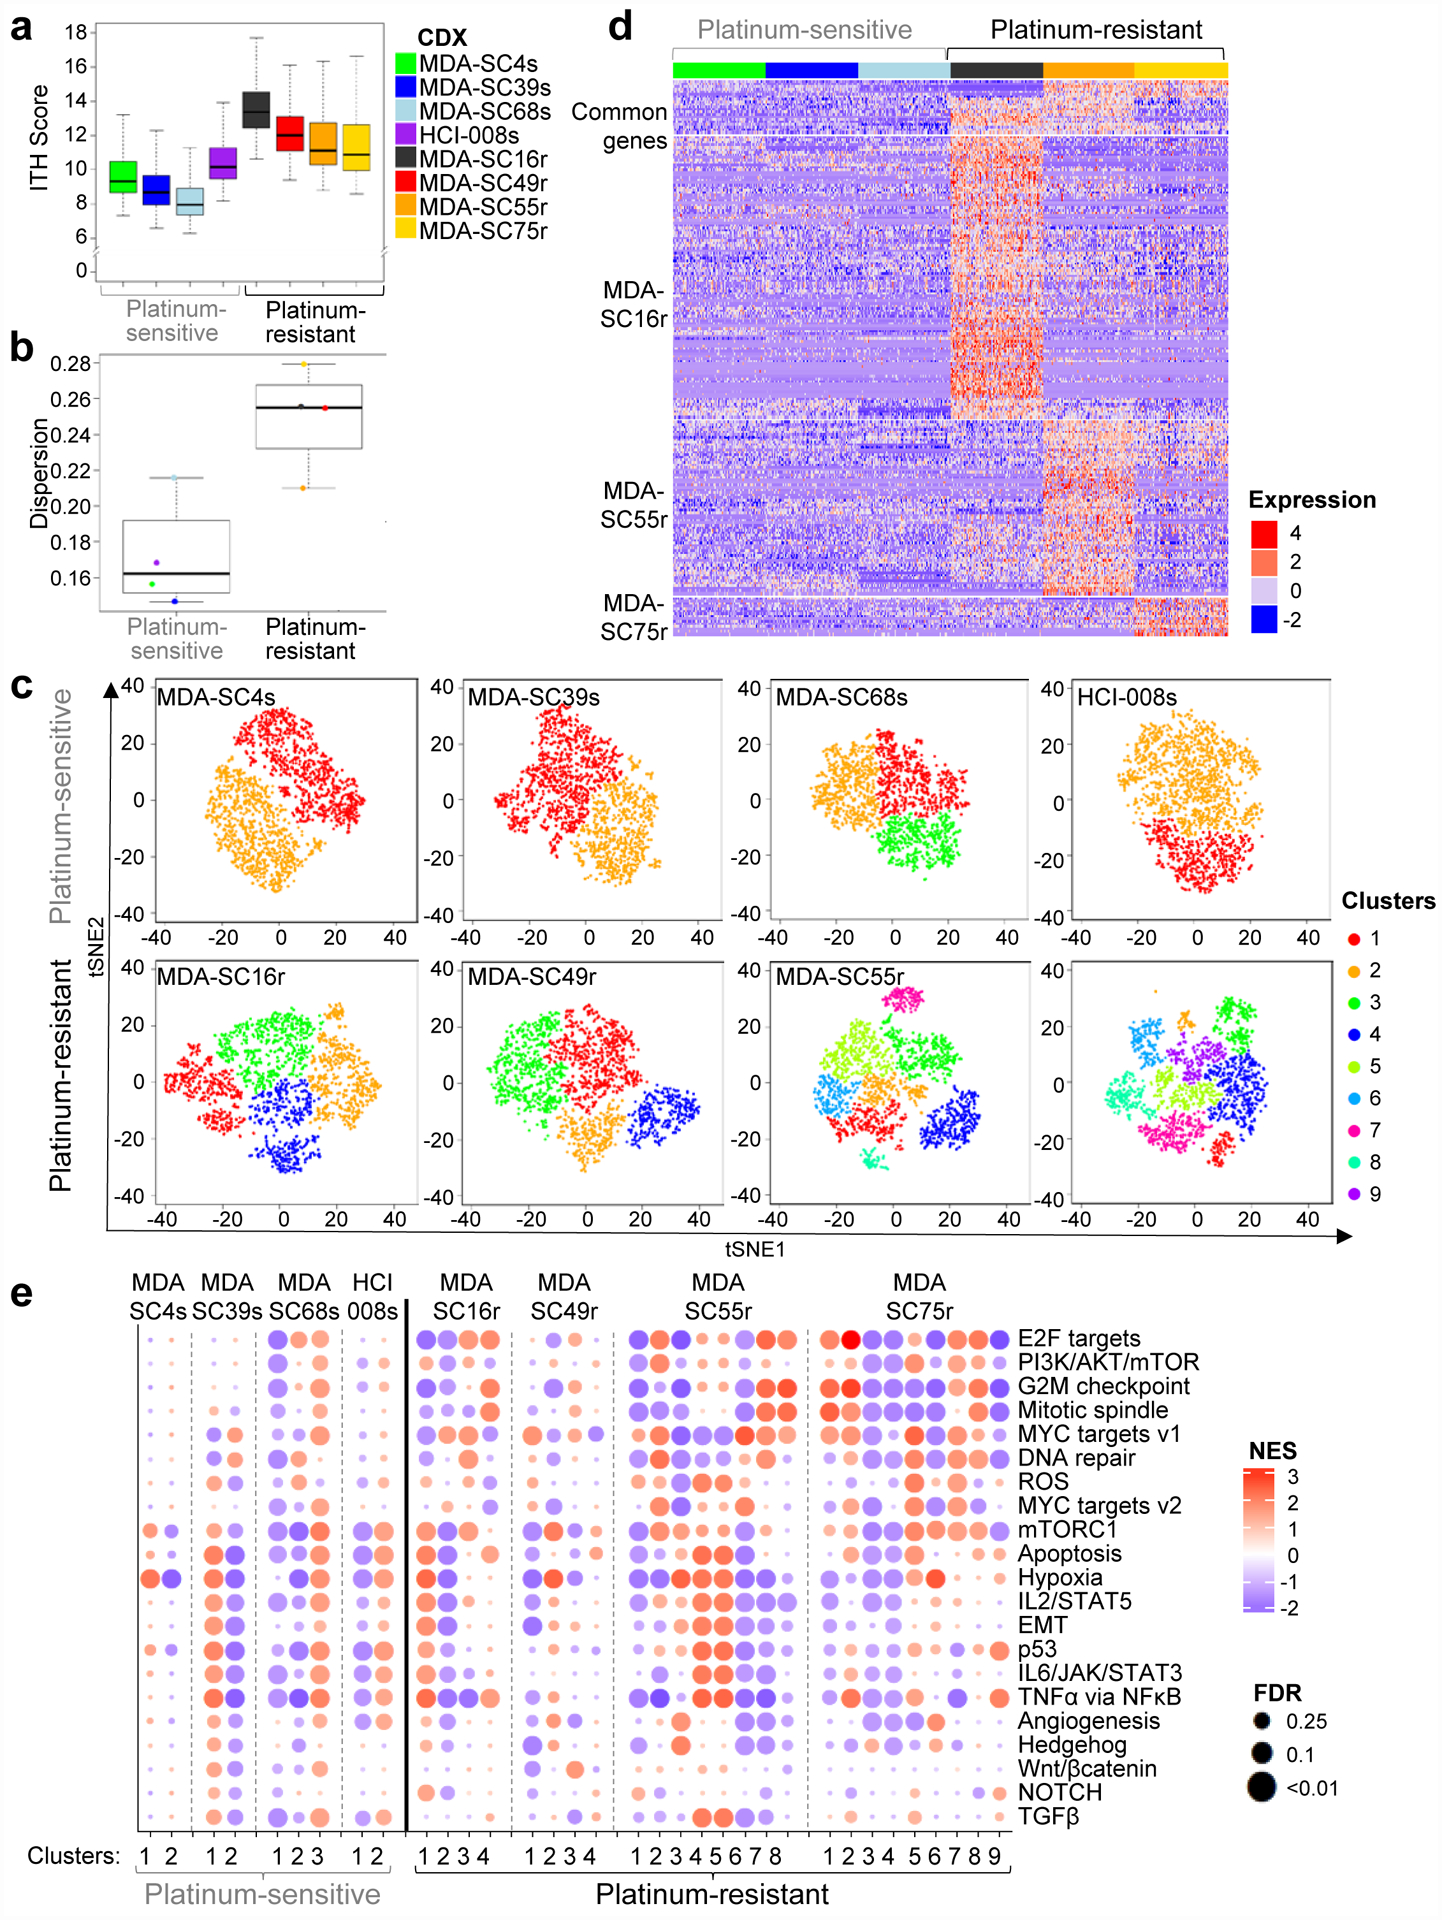
Platinum-resistant disease is associated with increased ITH. a, Platinum-resistant CDXs exhibit a higher ITH score than platinum-sensitive CDXs, as determined by two-sided Wilcoxon rank sum test. No adjustments were made for multiple comparisons (P<2.2e-16; n=2,000 cells per CDX). b, Gene expression dispersion for platinum-sensitive and platinum-resistant CDXs by two-sided Wilcoxon rank sum test (P=0.05; n=8 CDX models). c, t-SNE visualization of cell subpopulations from individual CDXs (n=2,000 per CDX. d, Expression heatmap of common and model specific differential genes for ASCL1-driven sensitive CDXs (MDA-SC4s, MDA-SC39s, MDA-SC68s) and resistant CDXs (MDA-SC16r, MDA-SC55r, MDA-SC75r). The differential genes were identified by intersection of up-regulated genes in resistant CDX compared with each sensitive CDXs. Genes were identified that were commonly upregulated in at least two resistant CDXs (GRP, TCF4, HES6), or specifically in MDA-SC16r (CDKN2A, NKX2–1, STAT1, TOP2A, NFIB, NEAT1), MDA-SC55r (ASCL2, KDM1A, MALAT1), or MDA-SC75r (PGAM2, NBL1). The statistical cutoffs are set to adjusted p-value <0.05 (two-sided Wilcoxon rank sum test) and log2 fold change > 0.7 (n=6 CDX models). e, Gene set enrichment analysis with NES and FDR q-values for hallmark gene sets associated with clusters in all eight CDXs. No statistical method was used to predetermine sample size. GSEA Kolmogorov-Smirnov test. P-values were adjusted for multiple comparisons. In a, b center lines show the medians; box limits indicate the 25th and 75th percentiles; whiskers extend 1.5 times the interquartile range from the 25th and 75th percentiles.
Unsupervised analyses were performed to determine whether ASCL1-driven platinum-resistant CDX models shared common signaling genes or potential regulatory mechanisms found that the majority of genes differentially expressed between platinum-sensitive and -resistant CDXs were only detectable in a single CDX rather than genes commonly upregulated in two or more resistant models (Figure 2d). Next, we performed Gene Set Enrichment Analysis (GSEA) to assess gene expression pathways associated with specific cell clusters in each CDX (Figure 2e). As expected, platinum-resistant CDX models demonstrate increased variance (Extended Data Figure 3c, P=2.9e-6; n=21 pathways) and complexity with upregulation of multiple, unique, resistance-associated pathways specific to cellular subpopulations. While many of these pathways have been previously shown to be associated with platinum-resistance in SCLC (MYC, mTOR, EMT, WNT, etc.)43,44,62,64, co-existence within a single tumor is a key finding. Platinum-sensitive SCLC does exhibit ITH with regards to gene expression (i.e., MYC family expression), EMT, ITH score, and pathway analysis, which may allow it to diversify rapidly to an even more heterogeneous state. Additionally, inferred copy number analysis was performed to compare clusters in the resistant CDXs and copy number variation was similar between clusters within a CDX. This supports that ITH is driven by transcriptional changes and not genomic or copy number changes (Extended Data Figure 4a,b). These results suggest that not only are the mechanisms of cisplatin resistance distinct between tumors, but that even within a single tumor, targeting multiple pathways (e.g., MYC and EMT) may be necessary to overcome platinum-resistance in SCLC.
Transcriptional Diversity between Subpopulations
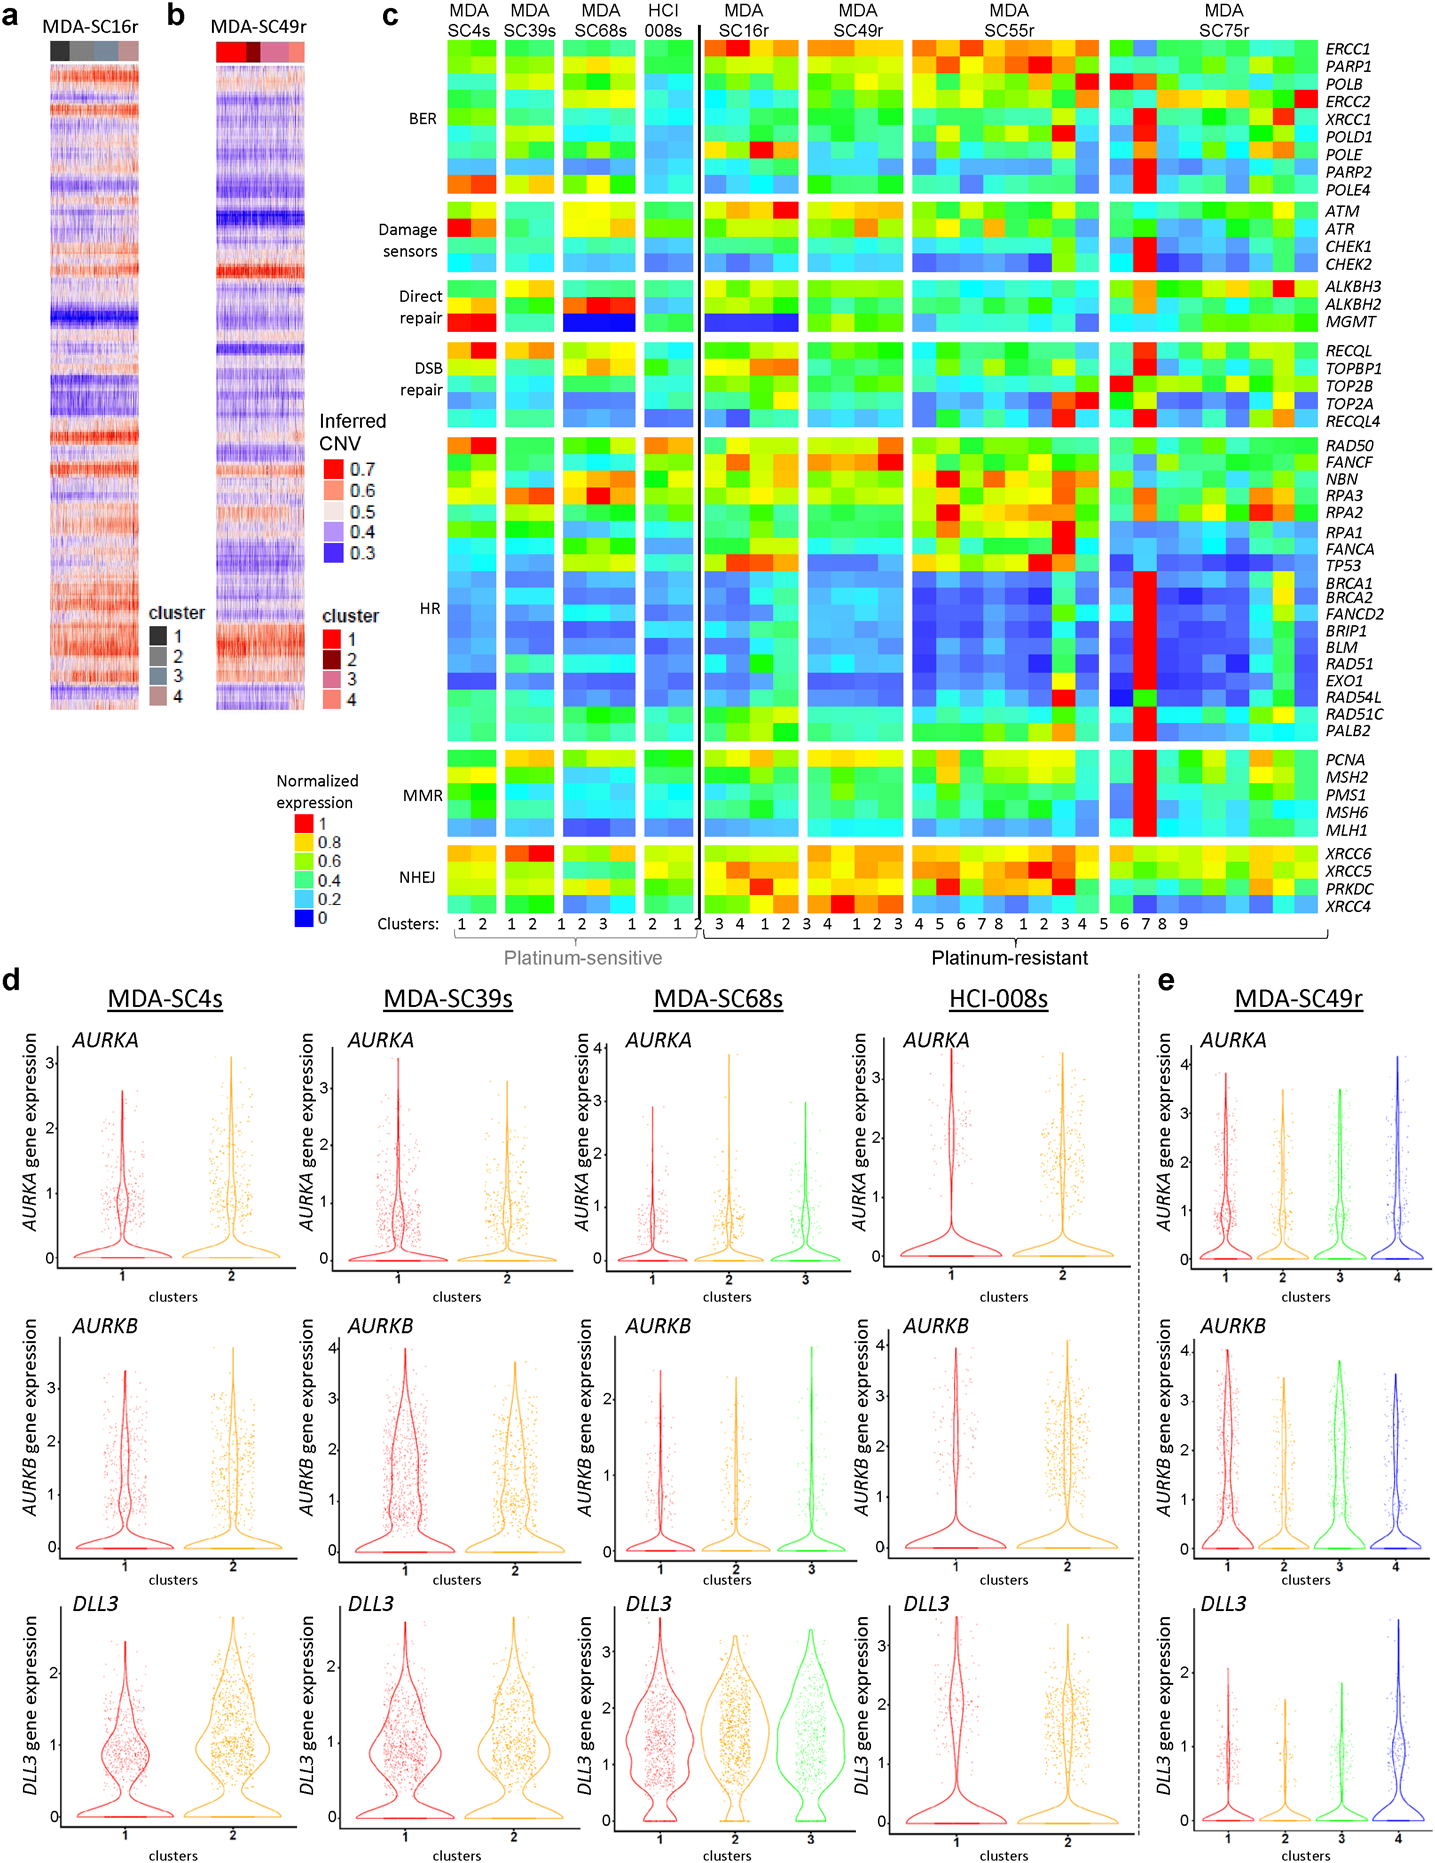
Comparing gene expression between baseline platinum-sensitive and -resistant CDXs failed to detect any single gene or gene pair that clearly defined resistance or ITH, suggesting more complex molecular processes. GSEA clarified some of this complexity by identifying pathways associated with resistance that are druggable and in clinical investigation (ex. mitotic spindle, DNA repair/E2F1, EMT, etc.) leading us to focus specifically on therapeutic target genes (Aurora kinase genes, PARP1, CHEK1, etc.) and EMT-associated genes. Little inter-cluster variation in expression among these genes was detectable in the treatment-naïve CDXs (Figure 3a). In contrast, platinum-resistant CDXs demonstrated significant diversity in expression of either therapeutic targets or EMT between clusters from a single CDX. Many SCLC therapeutic targets are part of the DNA repair pathway65 and a similar pattern of expression was detected for genes associated with DNA repair (Extended Data Figure 4c). As expected, clusters with high MYC expression tend to have low BCL2 expression and vice versa66. To highlight a few genes at the single-cell level, AURKA, AURKB, and DLL3, each a putative therapeutic target in SCLC, exhibited elevated expression only within specific clusters from platinum-resistant MDA-SC16r, MDA-SC55r, and MDA-SC75r (Figure 3b). As AURKA and AURKB encode targets of Aurora kinase inhibitors, the heterogeneity of their expression among the platinum-resistant models may have important implications for depth of response to this class of agents.
Figure 3.
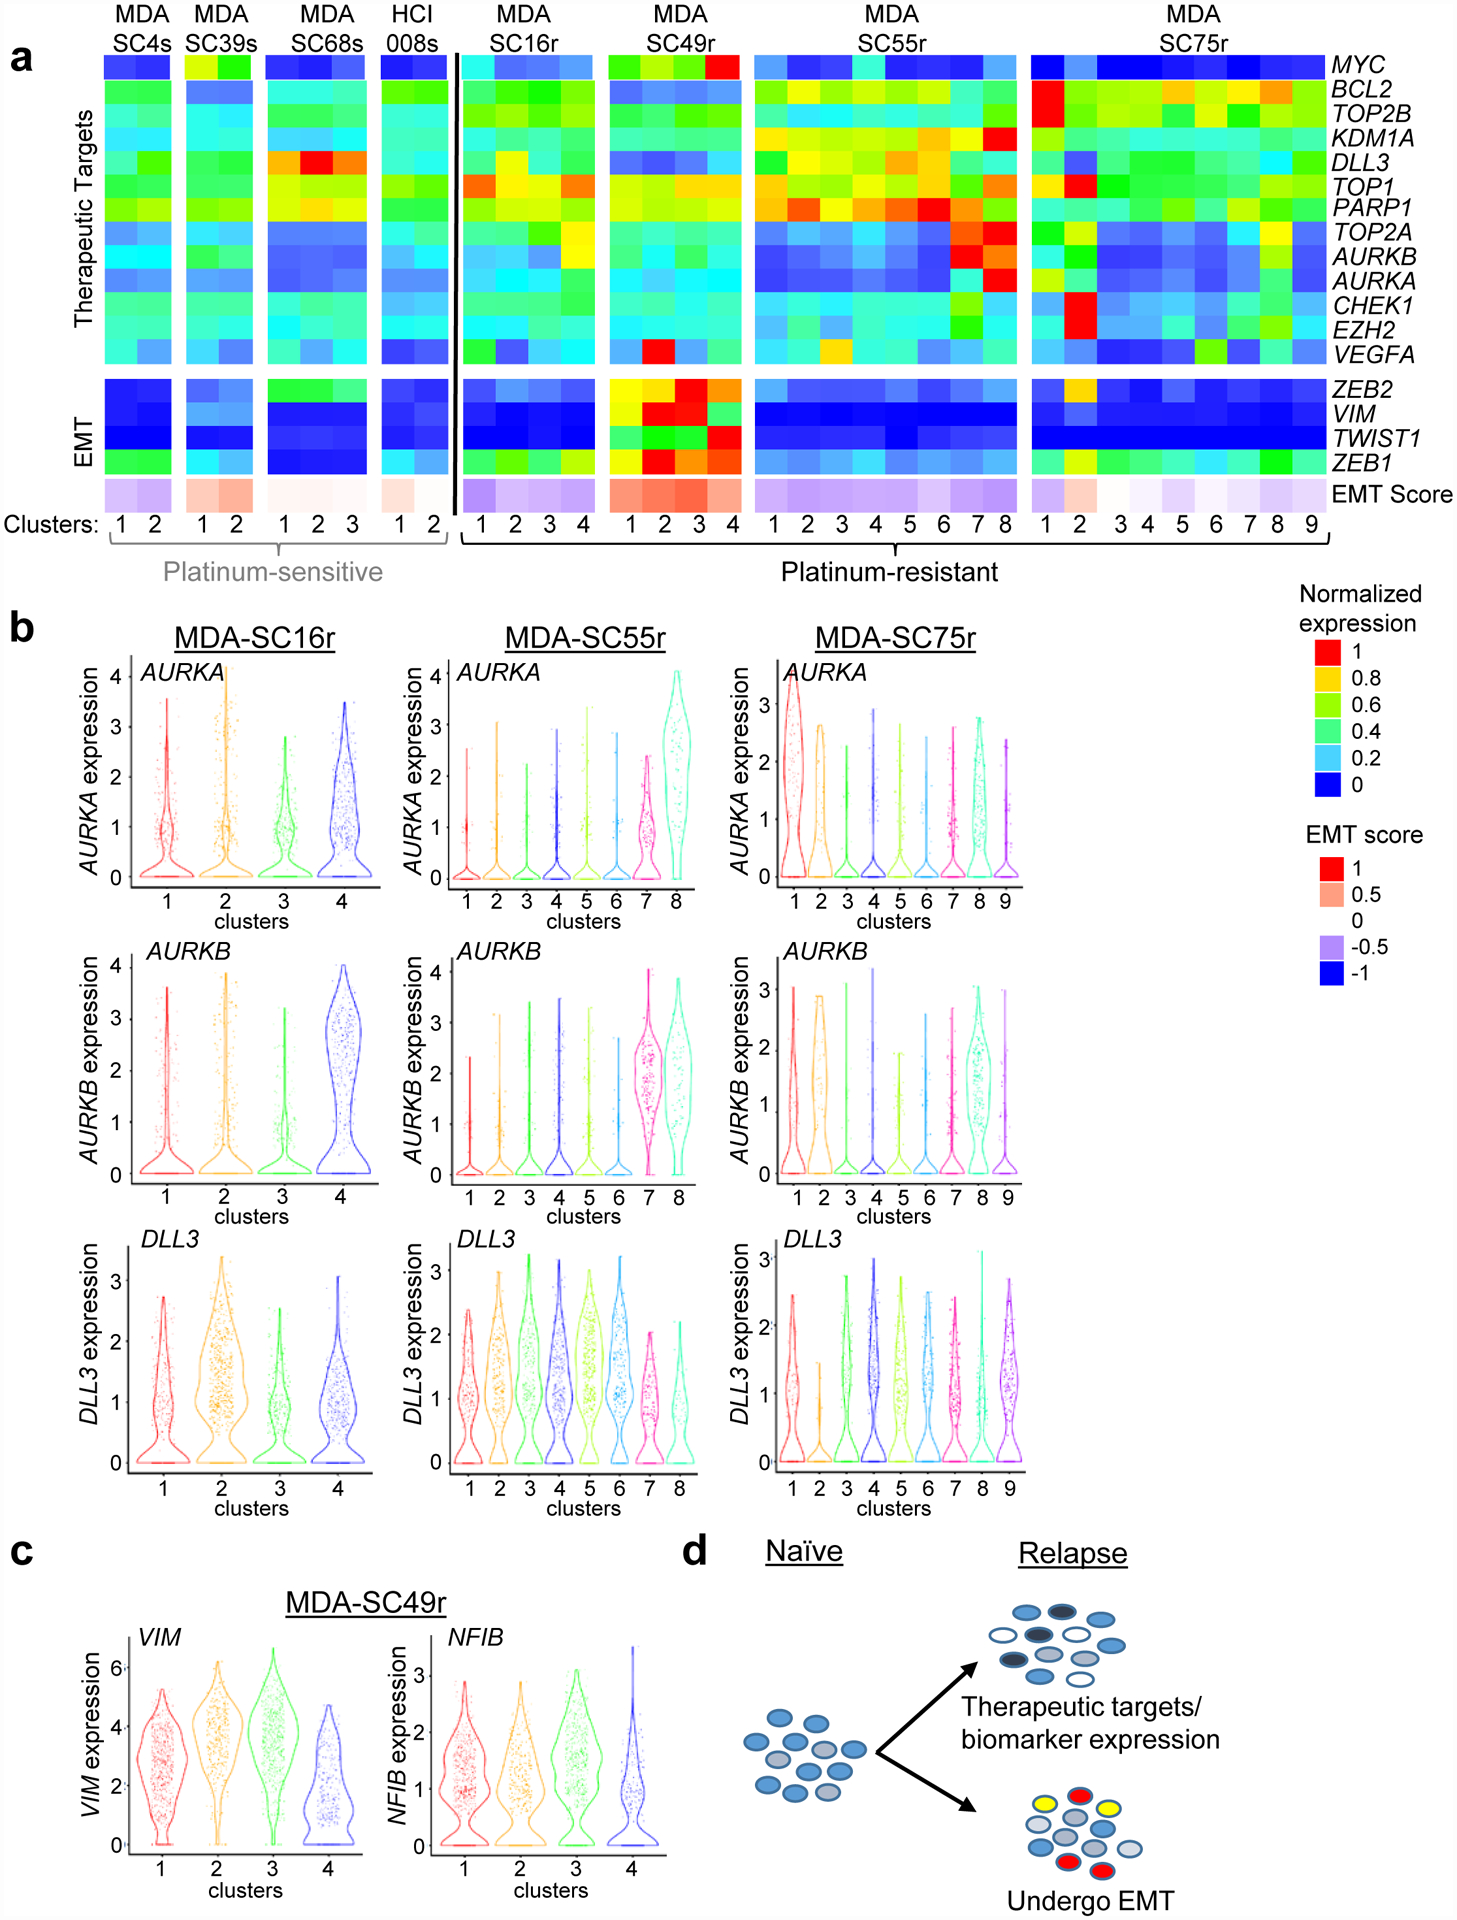
Platinum-resistance is associated with heterogeneous expression of therapeutic targets or EMT-related genes within specific clusters. a, Expression of specific therapeutic targets, EMT-related genes, or EMT score in the clusters from all eight CDXs. Little variation was detected in clusters from platinum-sensitive CDXs. b, Violin plots of expression of several therapeutic targets (AURKA, AURKB and DLL3) within clusters from three platinum resistant CDXs (MDA-SC16r, MDA-SC55r and MDA-SC75r). MDA-SC16r: n=438, 557, 554, 451 cells for clusters 1–4; MDA-SC55r: n=271, 216, 360, 365, 384, 190, 148, 66 cells for clusters 1–8; MDA-SC75r: n=109, 69, 228, 453, 233, 187, 296, 207, 218 cells for clusters 1–9. c, Violin plots of VIM and NFIB expression within individual clusters from MDA-SC49r. Each dot represents one cell and the violin curve represent the density of the cells at different expression levels. MDA-SC49r: n=683, 317, 652, 348 cells for clusters 1–4. d, Schematic indicating that changes in gene expression in the platinum-sensitive cells gives rise to variation in either therapeutic targets or EMT-related genes.
Increased expression of these target-encoding genes was not detectable in clusters of treatment-naïve models or MDA-SC49r (Extended Data Figure 4d). In the latter case, MDA-SC49r cells exhibited increased, but varying, expression of EMT-associated genes, including VIM, among its clusters (Figure 3c). The VIM-high clusters (clusters 1–3), also express high levels of NFIB, a gene associated with disease dissemination in both SCLC patients and GEM models67–69. Unexpectedly, variation in expression of either DNA repair or EMT genes were mutually exclusive (Figure 3d). Overall, this suggests resistant SCLC is characterized by diverse expression of putative resistance mechanisms and targets.
Single-cell Transcriptomic Profiling of Patient CTCs
Levels of CTCs in SCLC are among the highest of all solid tumors42,70–73. To determine whether CTC quality and number in SCLC patients are sufficient to sequence directly, we collected blood from patient MDA-SC55 prior to platinum-etoposide treatment (diagnosis), at maximal response (responding), and following relapse (relapsed) (Figure 4a). CTC abundance reflected the patient’s clinical course, with the greatest number of CTCs found in the treatment-naïve (84 CTCs) and relapsed samples (627 CTCs), compared to maximal response (1 CTC) (Figure 4a). CTCs were isolated for CDX generation at all three time points, but a model was generated only following relapse (MDA-SC55r CDX).
Figure 4.
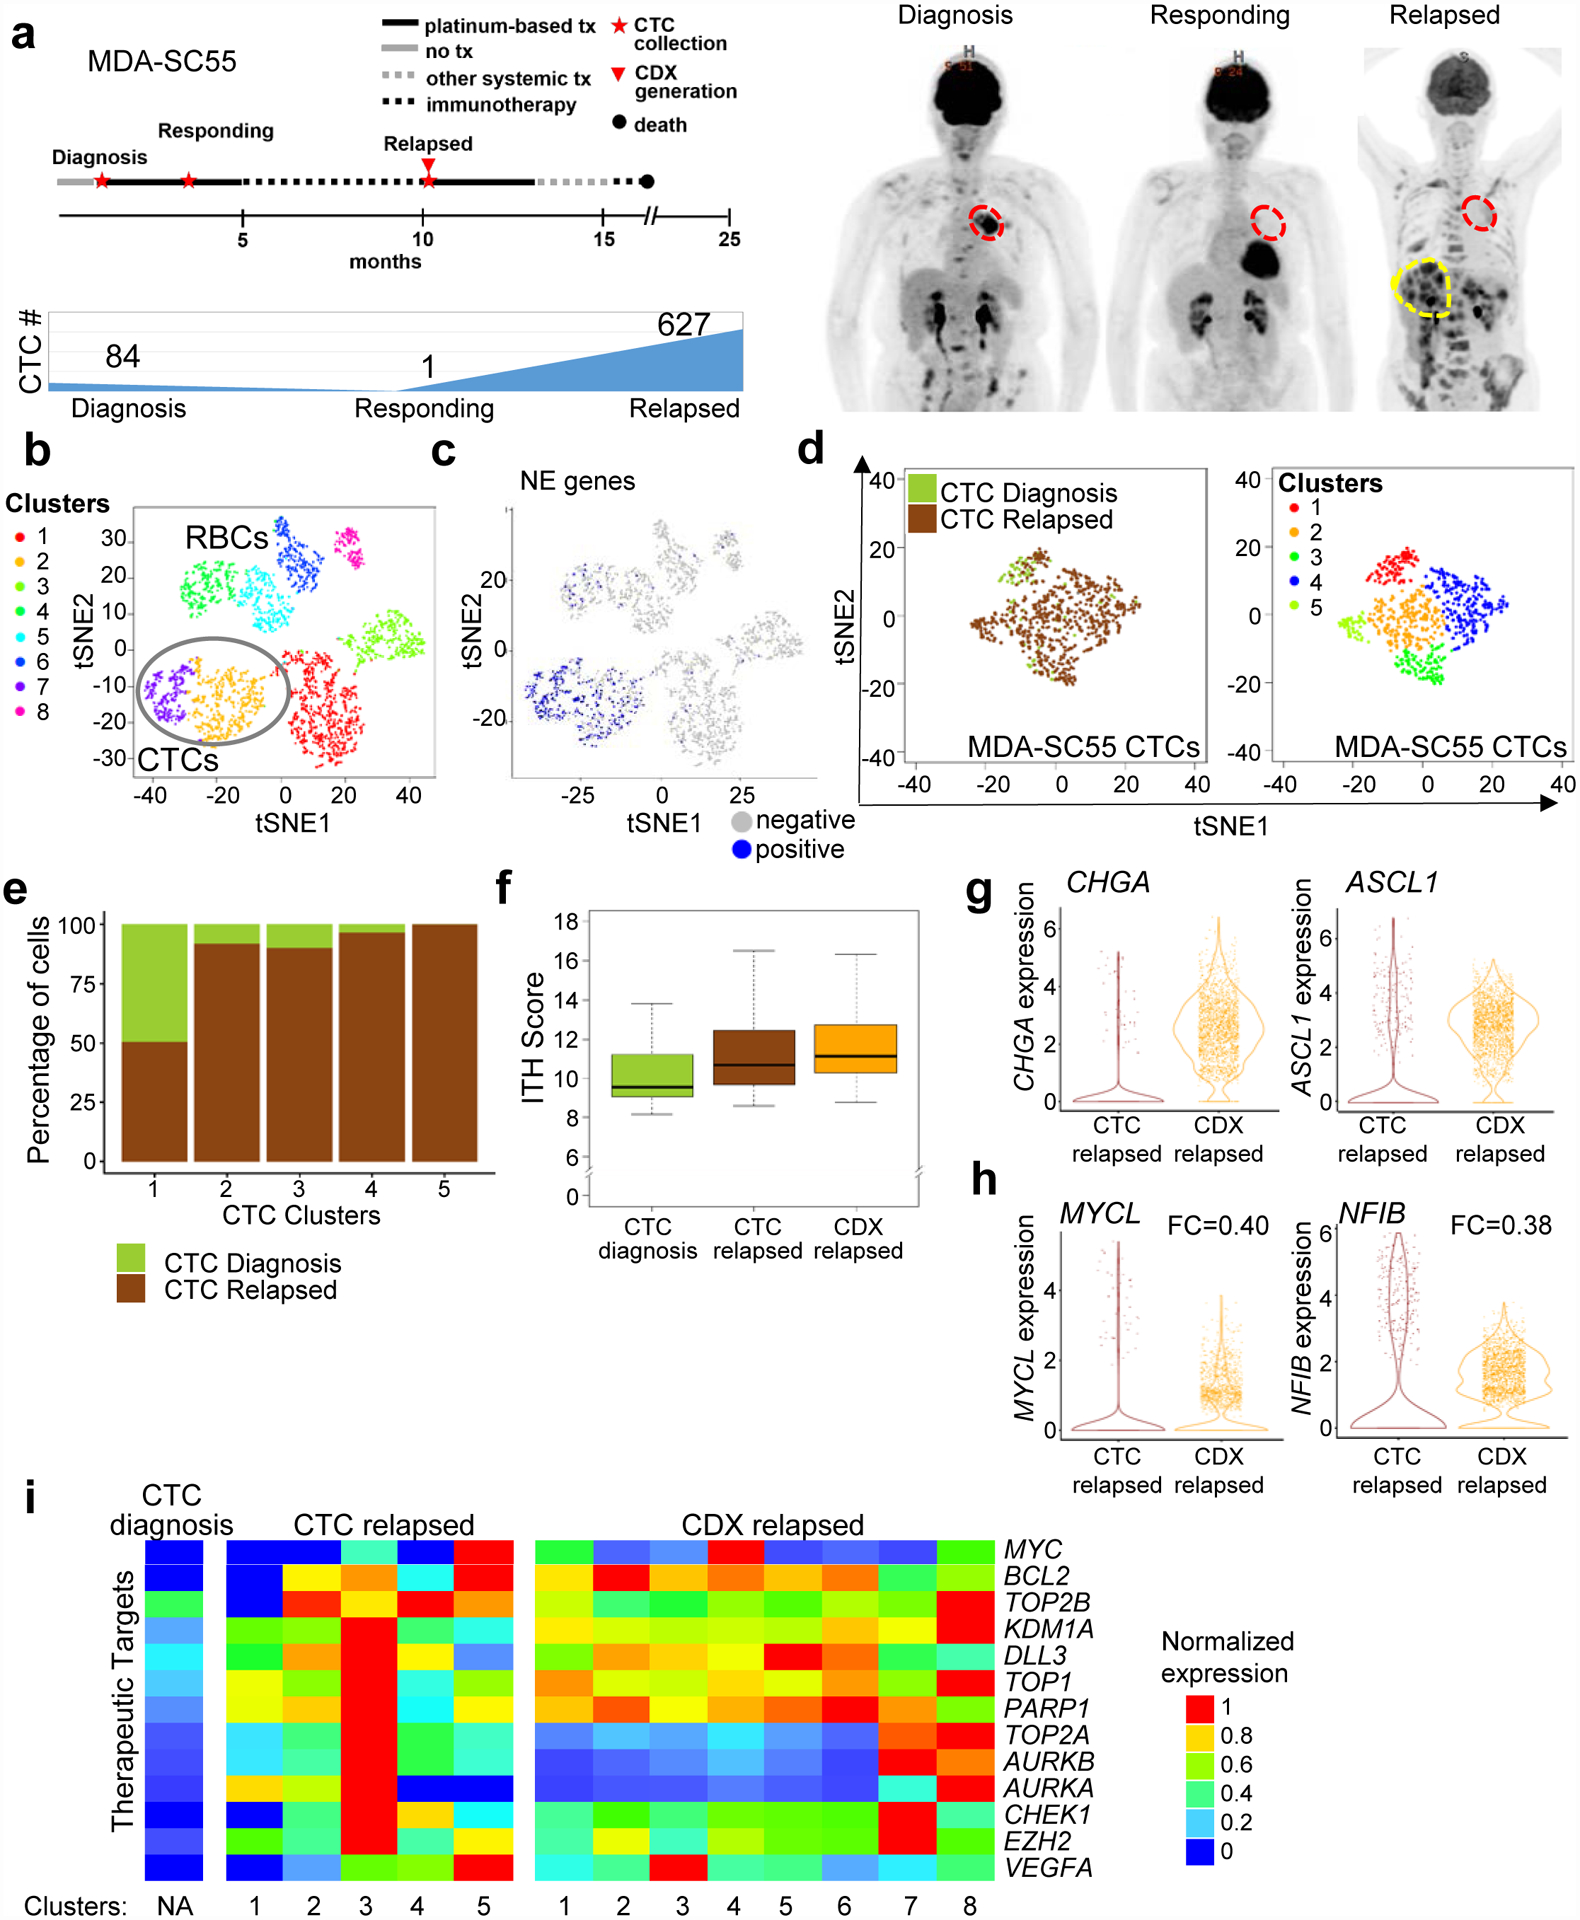
Serial single-cell RNAseq analysis of patient CTCs revealed similar transcriptional heterogeneity to a paired CDX. a, Representation of patient MDA-SC55 clinical course at the time blood was collected for CTC analysis and CDX generation. Patient MDA-SC55 body scans performed at the time blood was collected (red indicates lung primary tumor; yellow indicates liver metastases) and CTC numbers at the time of collection. These samples were collected from one patient along the course of treatment and represent an isolated collection at a specific time point. b, t-SNE plot of pooled MDA-SC55 cells at diagnosis, responding and relapsed time points revealed eight separate clusters, cluster 2 and 7 were identified as CTCs (circled). c, t-SNE plot of cells expressing NE genes to identify CTCs. d, t-SNE plots of all CTCs by time point (at diagnosis [green], and at relapse [brown]; left) and t-SNE visualization of CTC cell clusters from all time points (n=712 cells). e, Contribution of cells from the diagnosis or relapsed time points within each of the CTC clusters. f, CTCs and CDX cells from the relapsed time point have a higher ITH score by Kruskal–Wallis test than CTCs collected at diagnosis (diagnosis CTCs vs. relapsed CTCs and diagnosis CTCs vs. relapsed CDX, P=3.0e-17; diagnosis CTCs: n=84 cells). Center lines show the medians; box limits indicate the 25th and 75th percentiles; whiskers extend 1.5 times the interquartile range from the 25th and 75th percentiles. g, Violin plots of CHGA and ASCL1 expression in the relapsed CTCs and CDX cells. h, Violin plots depicting decreased expression of MYCL and NFIB in the CDX cells compared to CTCs at relapse by two-sided Wilcoxon rank-sum test (P<2.2e-16 for both). Each dot represents one cell and the violin curve represent the density of the cells at different expression levels. i, Expression patterns of therapeutic targets in clusters from the CTCs and CDX following relapse. CTCs were normalized separately from CDX cells. In b and c, n=2,719 cells. In f, g and h relapsed CTCs: n=627 cells, relapsed CDX: n=2,000 cells.
Following single-cell RNAseq profiling, t-SNE analysis classified the major cell types present in the samples. Based on gene expression, we determined that six clusters were comprised of non-CTCs (e.g., white or red blood cells), while two were composed of CTCs (Figure 4b). To verify the identification of CTCs compared to non-CTCs, expression of established SCLC neuroendocrine markers were evaluated including UCHL1, NCAM1, SYP, and CHGA (Figure 4c). We further evaluated the percentage of cells expressing mesenchymal and epithelial genes (as defined in the EMT signature) and those associated with expression of the major SCLC transcription factors ASCL1, NEUROD1, and POU2F3 (Extended Data Figure 5) and found the highest percentage of cells expressing epithelial, neuroendocrine, and lineage-specific genes in the CTC clusters. Marker genes were pooled, due to small numbers of CTCs sequenced and fewer genes detected per cell compared to CDXs.
Among the CTC populations, t-SNE analysis identified five unique CTC clusters (Figure 4d), while the CDX cells comprise eight clusters (Figure 2b). The majority of treatment naïve CTCs (62%) were present in cluster 1 with the remaining clusters composed of mostly relapsed CTCs (Figure 4e). The ITH score of relapsed CTC and CDX cells were higher than cells at diagnosis (P=3.0e-17, Figure 4f). CTCs and CDX cells derived from the same liquid biopsy were similar with respect to SCLC molecular subtypes. Both CTC and CDX cells express similar levels of CHGA, ASCL1 (Figure 4g); however, MYCL and NFIB were both expressed at lower levels in the CDX (Figure 4h). This suggests that these genes were expressed by metastatic cells in the circulation but not required in the primary tumor, which supports the role of Mycl and Nfib in SCLC dissemination in GEM models59,68,69. Variations in expression of therapeutic targets were detectable in relapsed CTCs and CDXs derived from the same patient, including MYC, BCL2, KDM1A, TOP1, TOP2A, and VEGFA (Figure 4i). Few of the therapeutic target genes are expressed by the CTCs at diagnosis. Overall, the transcriptional diversity between cellular subpopulations in relapsed CTCs and CDXs highlights the complexity of treatment-resistance within SCLC patients.
Single-cell Analysis of CDXs Developing Treatment-Resistance
To determine whether relapsed SCLC features observed in CDXs derived from different patients, such as increasing ITH score and transcriptional diversity between clusters, could be recapitulated by treating a platinum-sensitive CDX model with cisplatin chemotherapy in vivo, a treatment-naïve platinum-sensitive CDX (MDA-SC68s) was treated with vehicle or cisplatin until relapse (Figure 5a) and single-cell profiling was performed. Following the onset of treatment-resistance in the cisplatin-treated tumor, transcriptional differences were observed between the vehicle and cisplatin-treated MDA-SC68 cells based on tSNE clustering (Figure 5b,c). Cells from the vehicle-treated MDA-68 cells cluster separately from the cisplatin-relapsed cells, with greater ITH in the cisplatin-treated tumor as compared to the vehicle-treated tumor. The number of clusters increased from three in the vehicle-treated (Figure 2b) to five in the cisplatin-treated tumor (Figure 5d). ITH score was also significantly higher in the cisplatin-treated tumors (P<2.2e-16; Figure 5e). To determine whether transcriptional diversity in either therapeutic targets or EMT genes was detectable between the paired tumors after onset of cisplatin-resistance, we compared expression between vehicle and cisplatin-treated clusters (Figure 5f). Unbiased principal component analysis revealed that the first component was associated with EMT score specifically in the cisplatin-treated tumor (Figure 5g, left) and that cells with elevated EMT score were located within cluster 3 (Figure 5g, right). Accordingly, VIM was upregulated and EPCAM was downregulated within this population (Extended Data Figure 6a,b). Interestingly, onset of platinum resistance was associated with a decrease in ASCL1-expressing cells (P<0.0001), with no change in NEUROD1 expression (Figure 5h). DLL3 expression was decreased specifically within the EMT cluster (Figure 5h,i). This suggests that in MDA-SC68s the relatively platinum-sensitive ASCL1-positive cells are being replaced by mesenchymal cells following platinum treatment. These findings are consistent with a recent study observing decreased ASCL1 protein expression in a cohort of chemotherapy-relapsed SCLC patient tumors64.
Figure 5.
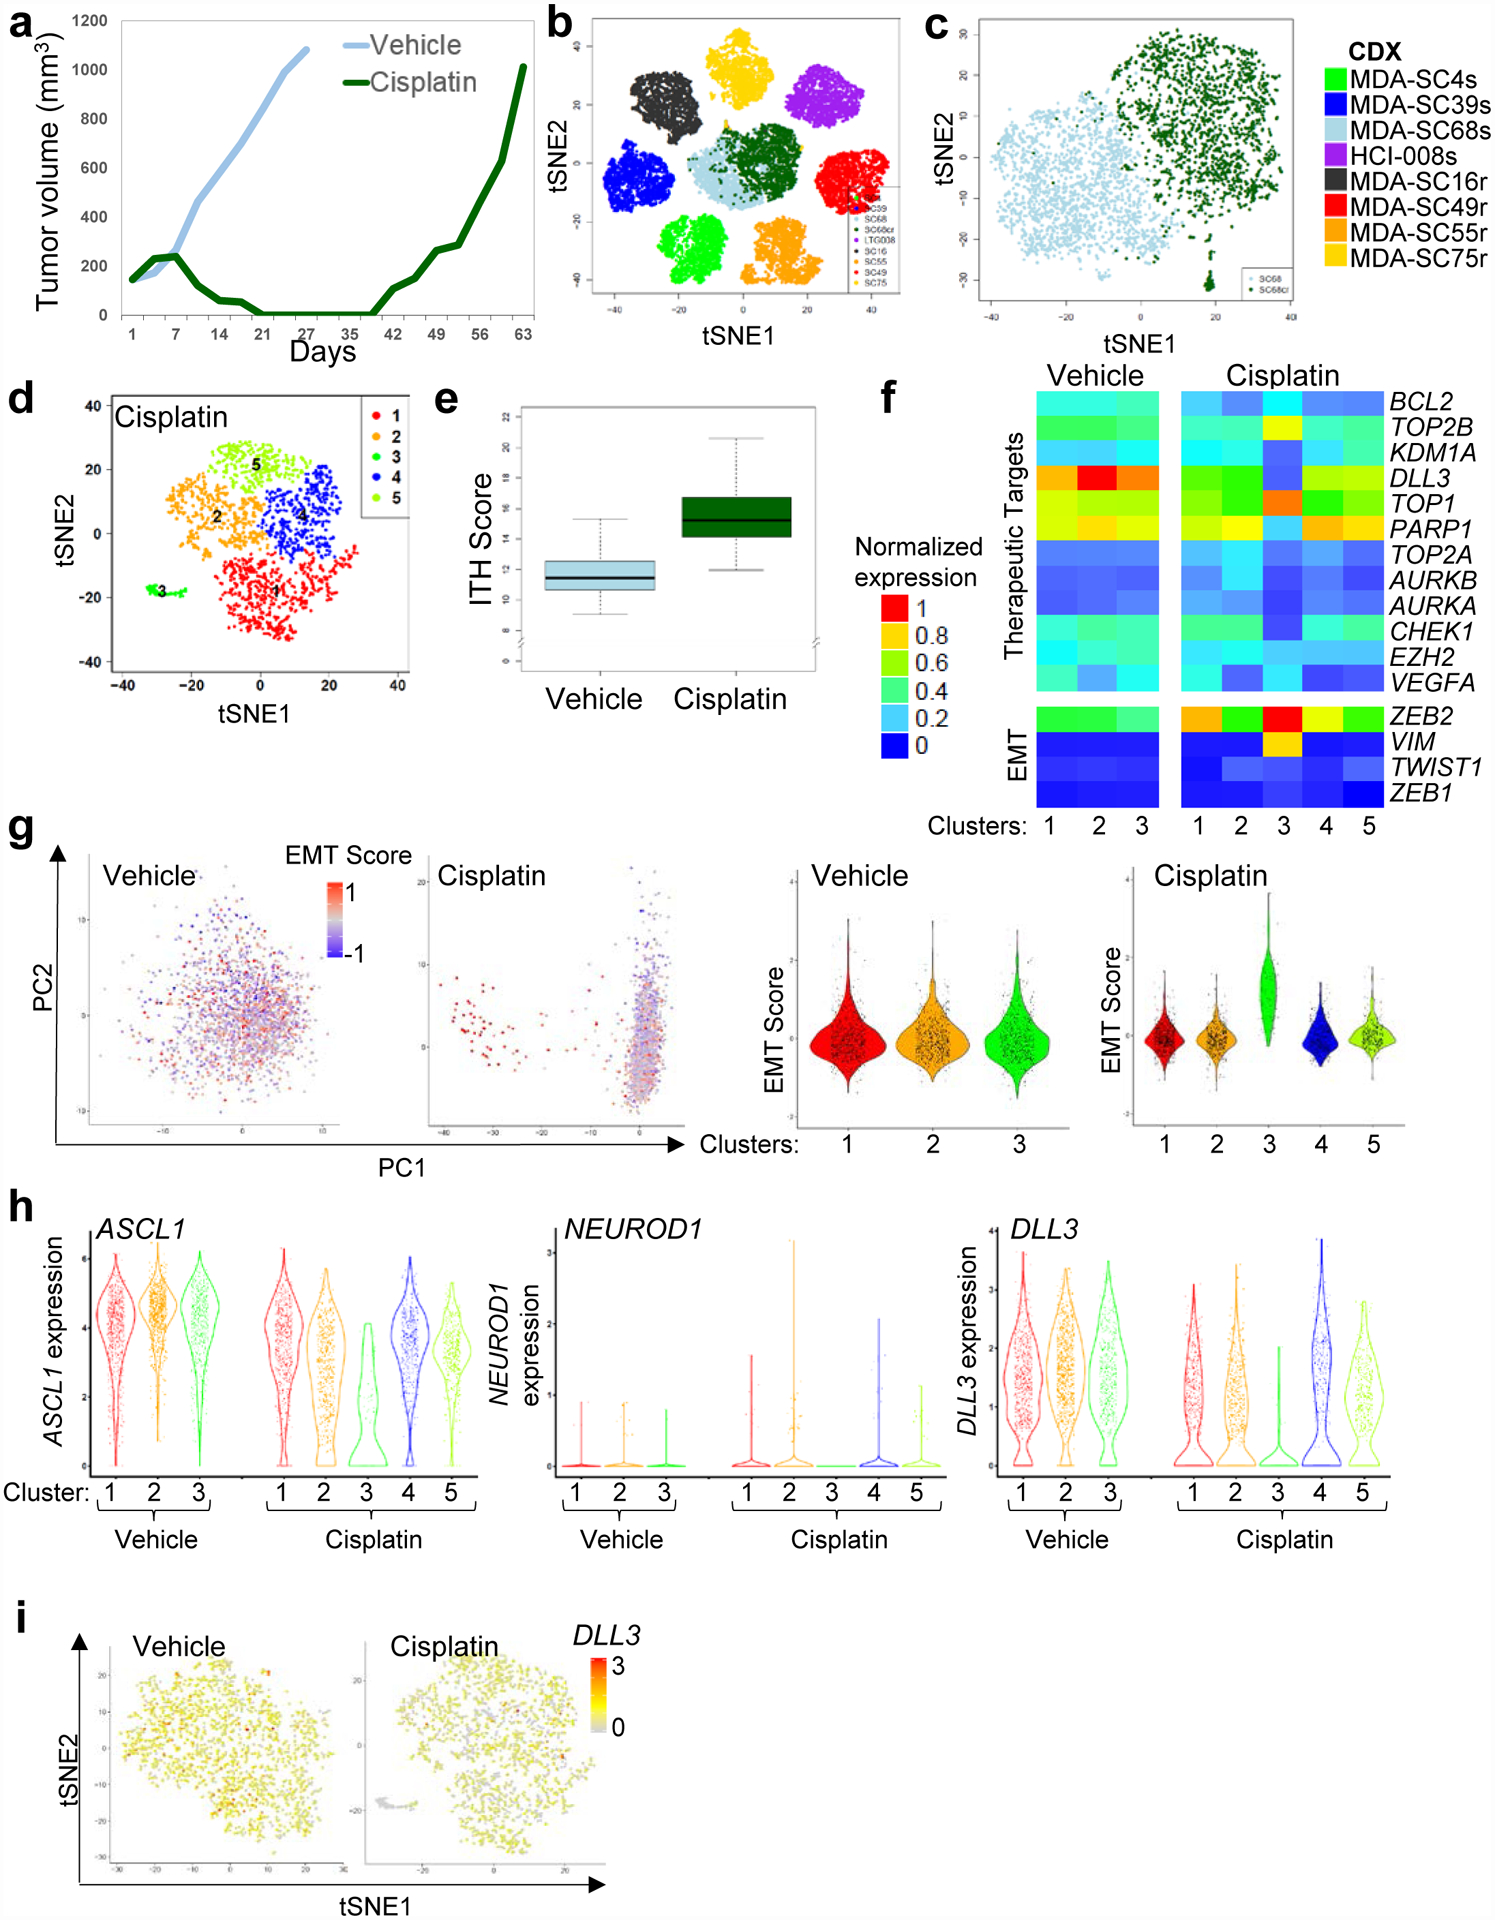
Increased ITH and emergence of cell populations with EMT signatures occur following cisplatin relapse. a, Tumor growth for MDA-SC68s vehicle or cisplatin-treated mice (n=1 per treatment). Tumors were collected when tumor volume reached approximately 1,000 mm2. b, Pooled t-SNE plot of the MDA-SC68s vehicle and cisplatin-treated tumors in combination with the seven other CDXs. c, t-SNE visualization of the MDA-SC68s vehicle and cisplatin-treated CDXs. d, t-SNE plot of cell clusters in cisplatin-relapsed MDA-SC68s cells. e, Cisplatin-treated cells have an increased ITH score compared to vehicle cells by two-sided Wilcoxon rank sum test (P<2.2e-16). Center lines show the medians; box limits indicate the 25th and 75th percentiles; whiskers extend 1.5 times the interquartile range from the 25th and 75th percentiles. f, Expression of specific therapeutic targets and EMT-related genes the clusters from vehicle or cisplatin-relapsed MDA-SC68s cells. g, Left panel: principal component analysis of MDA-SC68s cisplatin-treated cells identified the first component to be associated with EMT score in MDA-SC68s cisplatin-treated cells, but not in vehicle-treated cells. Violin plot of the EMT score of individual cells within each cluster indicate that cells with the highest EMT score were located in cluster 3 of the MDA-SC68s cisplatin-treated tumor. MDA-SC68 vehicle: n=733, 704, 563 cells for clusters 1–3; MDA-SC68 cisplatin: n=635, 489, 71, 467, 338 cells for clusters 1–5. h, Right panel: Violin plots of ASCL1, NEUROD1, and DLL3 expressions within the clusters from MDA-SC68s vehicle and cisplatin-treated tumors. ASCL1 and DLL3 were expressed at lower levels in the cisplatin-treated sample (P<0.0001 for each). MDA-SC68 vehicle: n=733, 704, 563 cells for clusters 1–3; MDA-SC68 cisplatin: n=635, 489, 71, 467, 338 cells for clusters 1–5. Each dot represents one cell and the violin curve represent the density of the cells at different expression levels. i, t-SNE visualization of DLL3 expression in vehicle and cisplatin-treated cells. In b, c, d, e, and i, n=2,000 cells each.
To determine whether the emergence of new clusters also occurs with targeted therapies, another platinum-sensitive CDX (MDA-SC4s) was treated with a PARP inhibitor (PARPi, talazoparib) or CHK1 inhibitor (CHKi, prexasertib) until relapse developed and single-cell profiling was performed. The CDX selected was initially sensitive to both DDR inhibitors (Figure 6a). Pooled tSNE analysis of vehicle, PARPi- and CHKi-relapsed samples (n=2–3 individuals each) identified three clusters (Figure 6b). The majority of untreated cells (>99%), as well as subsets of PARPi-relapsed cells (20%) and CHKi-relapsed cells (32%) lie in Cluster 1. In contrast, the two additional clusters were treatment-specific, containing almost exclusively either cells from the PARPi-relapsed tumors (98% of cells in Cluster 3) or from CHKi-relapsed tumors (97% of Cluster 2) (Figure 6b,c), suggesting that unique resistance mechanisms occur in response to specific therapies. A greater ITH score was calculated in the PARPi or CHKi relapsed samples compared to untreated ones (P=7.5e-132 and P=4.4e-65, respectively. Figure 6d). Thus, while PARP1 and CHK1 are both targets of interest in SCLC and lead to DNA damage, the emergent transcriptional profiles during resistance to the inhibitors are distinct.
Figure 6.
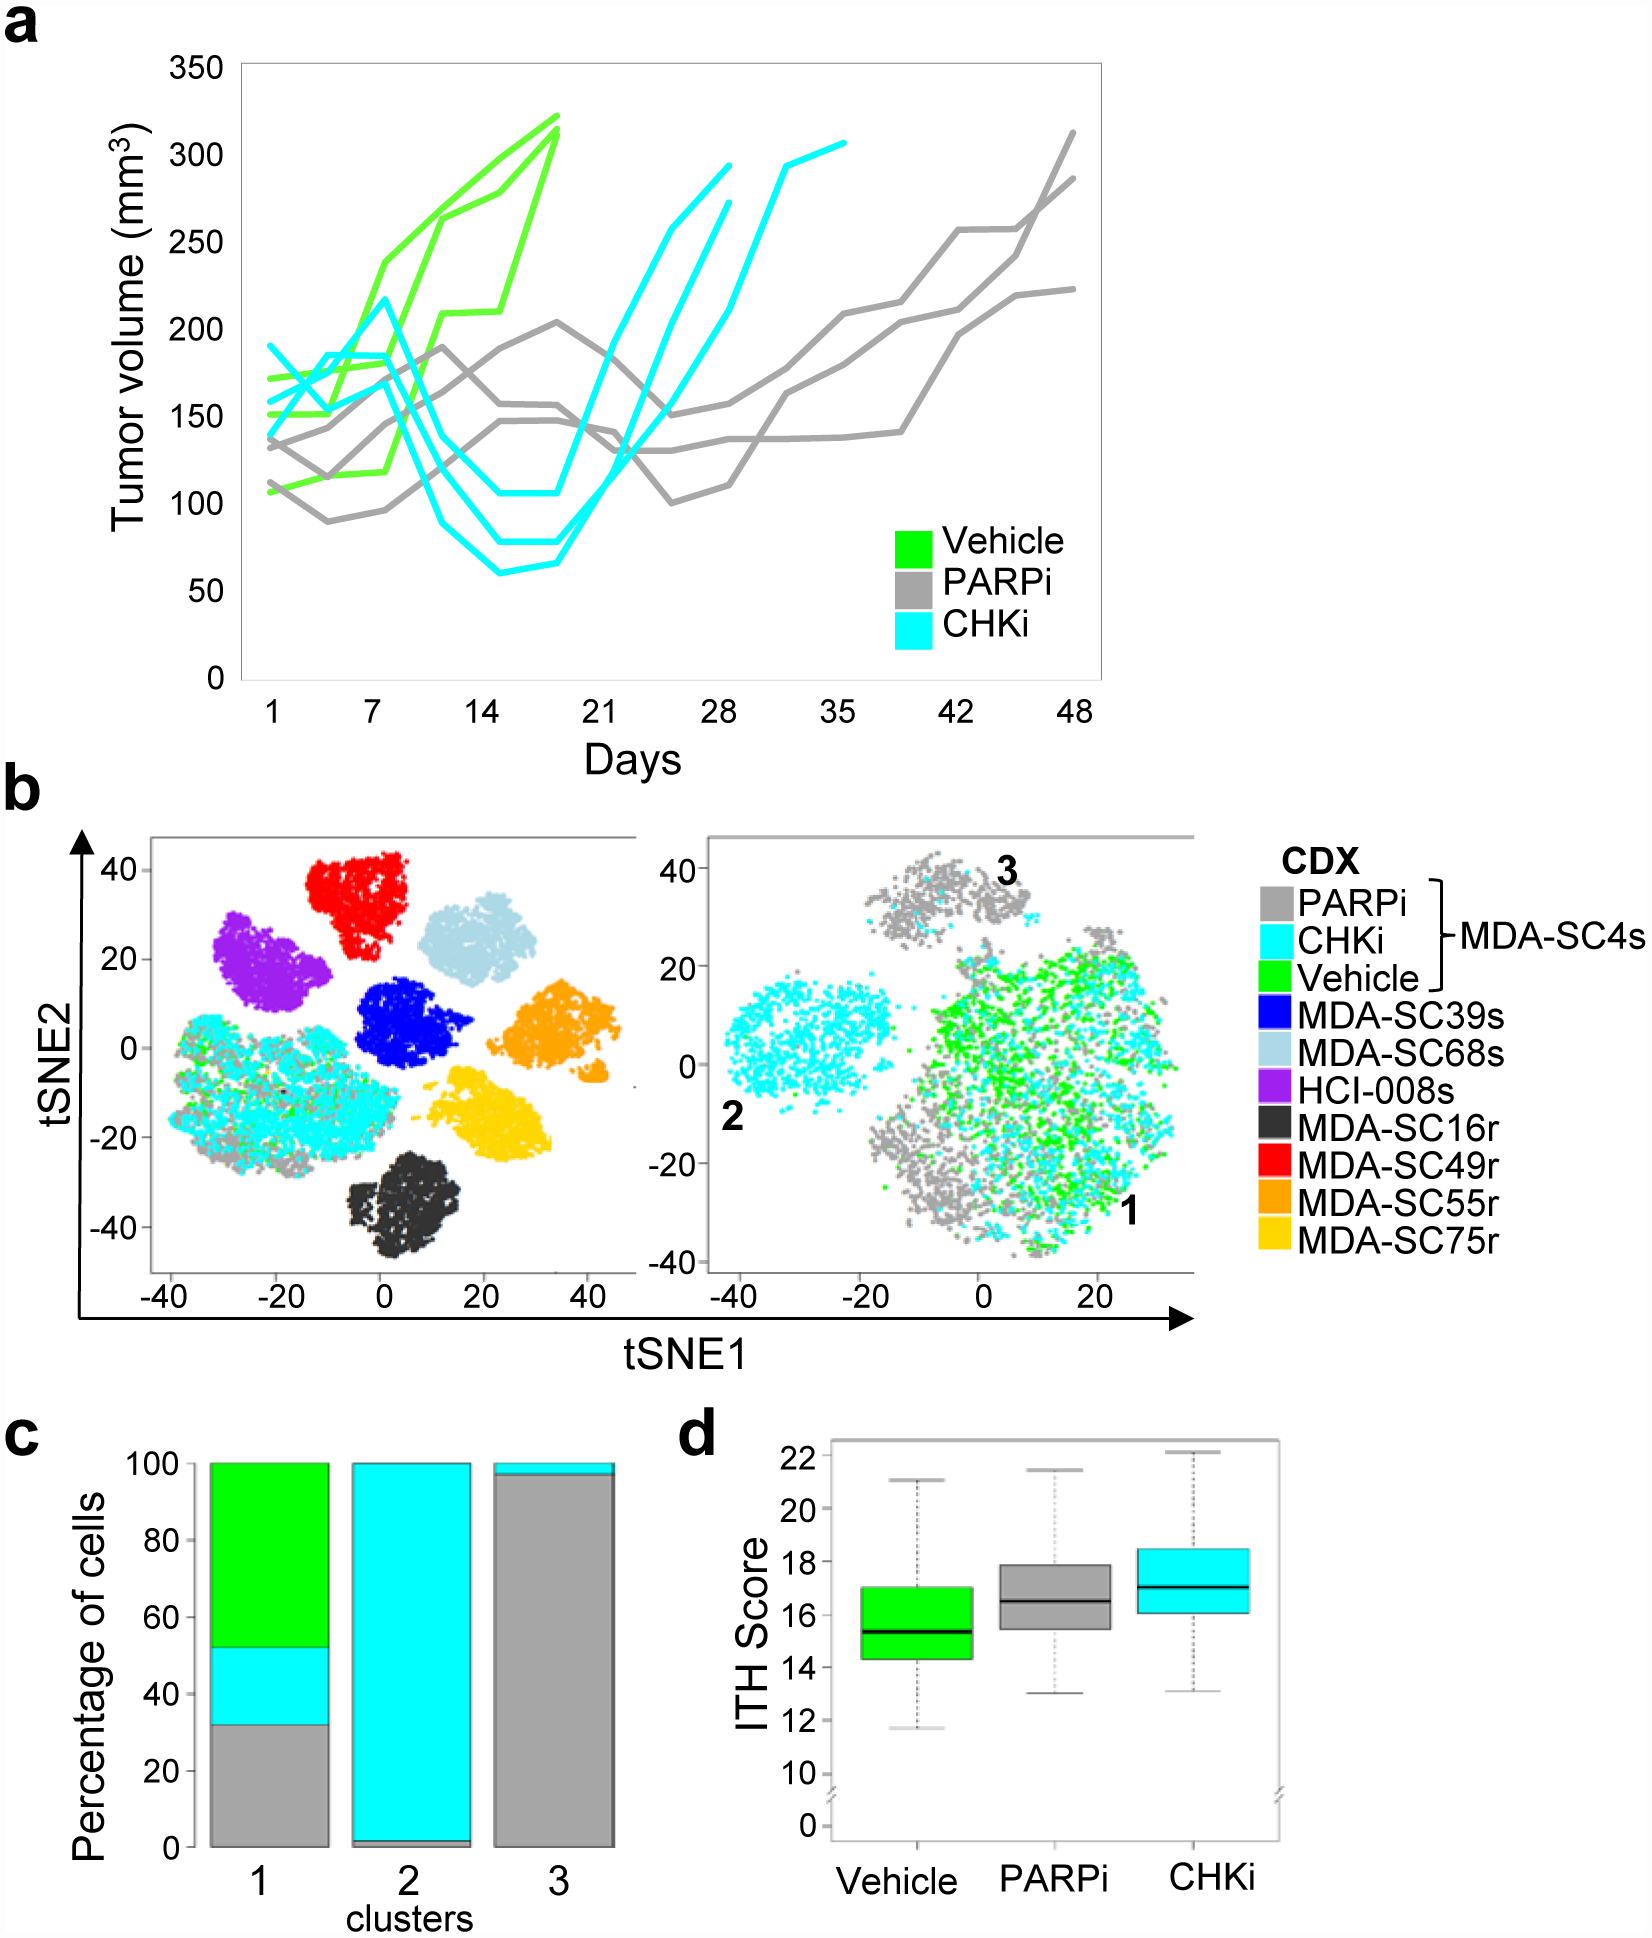
Treatment-resistance to DNA damaging targeted therapies resulted in the emergence of new, therapy-specific clusters. a, Tumor growth for MDA-SC4s vehicle, PARPi-treated (talazoparib), and CHKi-treated (prexasertib) mice (n=3 mice per treatment). Tumors were collected when tumor volume doubled from onset of treatment. b, Pooled t-SNE plot of the MDA-SC4 vehicle, PARPi-relapsed and CHKi-relapsed cells in combination with all seven other CDXs (MDA-SC39s, MDA-SC68s, HCI-008s, MDA-SC16r, MDA-SC49r, MDA-SC55r and MDA-SC75r; n=2,000 cells each). Emergence of unique clusters were detected following relapse to PARPi or CHKi. t-SNE visualization of cell populations from MDA-SC4 vehicle, PARPi- and CHKi-relapsed tumors form three clusters. c, Percentage of cells from MDA-SC4 vehicle, PARPi-relapsed and CHKi-relapsed samples within the clusters. d, ITH score was higher in CHKi-relapsed (P=4.4e-65) or PARPi-relapsed (P=7.5e-132) samples compared to vehicle samples by two-sided Wilcoxon rank sum test (n=2,000 cells each). Center lines show the medians; box limits indicate the 25th and 75th percentiles; whiskers extend 1.5 times the interquartile range from the 25th and 75th percentiles.
DISCUSSION
SCLC liquid biopsies are a non-invasive collection method that facilitates both serial and post-relapse tissue sampling, and contain sufficient CTCs for generation of CDXs, as well as for direct single-cell profiling. CDX models mirror patient disease by expression of SCLC markers, sites of metastatic disease, and platinum response. Interestingly, one CDX developed spontaneous leptomeningeal disease from a primary flank tumor, which highlights the utility of these models for metastatic studies. These data support use of CDXs and/or CTCs for single-cell analyses to explore the role of increased ITH in SCLC treatment-resistance.
CDX single-cell transcriptional profiling revealed expression of SCLC neuroendocrine markers in a pattern that is consistent with patient and CDX IHC. The range in expression of SCLC-associated genes (e.g., MYC, MYCL) and transcriptional programs (e.g. EMT) among both platinum-sensitive and -resistant models illustrates the complexity of SCLCs. This evolving transcriptional complexity may exert profound influence upon therapeutic responses. Consider, for example, the heterogeneity in expression of DLL3, which is an inhibitory NOTCH ligand that is directly regulated by ASCL1 and highly expressed in SCLC. Several therapeutics targeting DLL3 are in clinical investigation for SCLC, including rovalpituzumab tesirine (antibody-drug conjugate)74, a chimeric antigen receptor (CAR) T cell therapy, and a bispecific T cell engager (BiTE®) program (AMGEN, Inc., California)75. However, we find that DLL3 expression is variable, with DLL3 positive and negative cells co-existing in many model. This heterogeneity may contribute to resistance and the lower than expected response rates noted in some prior studies, despite selection for DLL3-high patients74,76. We also observe that DLL3 expression is dynamic and may disappear with treatment. This observation not only provides a potential mechanism of adaptive resistance to these agents, but highlights how timing of targeted therapy administration may impact response. We observed similar dynamic heterogeneity in the expression of numerous other SCLC candidate targets, including AURKA/AURKB and PARP1. This implies that expression levels of biomarkers or therapeutic targets may be of less importance to patient response than uniformity in expression between cellular populations, which is a significantly more complex attribute to measure.
The implications of transcriptional heterogeneity for therapeutic response in SCLC, however, extend beyond variable expression of single target-encoding genes. Estimates of global transcriptional diversity within cell subsets on a gene-by-gene basis can be calculated as ITH score, which revealed higher ITH in the platinum-resistant compared to sensitive CDXs. This increased variability is transcriptional, as the genomic alterations remain static over time. The increased ITH associated with drug resistance was further confirmed in vivo by analyses of CDXs over the course of cisplatin or DDR inhibitor therapy, as well as directly in CTCs from blood samples collected over a patient’s treatment course. The elevated ITH in platinum-resistant SCLC leads to concurrent, but potentially druggable, resistance mechanisms that interfere with effective treatment and suggests that maximally targeting treatment-naïve patients with relatively homogeneous tumors using frontline combination therapy may maximize response.
Within all samples evaluated to date (n = 14), there is a great range of expression of virtually every gene, but this range of gene expression is not what defines ITH. ITH, as we define it, is represented by the diversity of each cell’s gene expression pattern (ITH score), and broadly illustrated by the number of cell populations (clusters) with distinct or diverse gene expression patterns. Within a single sample, up to nine unique cell populations were identified, each with their own characteristic transcriptional programs, often including putative resistance mechanisms. These transcriptional programs, including those that may drive resistance, are not uniformly distributed throughout a tumor following relapse, but, instead, co-exist with other programs. In other words, a heterogeneous, relapsed tumor with multiple transcriptionally-defined clusters may possess an equal number of transcriptional mediators of resistance.
Single-cell profiling of CTCs collected longitudinally allows monitoring of the transcriptional fluidity to gain a better understanding of the onset of treatment-resistance. In liquid biopsies, the lowest numbers of CTCs were found during maximal treatment response and the highest number following relapse. Expression of SCLC molecular subtyping genes were similar between CTCs and a CDX derived from the same liquid biopsy. However, genes associated with tumor propagation and metastases (NFIB, MYCL) were expressed at lower levels in a CDXs compared to CTCs directly sequenced from the same patient. The cells were all derived from the same patient at the same time and represent a similar malignancy based on the subtyping, but also may demonstrate evidence of divergence (metastatic CTCs vs. primary tumor CDX). We similarly found subtle differences in protein expression between xenografts generated from pleural fluid and CTCs collected from the same patient at the same time. Future studies will investigate paired specimens derived from a single SCLC patient (biopsies [primary vs. metastatic sites], CTCs, PDX, CDX, etc.) at the single-cell level to further characterize longitudinal transcriptional changes. Overall, transcriptional heterogeneity of CTC and CDX cell clusters are comparable, but not identical. This further highlights that serial sampling may be important to capture dynamic changes in expression of therapeutic targets over a patient’s treatment course.
One limitation of the current study was the scarcity of archival tissue samples from SCLC patients to permit comparisons of ITH between patient tumor biopsies, CDXs, and CTCs. In the future, as SCLC xenograft libraries and banking of patient samples expands, it will be possible to explore how intratumoral heterogeneity is influenced by specific SCLC transcriptional subtypes (e.g. ASCL1, NEUROD1, and POU2F3). Furthermore, longitudinal samples from single patients pre- and post-treatment may resolve whether there is evidence of transcriptional subtype switching or selection that underlies shifts in treatment sensitivity. Additional efforts could compare single cell data from multiple sites of disease in the same patient to investigate whether distant metastatic sites recapitulate the ITH of the primary tumor site or reflect only a fraction of the primary tumor.
While SCLC begins as a relatively homogeneous disease with exquisite sensitivity to chemotherapy, it quickly relapses as a virtually pan-resistant entity. These analyses offer improved resolution of the natural history of SCLC as it endures treatment and confirm that, in its untreated state, the majority of SCLC cells are transcriptionally similar. However, even in this untreated state, individual cells already hint at the potential to pivot transcriptionally to more chemoresistant states, as tumors conceal small populations of cells with evidence of chemoresistant lineages. In post-treatment models, SCLC quickly diversifies in a manner that requires single-cell resolution to appreciate fully. Not only are consensus markers of chemosensitivity rapidly downregulated, but multiple subsets of transcriptionally unique SCLC cells emerge within a single tumor including the upregulation of diverse, concurrent mechanisms of resistance. This conclusion highlights the potential benefit of diversifying combination treatment strategies to maximize frontline responses prior to the emergence of heterogeneity that renders the disease essentially untargetable. Supporting this notion, the recently reported IMpower133 and CASPIAN clinical trials found improved outcomes77, in spite of similar response rates, with the addition of the immune checkpoint inhibitors to frontline chemotherapy in SCLC78. Our data suggest the window of therapeutic vulnerability in SCLC is short and, thus approaches featuring aggressive deployment of diverse strategies in the frontline and maintenance settings may be critical to conquering this devastating disease.
Methods
CDX and PDX Model Generation
Patients diagnosed with SCLC at the University of Texas M.D. Anderson Cancer Center were selected on the basis of extensive-stage disease irrespective of age, gender or other clinical criteria. All patients had confirmed pathologic diagnosis of SCLC and classified (though not selected for) prior treatment. Ages for included patients ranged from 49–90 and included six females and two males. These patients underwent informed consent to Institutional Review Board (IRB)-approved protocol LAB10–0442 (“Evaluation of blood-based test for the detection of circulating tumor cells and circulating proteins and microRNAs and molecular analysis for polymorphisms and mutations”) and blood was collected. One vial of blood was collected for isolation and banking of plasma and peripheral blood mononuclear cells for use as a normal control. Ten milliliters of blood collected in EDTA vials was used for isolation of CTCs according to a previously published protocol42. CTCs were isolated within 24h of sample collection. Briefly, whole blood was incubated with RosetteSep™ CTC Enrichment Cocktail Containing Anti-CD36 (Stemcell Technologies) and layered over a Ficoll gradient. The CTC layer was isolated, cells were spun down, mixed 1:1 with Matrigel and injected subcutaneously into the flank of NOD.Cg-Prkdcscid Il2rgtm1Wjl/SzJ (NSG) mice. Mice were monitored for formation of a flank tumor and were euthanized when tumor burden reached 1000–1500 mm3. Pieces of the tumor were fixed in paraformaldehyde for histological analyses, snap frozen in liquid nitrogen for genetic and proteomic analyses, viably frozen in 10% DMSO in FBS for future use, and transplanted into the flank of athymic nude mice for CDX model maintenance. CDX models were maintained in vivo by serial transplantation of tumors and all analyses performed to date were from passages ≤4. CDXs were derived from extensive-stage (ES) patients at different points of their treatment course. The CDX from Huntsman Cancer Institute (HCI-008) was derived as published44.
Mice
Mice used for establishment of CDX models were 6 week old female NSG mice from Jackson Labs, while maintenance of CDX models and drug treatment studies were performed using 6 week old female athymic nude mice from Envigo. All animals were maintained in accordance with the Institutional Animal Care and Use Committee of the M.D. Anderson Cancer Center and the NIH Guide for the Care and Use of Laboratory Animals.
Metastatic disease in CDXs
SCLC is an aggressive disease with 80% of ES patients ultimately developing central nervous system metastases79. Mice with primary MDA-SC39 flank tumors developed hemiparesis and brains were examined for evidence of metastatic disease. Leptomeningeal disease (LMD), a devastating complication of advanced cancer, was detected and confirmed histologically as SCLC (Figure 1b). This is one of the first examples of spontaneous LMD in a xenograft model, suggesting that SCLC CDXs maintain their metastatic potential.
CDX Drug Response
Treatment of the mice began when the tumors reached 120–150 mm3. Tumor volume and body weights were measured on all mice two times per week and calculated (width2 × length × 0.4). Vehicle was administered intraperitoneally once per week and cisplatin (4–6 mg/kg) was administered intraperitoneally once per week. Patients were classified as platinum-sensitive or platinum–resistant based on clinical criteria and CDX response to cisplatin was assessed in vivo. As expected, platinum responses in the CDXs were consistent with the patient’s treatment history (Figure 1c)42,43. One of the models demonstrating complete response (MDA-SC68) was expanded and treated with cisplatin as described above. Once tumors reached 150mm3, mice were treated with vehicle or cisplatin until tumor volume reached 1,000mm3 (Figure 5a). Tumors were harvested and processed for single-cell RNAseq.
MDA-SC4s was determined to be sensitive to cisplatin, talazoparib and prexasertib, so was selected for treatment with DDR inhibitors until relapse. Vehicle was administered by oral gavage on weekdays, talazoparib (0.3 mg/kg) was administered by oral gavage on weekdays; prexasertib (LY2606368; 10 mg/kg BID) was administered subcutaneously three consecutive days per week (weekly dose = 60 mg/kg) beginning when tumor volume reached 150 mm3. Once vehicle-treated tumors doubled in size, mice were sacrificed and tumors were harvested. Talazoparib- and prexasertib-treated tumors were observed for response to therapy followed by relapse and tumors were collected upon reaching 300mm3 for single-cell RNAseq analyses (Figure 6a).
Single-cell RNA-sequencing
Model MDA-SC68s was vehicle-treated to pair with a cisplatin-relapsed model, but all others were untreated. A separate experiment was performed for the MDA-SC4s sample, so it was untreated. Tumors from the CDXs for single-cell RNAseq analyses were collected at the following passage (P) numbers: MDA-SC4s (P3), MDA-SC16r (P3), MDA-SC39s (P2), MDA-SC49r (P2), MDA-SC55r (P1), MDA-SC68s (P2), MDA-SC75r (P1), HCI-008 (P3). Replicate samples were collected from CDX models in the same passage, but grown in different mice. Tumors were harvested from mice directly into cold tissue storage solution (MACS) and shipped overnight. Blood was collected from patients into Streck tubes and shipped overnight on ice. The next day, tumors were processed by enzymatic dissociation with Collagenase IV (600U/mL) and DNAse (2ug/mL) for a maximum of 45min and neutralized in collection buffer (1% BSA, 10%FBS, 2mM EDTA in RPMI). Circulating tumor cells were isolated from blood samples on a Ficoll gradient.
Dissociated cells were spun down and treated with ACK lysis buffer (A1049201, GIBCO) for 3 min on ice and washed with collection buffer. Cells were then stained with anti-human HLA-ABC (Biolegend 311414), Calcein AM (C3100MP) and DAPI (Lifetech D1306, 1ug/mL) and sorted by Fluoresence-Activated Cell sorting (FACS) to select only live, human cells for downstream single cell transcriptomic analyses.
Sorted cells were washed once with 0.04% BSA in PBS and counted on Countess II automated cell counter (ThermoFisher). 12,200 cells were loaded per lane on the 10x Chromium platform and processed for cDNA synthesis and library preparation as per manufacturer’s protocol using version 2 chemistry. cDNA and libraries were checked for quality on Agilent 4200 Tapestation and quantified by KAPA qPCR before sequencing on a single lane of a HiSeq4000 (Illumina).
Single-cell RNAseq Analysis
Cell Ranger v2.0 was used to convert Illumina base call files to FASTQ files. These FASTQ files were aligned to the hg19 human reference genome and transcriptome provided by 10X genomics. The gene vs cell count matrix from Cell Ranger was used for downstream analysis. The raw reads were processed using the Cell Ranger pipeline to obtain the UMI (unique molecular identifier). CDX samples from the same model were pooled together. Cells that have less than 3,000 expressed genes were filtered out, and genes that were expressed in less than 10% cells were also filtered out. The total number of cells in each model after filtering were MDA-SC4s (8998), MDA-SC16r (7173), MDA-SC39s (2053), MDA-SC49r (2593), MDA-SC55r (2853), MDA-SC68s (2779), MDA-SC75r (3959), HCI-008 (5233). Each CDX model was down-sampled to 2,000 for inter-model comparison. The UMI counts were transformed and normalized using the “NormalizeData” function in SEURAT package v2.3.180, with normalization method set to “logNormalize” and the scale factor set to 10000 total UMI per cell. Cell cycle effects were adjusted by regressing out the G2M and S phase gene expression scores using “ScaleData” function in SEURAT. Principle component analysis (PCA) was performed using the highly variable genes that were identified by SEURAT function “FindVariableGenes” with default parameters. The number of highly variable genes are 543, 541, 682, 731, 639, 621, 556 and 444 for MDA-SC4s, MDA-SC39s, MDA-SC16r, MDA-SC49r, MDA-SC55r, MDA-SC68s, MDA-SC75r, and HCI-008s respectively, and 707, 564 for MDA-SC4 CHKi relapsed and MDA-SC4 PARPi relapsed respectively. For each individual model, the first seven principal components were selected based on the elbow plot of the cumulative explained variances, representing 63.7% ~ 66.4% of total variances. The t-SNE (T-distributed Stochastic Neighbor Embedding) transformation81 was performed on selected principal components, using the “RunTSNE” function with default perplexity value 30. We applied hierarchical clustering based on the Euclidean distance of the first two t-SNE components. The Silhouette scores were calculated for different numbers of clusters, ranging from 2 clusters to 10 clusters, in order to measure how similar one cell is to other cells in its own cluster compared to other clusters. The Silhouette score is calculated using the “silhouette” function in R package “cluster”. The optimal number of clusters for each CDXs was determined by maximizing the Silhouette score. This optimal cluster number was applied to the hierarchical clustering tree using the “cutree” function to obtain the cluster population information.
CTC samples from 10 ml of peripheral blood were sequenced, as described above. CTCs with less than 50 expressed genes and genes that were expressed in less than 1% cells were also filtered out. We observed significantly lower number of expressed genes and total cells in the CTC samples compared with CDX samples. This is due to CTC cells being somewhat rare and more difficult to isolate than tumor cells from an established CDX. Therefore we chose to apply a lower cutoff for CTC cells. After filtering, the treatment naïve, treatment responding and treatment relapsed samples have 637, 1108, 974 cells remaining, respectively, with number of genes expressed ranging from 50 to 2153. The UMI count were transformed and normalized using the SEURAT package v2.3.180. Cell cycle effects were adjusted by regressing out the G2M and S phase gene expression scores using “ScaleData” function in SEURAT. PCA was performed using 47 highly variable genes that were identified by SEURAT function “FindVariableGenes”. First 5 principal components were selected based on the elbow plot of cumulative explained variances and used for clustering and tSNE transformation, representing 74.4% total variance. Cell populations were identified using the SEURAT “FindClusters” function with resolution set to 0.6. We applied hierarchical clustering based on the Euclidean distance of the first two t-SNE components. We calculated the Silhouette scores for different numbers of clusters, ranging from 2 clusters to 10 clusters. The Silhouette score is calculated using the “silhouette()” function in R package “cluster”. The optimal number of clusters for each CDXs was determined by maximizing the Silhouette score. This optimal cluster number was applied to the hierarchical clustering tree using the “cutree()” function to obtain the cluster population information.
For each cluster, the marker genes were identified by comparing the cluster with the other clusters using Wilcoxon rank sum test, and the p-values were adjusted for multiple testing. The cutoff were set to adjusted p-values less than 0.01 and fold change greater than 2. The enriched pathways and hallmarks were identified by pre-ranked gene set enrichment analysis (GSEA)82 using the gene list ranked by log transformed p-values with signs set to positive/negative for fold change greater or less than 1, respectively. The ITH score was defined as the average Euclidean distance between the individual cells and all other cells, in terms of the first 20 principal components derived from the normalized expression levels of highly variable genes. The highly variable gene was identified using the “FindVariableGenes()” function in SEURAT package with default parameters.
An alternative ITH metric was also calculated using the estimated dispersion of gene expression. The dispersion measures the biological coefficients of variations in RNAseq expressions83. For each CDX model, the dispersion is computed by applying the “estimateDisp()” function in the EdgeR84 package, using the normalized expression values of all expressed genes.
True copy number analysis is not possible with single-cell RNAseq data. However, the copy number variation (CNV) estimation is similar to a method described previously53. The gene expression was sorted according to their genomic locations and a sliding window of 50 genes were applied to compute the moving average of relative expression levels. These moving averages were truncated to the range of −3 to +3 to generate the “inferred” CNV values.
Statistics and Reproducibility
The Student t-test and Wilcoxon rank sum test was used to assess the association between a binary variable (such as response group and tissue type) and a continuous variable. For gene expression differential analysis, the two-sided Wilcoxon rank sum test was performed. For multiple testing, p values were adjusted using Bonferroni correction. Bimodal expression was assessed using the Bimodality Index, an algorithm developed in house85,86. EMT score was calculated based on the EMT signature as described previously87. P values were calculated using two-sided tests or Wilcoxon rank sum test. All statistical analyses were performed using the R software program88. The correlations of expression profiles between tumors from the same CDX model were examined for reproducibility. No statistical method was used to predetermine the sample size. No data were excluded from the analyses. The experiments were not randomized. The investigators were not blinded to allocation during experiments and outcome assessment. Further information on research design is available in the Nature Research Reporting Summary linked to this article.
Data Availability
The single cell RNA-seq and Bulk RNA-seq data have been deposited into the NCBI Gene Expression Omnibus (GEO) database (https://www.nvbi.nlm.nih.gov/geo/) with accession number GSE138474. Source data for Figures 1–6 and Extended Data Figures 1–6 have been provided as individual Source Data Files. All other data supporting the findings of this study are available from the corresponding author on reasonable request.
Code Availability
The bioinformatics analyses were performed using open-source software, including BWA MEM v0.7.9a89, VARSCAN2 v2.3.990, TOPHAT2 v2.0.1391, HTSEQ v0.9.192, EdgeR v3.793, GSEA v3.082, ANNOVAR v2018Apr1694, Seuratv2.395, Cell Ranger v2.0, as well as in-house R script that is available upon request.
Extended Data
Extended Data Figure 1.
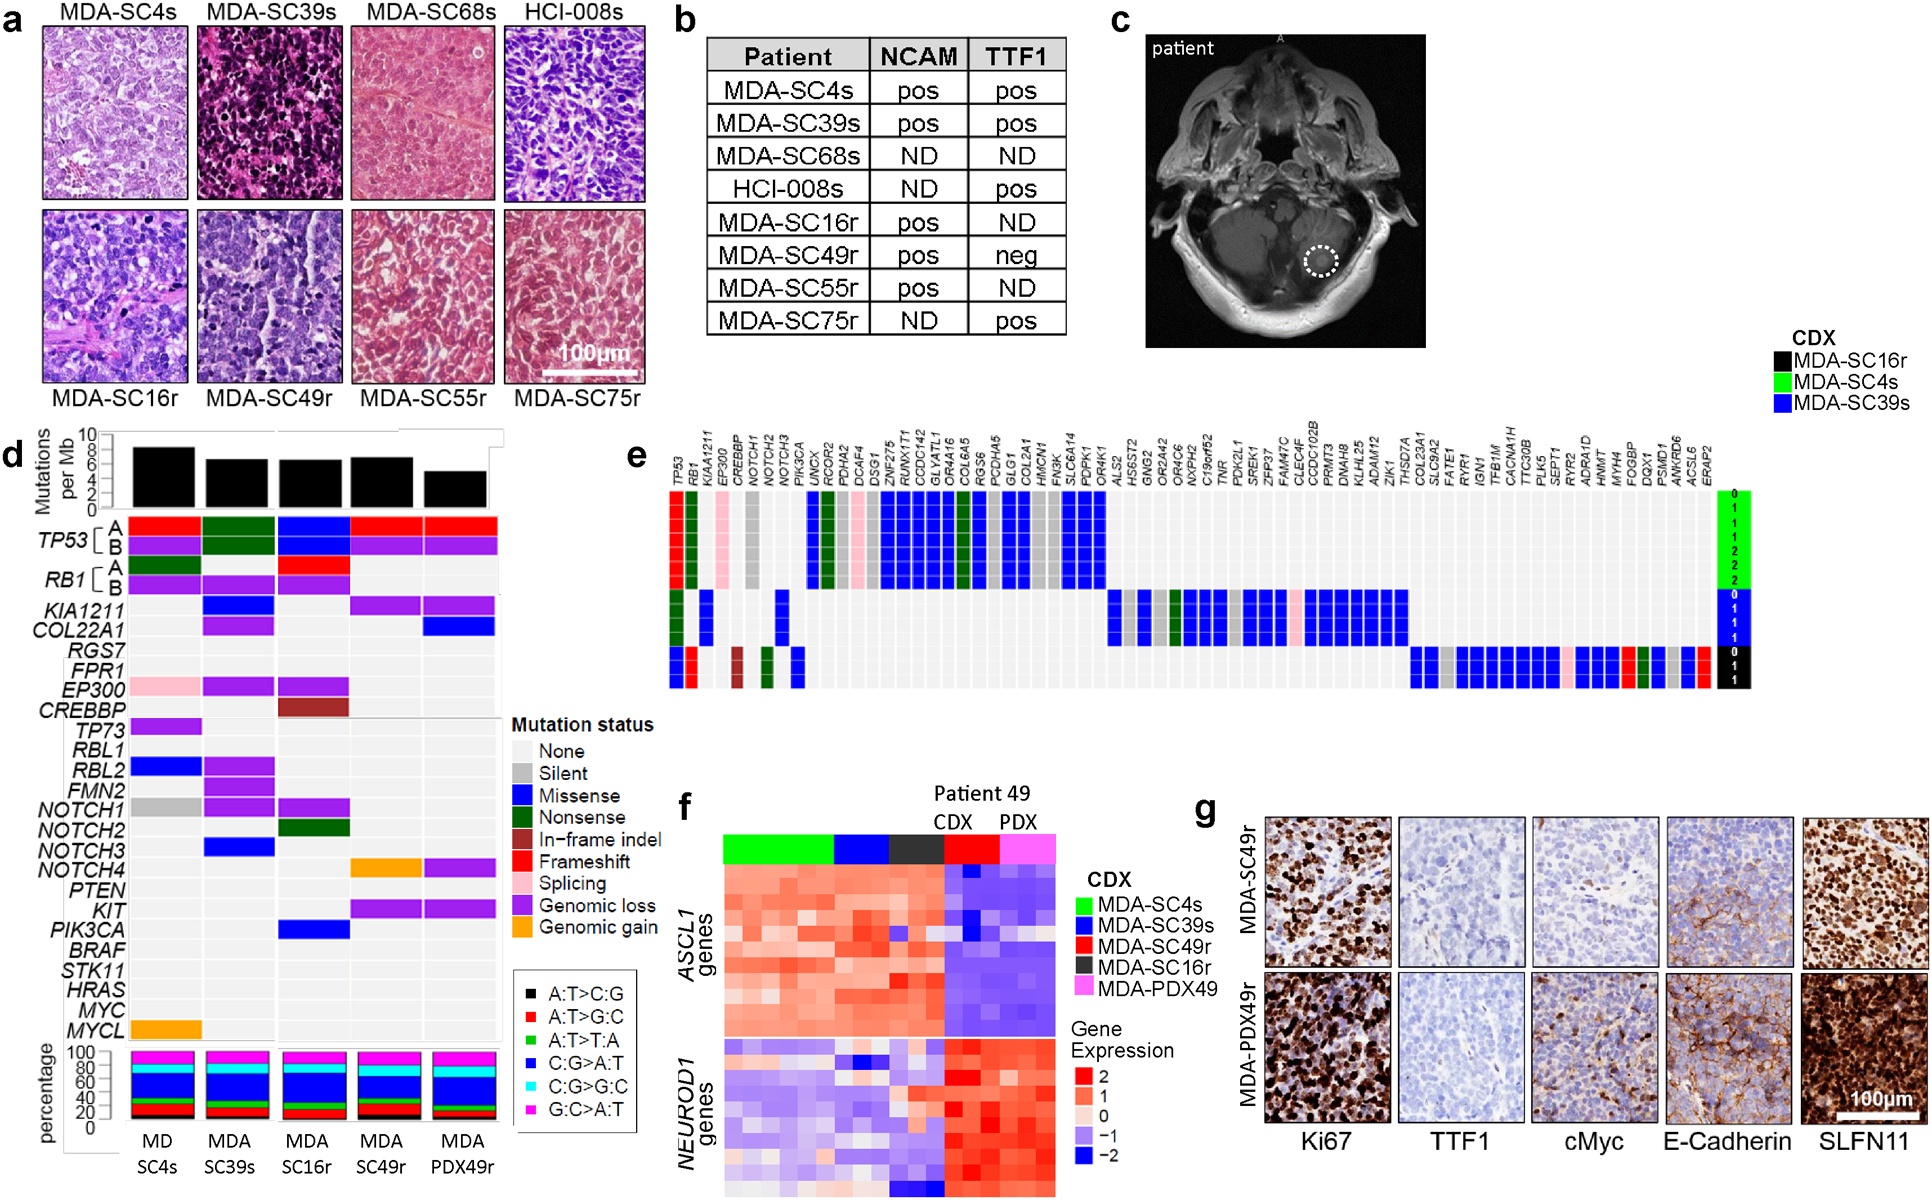
CDXs exhibit common SCLC markers and mutations that are maintained over multiple generations. a, Histological analysis of CDX tumors are consistent with SCLC. Scale bar = 100 μM. b, Expression of NCAM and TTF1 in patient biopsy by staff pathologist review of diagnostic sample matches CDXs. c, Presence of parenchymal brain metastasis, confirmed by staff neuroradiologist and treating physician review, in the cerebellum (indicated by dashed circle) of the patient from which MDA-SC39 was derived. d, Genomic alterations in CDXs. Top panel: mutation load; middle panel: somatic mutations and genomic gain/loss status; lower panel: type of base-pair substitution. e, Mutational status of common SCLC genes and others unique to each CDX are maintained over multiple CDX passages in three separate models. f, Expression heatmap for ASCL1- and NEUROD1-associated genes. g, CDX and PDX models derived from patient SC49 exhibit similar patterns of expression for common SCLC markers, including loss of TTF1 expression. These experiments were repeated in three independent tumors from each model. Scale bar = 100 μM.
Extended Data Figure 2.
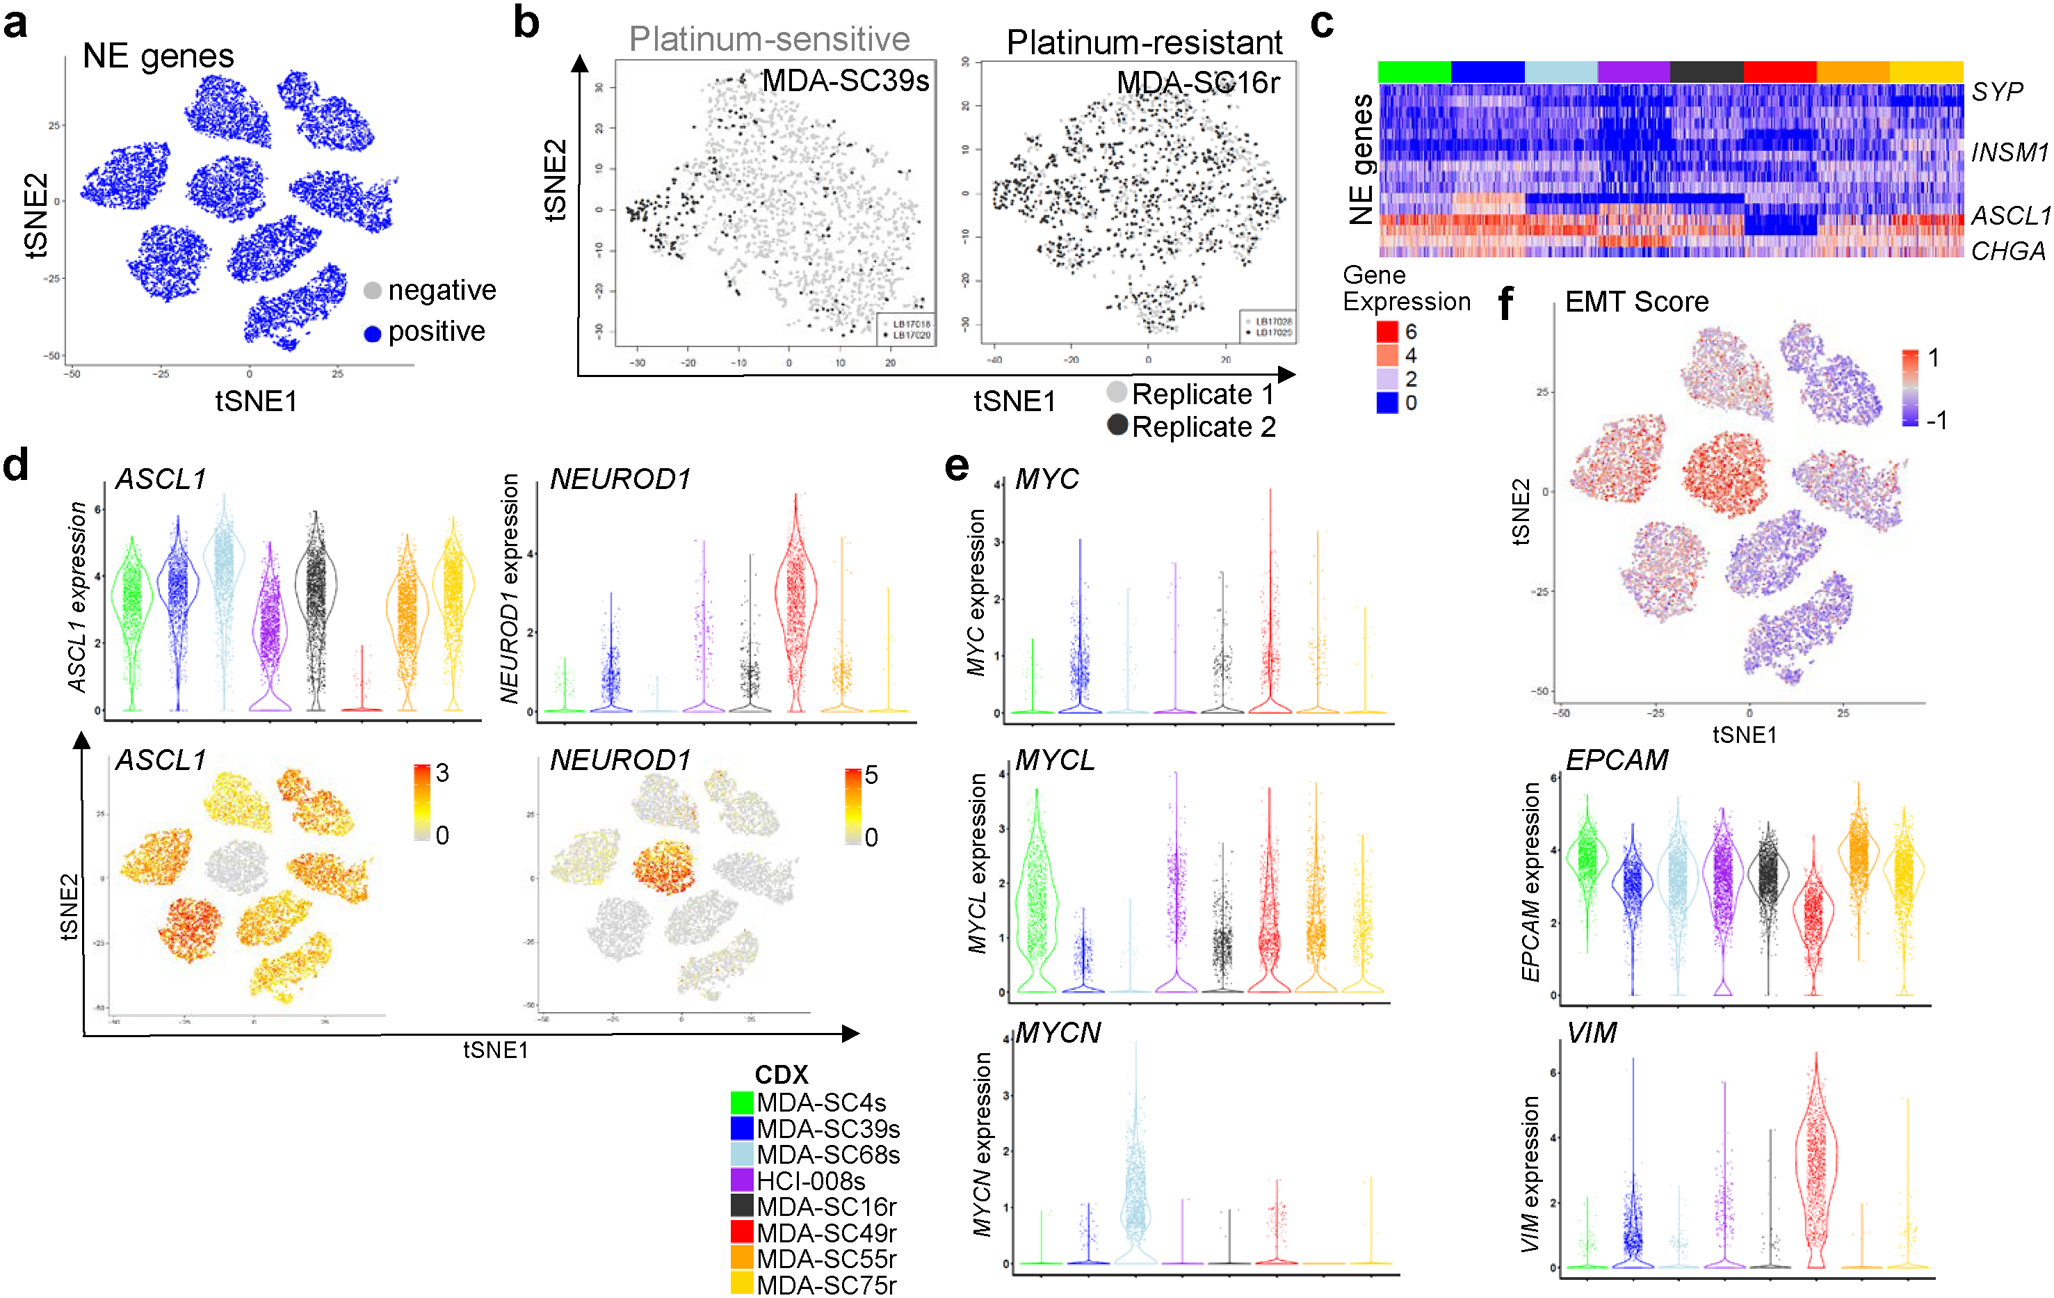
ITH among SCLC molecular subtypes. a, t-SNE visualization of NE gene expression status in all CDXs (n=2,000 cells each). b, t-SNE visualization of cell populations from biological replicates of MDA-SC39s and MDA-SC16r obtained from tumors grown in the same passage, but different mice. Note mixing of cell populations indicate that clustering is not due to variations in replicate (n=2,000 cells each). c, Heatmap analysis of NE gene expression indicating that all CDXs are considered high neuroendocrine subtypes. d, Expression of ASCL1 and NEUROD1 in all CDXs by both violin plot to indicate range in expression and feature plot to show abundance (n=2,000 cells each). e, Violin plots indicating expression of MYC family members in the CDXs (n=2,000 cells each). Each dot represents one cell and the violin curve represent the density of the cells at different expression levels. f, EMT score is elevated within MDA-SC39s and MDA-SC49r, which corresponds with increased expression of VIM and decreased EPCAM (n=2,000 cells each).
Extended Data Figure 3.
Validation of cluster calls and visualization. a, Silhouette analysis to determine cluster number in each of the eight CDXs. b, UMAP visualization of the clusters in all CDXs. c, Barplot of variations of absolute normalized enrichment scores (NES) for hallmark pathways in GSEA analysis in sensitive clusters (blue) and resistant clusters (red). The variation of pathway enrichment is higher in resistant clusters than sensitive clusters by one-sided Wilcoxon rank sum test (P-value=2.9e-6; n=21 pathways).
Extended Data Figure 4.
CDX copy number and expression of DNA repair genes between clusters. a,b, Inferred copy number between clusters in MDA-SC16r (a) and MDA-SC49r (b). c, Expression heatmap of genes associated with DNA repair in all CDX clusters. d, Violin plots indicating range of expression of several therapeutic targets within individual clusters. AURKA, AURKB and DLL3 were relatively unchanged between clusters. MDA-SC4s: n=978, 1022 cells for clusters 1–2; MDA-SC39s: n=1172, 828 cells for clusters 1–2; MDA-SC68s: n=733, 704, 563 cells for clusters 1–3; HCI-008s: n=596, 1,404 cells for clusters 1–2; MDA-SC49r: n=683, 317, 652, 348 cells for clusters 1–4. Each dot represents one cell and the violin curve represent the density of the cells at different expression levels.
Extended Data Figure 5.
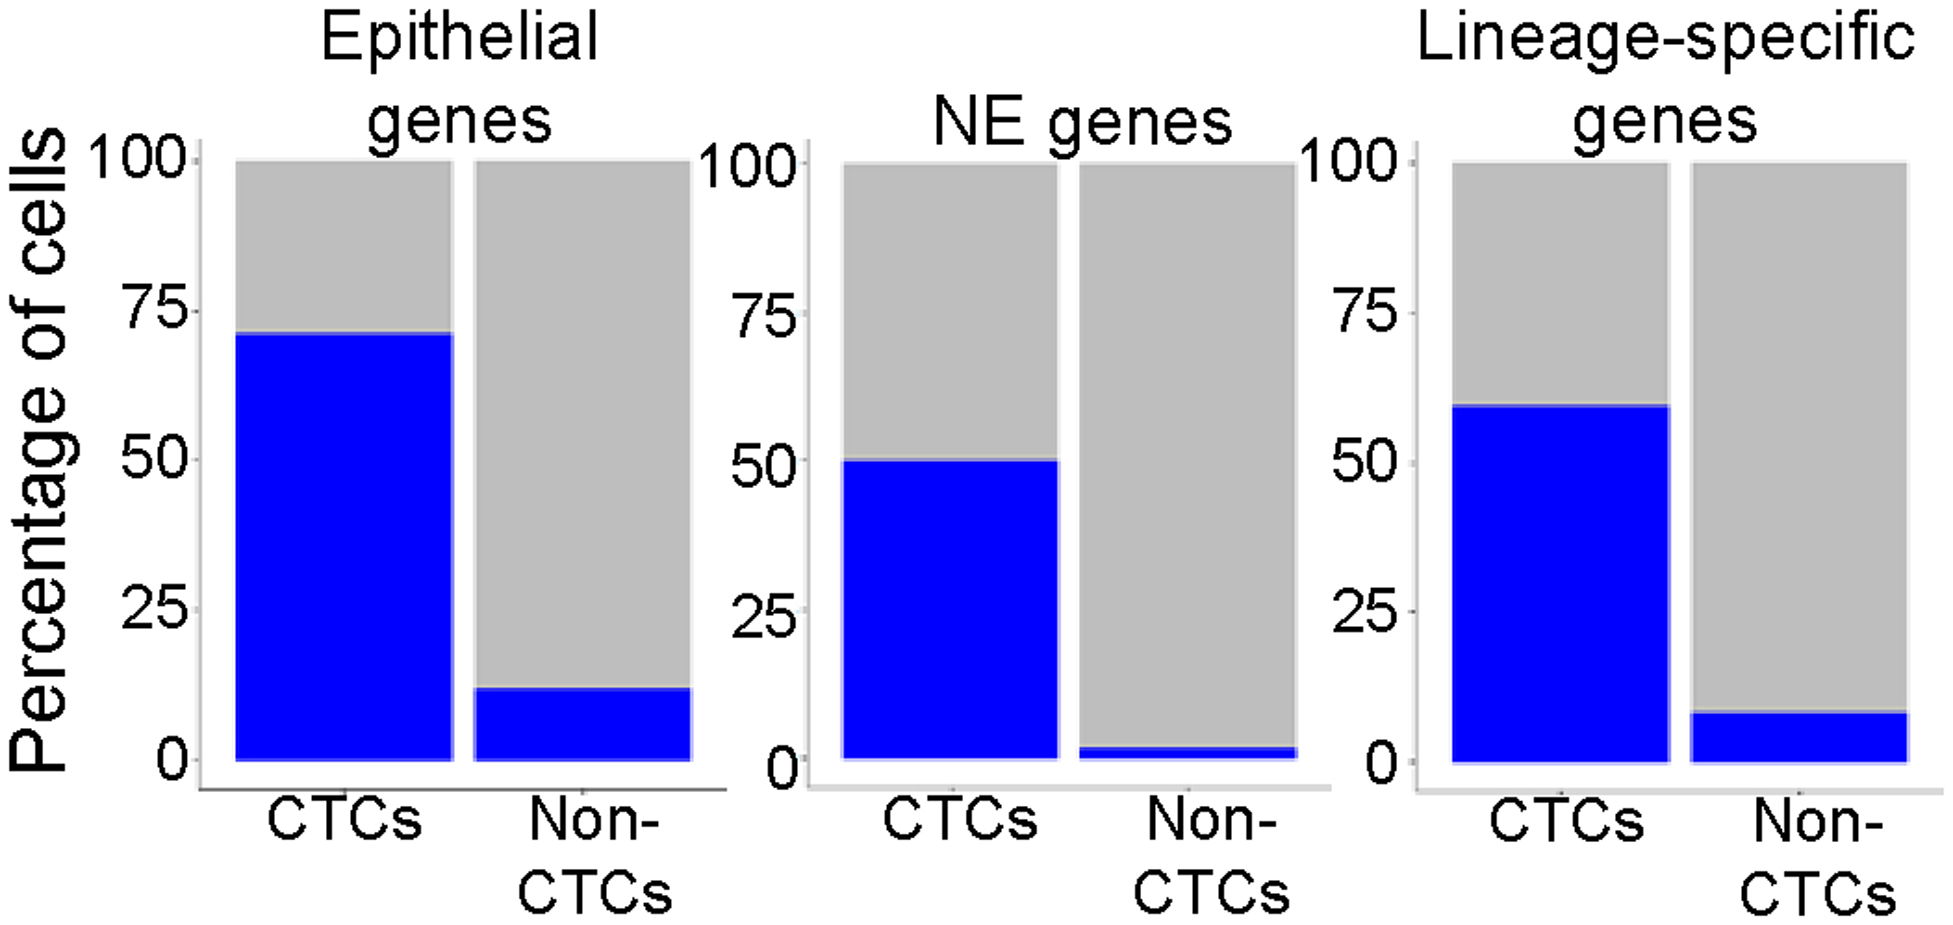
Percentage of cells expressing epithelial, NE genes (e.g., UCHL1, NCAM1, SYP, and CHGA) or SCLC lineage-specific genes (e.g., ASCL1, NEUROD1, etc.) in the CTC population and non-CTC populations. Validation of CTC identification within a patient liquid biopsy by positive expression of epithelial, NE and SCLC genes.
Extended Data Figure 6.
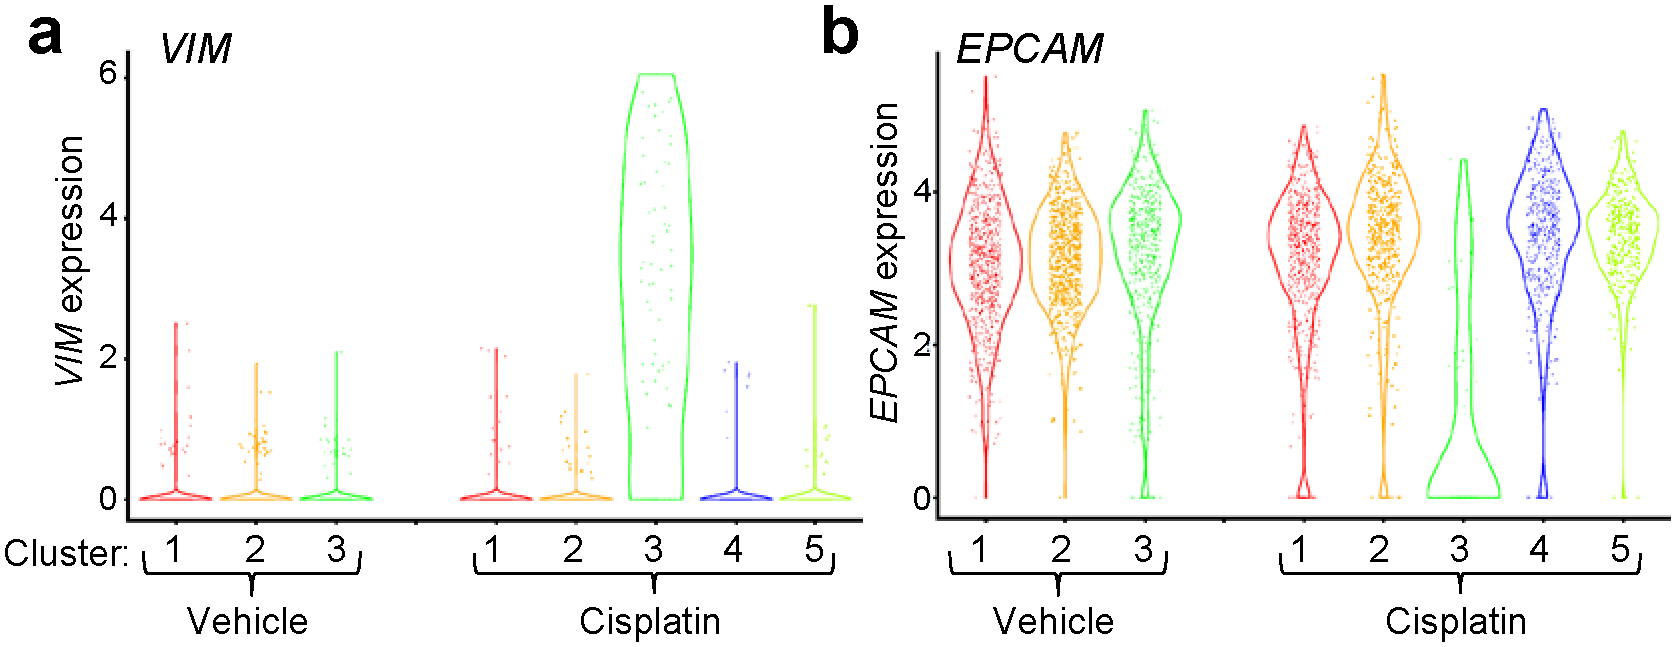
Emergence of a mesenchymal cell cluster following cisplatin-treatment. Violin plot of VIM (a) and EXPCAM (b) expression in the clusters of MDA-SC68s vehicle and cisplatin-treated CDXs. MDA-SC68 vehicle: n=733, 704, 563 cells for clusters 1–3; MDA-SC68 cisplatin: n=635, 489, 71, 467, 338 cells for clusters 1–5. Each dot represents one cell and the violin curve represent the density of the cells at different expression levels.
ACKNOWLEDGEMENTS
We thank the patients who participated in this study along with their families. We thank M. Vasquez for consenting patients; E. Roarty for scientific input and editing; and K. Ramkumar for general lab assistance. This work was supported by: The NIH/NCI CCSG P30-CA016672 (Bioinformatics Shared Resource); NIH/NCI T32 CA009666 (CMG); The University of Texas-Southwestern and MD Anderson Cancer Center Lung SPORE (5 P50 CA070907); NIH/NCI R01-CA207295 (LAB); NIH/NCI U01-CA213273 (JVH, LAB); NIH/NCI U01 CA231844 (TGO); P30CA042014 (Huntsman Cancer Institute); The Department of Defense LC170171 (LAB); ASCO Young Investigator Award (CMG); Through generous philanthropic contributions to The University of Texas MD Anderson Lung Cancer Moon Shot Program (JVH, JW, LAB); The MD Anderson Cancer Center Small Cell Lung Cancer Working Group and Abell Hangar Foundation Distinguished Professor Endowment (LAB), MD Anderson Cancer Center Physician Scientist Award (LAB); The Hope Foundation SWOG/ITSC Pilot Program (PR, LAB); an Andrew Sabin Family Fellowship (LAB); and The Rexanna Foundation for Fighting Lung Cancer (JVH, LAB).
Footnotes
COMPETING INTERESTS STATEMENT
L.A.B. serves on advisory committees for AstraZeneca, AbbVie, GenMab, BergenBio, Pharma Mar SA, Sierra Oncology, Merck, Bristol Myers Squibb, Genentech, and Pfizer and has research support from AbbVie, AstraZeneca, GenMab, Sierra Oncology, Tolero Pharmaceuticals. J.V.H. serves on advisory committees for AstraZeneca, Boehringer Ingelheim, Exelixis, Genentech, GSK, Guardant Health, Hengrui, Lilly, Novartis, Spectrum, EMD Serono, and Synta, has research support from AstraZeneca, Bayer, GlaxoSmithKline, and Spectrum and royalties and licensing fees from Spectrum. Otherwise, there are no pertinent financial or non-financial conflicts of interest to report.
REFERENCES
- 40.Horn L et al. First-Line Atezolizumab plus Chemotherapy in Extensive-Stage Small-Cell Lung Cancer. N Engl J Med 379, 2220–2229, doi: 10.1056/NEJMoa1809064 (2018). [DOI] [PubMed] [Google Scholar]
- 41.in H. R. 733 (ed Senate and House of Representatives of the United States of America in Congress assembled) (2012).
- 42.Hodgkinson CL et al. Tumorigenicity and genetic profiling of circulating tumor cells in small-cell lung cancer. Nature medicine 20, 897–903, doi: 10.1038/nm.3600 (2014). [DOI] [PubMed] [Google Scholar]
- 43.Drapkin BJ et al. Genomic and Functional Fidelity of Small Cell Lung Cancer Patient-Derived Xenografts. Cancer discovery, doi: 10.1158/2159-8290.CD-17-0935 (2018). [DOI] [PMC free article] [PubMed] [Google Scholar]
- 44.Chalishazar MD et al. MYC-Driven Small-Cell Lung Cancer is Metabolically Distinct and Vulnerable to Arginine Depletion. Clinical cancer research : an official journal of the American Association for Cancer Research, doi: 10.1158/1078-0432.CCR-18-4140 (2019). [DOI] [PMC free article] [PubMed] [Google Scholar]
- 45.Aggarwal C et al. Circulating tumor cells as a predictive biomarker in patients with small cell lung cancer undergoing chemotherapy. Lung Cancer 112, 118–125, doi: 10.1016/j.lungcan.2017.08.008 (2017). [DOI] [PubMed] [Google Scholar]
- 46.Farago AF et al. Combination Olaparib and Temozolomide in Relapsed Small-Cell Lung Cancer. Cancer discovery 9, 1372–1387, doi: 10.1158/2159-8290.CD-19-0582 (2019). [DOI] [PMC free article] [PubMed] [Google Scholar]
- 47.Zhang J et al. Intratumor heterogeneity in localized lung adenocarcinomas delineated by multiregion sequencing. Science 346, 256–259, doi: 10.1126/science.1256930 (2014). [DOI] [PMC free article] [PubMed] [Google Scholar]
- 48.Mollaoglu G et al. MYC Drives Progression of Small Cell Lung Cancer to a Variant Neuroendocrine Subtype with Vulnerability to Aurora Kinase Inhibition. Cancer Cell 31, 270–285, doi: 10.1016/j.ccell.2016.12.005 (2017). [DOI] [PMC free article] [PubMed] [Google Scholar]
- 49.Huang YH et al. POU2F3 is a master regulator of a tuft cell-like variant of small cell lung cancer. Genes Dev 32, 915–928, doi: 10.1101/gad.314815.118 (2018). [DOI] [PMC free article] [PubMed] [Google Scholar]
- 50.Cardnell RJ et al. Protein expression of TTF1 and cMYC define distinct molecular subgroups of small cell lung cancer with unique vulnerabilities to aurora kinase inhibition, DLL3 targeting, and other targeted therapies. Oncotarget 8, 73419–73432, doi: 10.18632/oncotarget.20621 (2017). [DOI] [PMC free article] [PubMed] [Google Scholar]
- 51.Lim JS et al. Intratumoural heterogeneity generated by Notch signalling promotes small-cell lung cancer. Nature 545, 360–364, doi: 10.1038/nature22323 (2017). [DOI] [PMC free article] [PubMed] [Google Scholar]
- 52.Shue YT, Lim JS & Sage J Tumor heterogeneity in small cell lung cancer defined and investigated in pre-clinical mouse models. Transl Lung Cancer Res 7, 21–31, doi: 10.21037/tlcr.2018.01.15 (2018). [DOI] [PMC free article] [PubMed] [Google Scholar]
- 53.Tirosh I et al. Dissecting the multicellular ecosystem of metastatic melanoma by single-cell RNA-seq. Science 352, 189–196, doi: 10.1126/science.aad0501 (2016). [DOI] [PMC free article] [PubMed] [Google Scholar]
- 54.Skoulidis F et al. Co-occurring genomic alterations define major subsets of KRAS-mutant lung adenocarcinoma with distinct biology, immune profiles, and therapeutic vulnerabilities. Cancer discovery 5, 860–877, doi: 10.1158/2159-8290.CD-14-1236 (2015). [DOI] [PMC free article] [PubMed] [Google Scholar]
- 55.Rudin CM et al. Molecular subtypes of small cell lung cancer: a synthesis of human and mouse model data. Nat Rev Cancer 19, 289–297, doi: 10.1038/s41568-019-0133-9 (2019). [DOI] [PMC free article] [PubMed] [Google Scholar]
- 56.Misch D et al. Value of thyroid transcription factor (TTF)-1 for diagnosis and prognosis of patients with locally advanced or metastatic small cell lung cancer. Diagn Pathol 10, 21, doi: 10.1186/s13000-015-0250-z (2015). [DOI] [PMC free article] [PubMed] [Google Scholar]
- 57.Zhang W et al. Small cell lung cancer tumors and preclinical models display heterogeneity of neuroendocrine phenotypes. Transl Lung Cancer Res 7, 32–49, doi: 10.21037/tlcr.2018.02.02 (2018). [DOI] [PMC free article] [PubMed] [Google Scholar]
- 58.George J et al. Comprehensive genomic profiles of small cell lung cancer. Nature 524, 47–53, doi: 10.1038/nature14664 (2015). [DOI] [PMC free article] [PubMed] [Google Scholar]
- 59.Jahchan NS et al. Identification and Targeting of Long-Term Tumor-Propagating Cells in Small Cell Lung Cancer. Cell reports 16, 644–656, doi: 10.1016/j.celrep.2016.06.021 (2016). [DOI] [PMC free article] [PubMed] [Google Scholar]
- 60.Singhi AD et al. MYC gene amplification is often acquired in lethal distant breast cancer metastases of unamplified primary tumors. Mod Pathol 25, 378–387, doi: 10.1038/modpathol.2011.171 (2012). [DOI] [PMC free article] [PubMed] [Google Scholar]
- 61.Lee HY et al. c-MYC Drives Breast Cancer Metastasis to the Brain, but Promotes Synthetic Lethality with TRAIL. Mol Cancer Res, doi: 10.1158/1541-7786.MCR-18-0630 (2018). [DOI] [PubMed] [Google Scholar]
- 62.Allison Stewart C et al. Dynamic variations in epithelial-to-mesenchymal transition (EMT), ATM, and SLFN11 govern response to PARP inhibitors and cisplatin in small cell lung cancer. Oncotarget 8, 28575–28587, doi: 10.18632/oncotarget.15338 (2017). [DOI] [PMC free article] [PubMed] [Google Scholar]
- 63.Gardner EE et al. Chemosensitive Relapse in Small Cell Lung Cancer Proceeds through an EZH2-SLFN11 Axis. Cancer Cell 31, 286–299, doi: 10.1016/j.ccell.2017.01.006 (2017). [DOI] [PMC free article] [PubMed] [Google Scholar]
- 64.Wagner AH et al. Recurrent WNT pathway alterations are frequent in relapsed small cell lung cancer. Nat Commun 9, 3787, doi: 10.1038/s41467-018-06162-9 (2018). [DOI] [PMC free article] [PubMed] [Google Scholar]
- 65.Byers LA et al. Proteomic profiling identifies dysregulated pathways in small cell lung cancer and novel therapeutic targets including PARP1. Cancer discovery 2, 798–811, doi: 10.1158/2159-8290.CD-12-0112 (2012). [DOI] [PMC free article] [PubMed] [Google Scholar]
- 66.Dammert MA et al. MYC paralog-dependent apoptotic priming orchestrates a spectrum of vulnerabilities in small cell lung cancer. Nat Commun 10, 3485, doi: 10.1038/s41467-019-11371-x (2019). [DOI] [PMC free article] [PubMed] [Google Scholar]
- 67.Semenova EA et al. Transcription Factor NFIB Is a Driver of Small Cell Lung Cancer Progression in Mice and Marks Metastatic Disease in Patients. Cell reports 16, 631–643, doi: 10.1016/j.celrep.2016.06.020 (2016). [DOI] [PMC free article] [PubMed] [Google Scholar]
- 68.Bottger F et al. Tumor Heterogeneity Underlies Differential Cisplatin Sensitivity in Mouse Models of Small-Cell Lung Cancer. Cell reports 27, 3345–3358 e3344, doi: 10.1016/j.celrep.2019.05.057 (2019). [DOI] [PMC free article] [PubMed] [Google Scholar]
- 69.Wu N et al. NFIB overexpression cooperates with Rb/p53 deletion to promote small cell lung cancer. Oncotarget 7, 57514–57524, doi: 10.18632/oncotarget.11583 (2016). [DOI] [PMC free article] [PubMed] [Google Scholar]
- 70.Klameth L et al. Small cell lung cancer: model of circulating tumor cell tumorospheres in chemoresistance. Sci Rep 7, 5337, doi: 10.1038/s41598-017-05562-z (2017). [DOI] [PMC free article] [PubMed] [Google Scholar]
- 71.Hamilton G, Hochmair M, Rath B, Klameth L & Zeillinger R Small cell lung cancer: Circulating tumor cells of extended stage patients express a mesenchymal-epithelial transition phenotype. Cell Adh Migr 10, 360–367, doi: 10.1080/19336918.2016.1155019 (2016). [DOI] [PMC free article] [PubMed] [Google Scholar]
- 72.Yu N, Zhou J, Cui F & Tang X Circulating tumor cells in lung cancer: detection methods and clinical applications. Lung 193, 157–171, doi: 10.1007/s00408-015-9697-7 (2015). [DOI] [PubMed] [Google Scholar]
- 73.Tanaka F et al. Circulating tumor cell as a diagnostic marker in primary lung cancer. Clinical cancer research : an official journal of the American Association for Cancer Research 15, 6980–6986, doi: 10.1158/1078-0432.CCR-09-1095 (2009). [DOI] [PubMed] [Google Scholar]
- 74.Rudin CM et al. Rovalpituzumab tesirine, a DLL3-targeted antibody-drug conjugate, in recurrent small-cell lung cancer: a first-in-human, first-in-class, open-label, phase 1 study. Lancet Oncol 18, 42–51, doi: 10.1016/S1470-2045(16)30565-4 (2017). [DOI] [PMC free article] [PubMed] [Google Scholar]
- 75.Giffin M et al. Targeting DLL3 with AMG 757, a BiTE® Antibody Construct, and AMG 119, a CAR-T, for the Treatment of SCLC. J Thorac Oncol 13 (2018). [Google Scholar]
- 76.Carbone D et al. in 2018 ASCO Annual Meeting (Chicago, IL, 2018). [Google Scholar]
- 77.Paz-Ares L et al. PL02.11 Overall Survival with Durvalumab Plus Etoposide-Platinum in First-Line Extensive-Stage SCLC: Results from the CASPIAN Study. Journal of Thoracic Oncology 14, S7–S8, doi: 10.1016/j.jtho.2019.08.061 (2019). [DOI] [Google Scholar]
- 78.Horn L et al. First-Line Atezolizumab plus Chemotherapy in Extensive-Stage Small-Cell Lung Cancer. N Engl J Med, doi: 10.1056/NEJMoa1809064 (2018). [DOI] [PubMed] [Google Scholar]
- 79.Nugent JL et al. CNS metastases in small cell bronchogenic carcinoma: increasing frequency and changing pattern with lengthening survival. Cancer 44, 1885–1893 (1979). [DOI] [PubMed] [Google Scholar]
- 80.Butler A, Hoffman P, Smibert P, Papalexi E & Satija R Integrating single-cell transcriptomic data across different conditions, technologies, and species. Nature biotechnology, doi: 10.1038/nbt.4096 (2018). [DOI] [PMC free article] [PubMed] [Google Scholar]
- 81.Jamieson AR et al. Exploring nonlinear feature space dimension reduction and data representation in breast Cadx with Laplacian eigenmaps and t-SNE. Med Phys 37, 339–351, doi: 10.1118/1.3267037 (2010). [DOI] [PMC free article] [PubMed] [Google Scholar]
- 82.Subramanian A et al. Gene set enrichment analysis: a knowledge-based approach for interpreting genome-wide expression profiles. Proc Natl Acad Sci U S A 102, 15545–15550, doi: 10.1073/pnas.0506580102 (2005). [DOI] [PMC free article] [PubMed] [Google Scholar]
- 83.McCarthy DJ, Chen Y & Smyth GK Differential expression analysis of multifactor RNA-Seq experiments with respect to biological variation. Nucleic Acids Res 40, 4288–4297, doi: 10.1093/nar/gks042 (2012). [DOI] [PMC free article] [PubMed] [Google Scholar]
- 84.Robinson MD, McCarthy DJ & Smyth GK edgeR: a Bioconductor package for differential expression analysis of digital gene expression data. Bioinformatics 26, 139–140, doi: 10.1093/bioinformatics/btp616 (2010). [DOI] [PMC free article] [PubMed] [Google Scholar]
- 85.Tong P, Chen Y, Su X & Coombes KR SIBER: systematic identification of bimodally expressed genes using RNAseq data. Bioinformatics 29, 605–613, doi: 10.1093/bioinformatics/bts713 (2013). [DOI] [PMC free article] [PubMed] [Google Scholar]
- 86.Wang J, Wen S, Symmans WF, Pusztai L & Coombes KR The bimodality index: a criterion for discovering and ranking bimodal signatures from cancer gene expression profiling data. Cancer Inform 7, 199–216 (2009). [DOI] [PMC free article] [PubMed] [Google Scholar]
- 87.Byers LA et al. An epithelial-mesenchymal transition gene signature predicts resistance to EGFR and PI3K inhibitors and identifies Axl as a therapeutic target for overcoming EGFR inhibitor resistance. Clinical cancer research : an official journal of the American Association for Cancer Research 19, 279–290, doi: 10.1158/1078-0432.CCR-12-1558 (2013). [DOI] [PMC free article] [PubMed] [Google Scholar]
- 88.Team, R. C. (ed R Foundation for Statistical Computing) (Vienna, Austria, 2015). [Google Scholar]
- 89.Li H & Durbin R Fast and accurate long-read alignment with Burrows-Wheeler transform. Bioinformatics 26, 589–595, doi: 10.1093/bioinformatics/btp698 (2010). [DOI] [PMC free article] [PubMed] [Google Scholar]
- 90.Koboldt DC et al. VarScan: variant detection in massively parallel sequencing of individual and pooled samples. Bioinformatics 25, 2283–2285, doi: 10.1093/bioinformatics/btp373 (2009). [DOI] [PMC free article] [PubMed] [Google Scholar]
- 91.Kim D et al. TopHat2: accurate alignment of transcriptomes in the presence of insertions, deletions and gene fusions. Genome Biol 14, R36, doi: 10.1186/gb-2013-14-4-r36 (2013). [DOI] [PMC free article] [PubMed] [Google Scholar]
- 92.Anders S, Pyl PT & Huber W HTSeq--a Python framework to work with high-throughput sequencing data. Bioinformatics 31, 166–169, doi: 10.1093/bioinformatics/btu638 (2015). [DOI] [PMC free article] [PubMed] [Google Scholar]
- 93.Dai Z et al. edgeR: a versatile tool for the analysis of shRNA-seq and CRISPR-Cas9 genetic screens. F1000Res 3, 95, doi: 10.12688/f1000research.3928.2 (2014). [DOI] [PMC free article] [PubMed] [Google Scholar]
- 94.Wang K, Li M & Hakonarson H ANNOVAR: functional annotation of genetic variants from high-throughput sequencing data. Nucleic Acids Res 38, e164, doi: 10.1093/nar/gkq603 (2010). [DOI] [PMC free article] [PubMed] [Google Scholar]
- 95.Stuart T et al. Comprehensive Integration of Single-Cell Data. Cell 177, 1888–1902 e1821, doi: 10.1016/j.cell.2019.05.031 (2019). [DOI] [PMC free article] [PubMed] [Google Scholar]
Associated Data
This section collects any data citations, data availability statements, or supplementary materials included in this article.
Data Availability Statement
The single cell RNA-seq and Bulk RNA-seq data have been deposited into the NCBI Gene Expression Omnibus (GEO) database (https://www.nvbi.nlm.nih.gov/geo/) with accession number GSE138474. Source data for Figures 1–6 and Extended Data Figures 1–6 have been provided as individual Source Data Files. All other data supporting the findings of this study are available from the corresponding author on reasonable request.