

Abstract
Background and Aims:
Chronic obstructive pulmonary disease (COPD) is characterized by slow progressive deterioration of respiratory function with systemic effects which have a great impact on health-related quality of life (HRQoL). The severity of airflow limitation in COPD, as reflected by forced expiratory volume in one second (FEV1) does not represent the systemic consequences of COPD. Hence, a multidimensional grading system, BODE index (Body mass index, Airflow obstruction, Dyspnea and Exercise capacity) that assessed both the pulmonary and systemic manifestations has recently been proposed to provide useful prognostic information and predict the outcome in COPD patients. The objective of this study was to evaluate the relationship between BODE index and health-related quality of life (HRQOL) in stable COPD patients and its usefulness in predicting the disease exacerbations.
Materials and Methods:
Sixty stable COPD patients who presented in the out-patient departments of Medicine and Pulmonology were recruited over one year period. We evaluated them by body-mass index, forced expiratory volume in one second (FEV1), Modified Medical Research Council dyspnea scale and six minute walk test (6MWT). BODE index was calculated using these variables. Disease duration, number of exacerbations and hospitalization in the previous year were recorded. We also administered the St. George's Respiratory Questionnaire (SGRQ) to assess the health related quality of life (HRQoL) in these patients. BODE scores were categorized into four quartiles, quartile one to four with scores of 0-2, 3-4, 5-6 and 7-10, respectively.
Results:
According to BODE score, (16) 26.7% of patients were BODE 1, (27) 45% BODE 2, (15) 25% BODE 3 and (2) 3.3% were BODE 4. Higher BODE quartiles were associated with higher total SGRQ scores and SGRQ subscale scores (symptom, activity and impact). Very strong correlations were found between BODE quartiles and total SGRQ scores (P < 0.01). Among the components of BODE index, the decrease in the FEV1 (%predicted) and 6MWD, and the increase of MMRC dyspnea grade were associated with worsening of health status (increase in total SGRQ and SGRQ subscales). BODE index also correlated with the acute exacerbations (P < 0.0012) during one year follow-up.
Conclusion:
BODE index strongly correlated with the HRQoL and also reliably predicted acute exacerbations in stable COPD patients.
Keywords: Airflow obstruction, body mass index, dyspnea, exercise capacity, quality of life, questionnaire
Introduction
Chronic obstructive pulmonary disease (COPD) is a leading cause of morbidity and mortality worldwide and results in a substantial economic and social burden.[1] It is predicted to be the third most frequent cause of death [2,3] and the fifth most common cause of disability in the world by 2020.[3] There is deterioration of respiratory function over time and the associated systemic effects lead to permanent disability in the form of dyspnea, fatigue, limited exercise capacity, and a negative impact on quality of life.[4] The major manifestation of airflow obstruction in COPD is the reduction in forced expiratory volume in first second (FEV1) which forms the basis of the classification of COPD severity by the Global Initiative for Chronic Obstructive Lung Disease (GOLD).[5] However, as COPD is a complex multi-dimensional disease, the evaluation of lung function by FEV1 alone does not represent the complex clinical consequences of COPD.
FEV1 alone, is known to correlate poorly with patients’ symptoms, quality of life, exacerbation frequency, exercise intolerance and the risk of death.[6] Hence, newer variables for disease assessment were required which can supersede the FEV1-based GOLD classification of disease severity. A multidimensional grading system that assessed the respiratory and systemic expressions of COPD would better categorize and predict outcome in these patients. The systemic manifestations of the disease have a great impact on health-related quality of life (HRQL). In 2004, Celli et al. created a mortality prediction index, known as BODE index (Body mass index, airway Obstruction, Dyspnea and Exercise capacity) – which is an integrated multistage scoring system that provides useful prognostic information in patients with COPD.[7] It has been shown that BODE index is better than the FEV1 at predicting exacerbations and mortality among COPD patients.[8] BODE scores greater than 7, 5-6 and less than 5, are associated with a 2-year mortality of 30%, 15% and 10%, respectively.[9] In view of the systemic nature of COPD, other tools like quality of life questionnaires (QoLQ) have been developed to establish the systemic impacts of the disease.[9] St. George's Respiratory Diseases Questionnaire (SGRQ) was such tool, specifically designed for COPD patients.[10]
Aim
To correlate BODE index with health-related quality of life (HRQOL).
To study the validity of BODE index in COPD patients in predicting the exacerbations.
Methods
A one year prospective study was done in patients who presented in the outpatient departments of Medicine and Pulmonology, Tata Main Hospital, from May 2017 to April 2018 and were diagnosed to have stable COPD. The study participants who fulfilled the following inclusion criteria were included in the study:
Inclusion criteria
Diagnosed cases of COPD. (COPD was defined by a FEV1/FVC of less than 0.7 (measured 20 minutes after the administration of salbutamol).
All clinically stable patients of COPD with no exacerbation within the last 6 weeks.
Exclusion criteria
An illness other than COPD that was likely to result in death.
Myocardial infarction within the preceding four months; unstable angina; or congestive heart failure (New York Heart Association class III or IV).
Inability to take the lung-function and six-minute–walk tests.
Patients with concomitant other pulmonary diseases like asthma, diffuse parenchymal lung disease, bronchiectasis, pulmonary tuberculosis, lung cancer and lung resection surgery.
Consecutive sampling method was followed for recruiting the patients.
Detailed history and thorough physical examination were carried out in all patients. The following parameters were noted - age; sex; pack-years of smoking; FVC; FEV 1 measured in liters and as a percentage of the predicted value according to the guidelines of the American Thoracic Society (ATS); the best of two six minute–walk test performed at least 30 minutes apart; the degree of dyspnea, measured with the use of the modified Medical Research Council dyspnea scale (MMRC); the body-mass index (BMI). Details of hospitalization due to exacerbations over one year period were noted.
Calculations for BODE index
Body mass index (BMI) was calculated with the formula: Weight (Kg)/Height (meter)2.
FEV1 - Spirometry was performed as per ATS recommendation using Spirometer RMS MEDSPIROR to measure post bronchodilator FEV1, FVC and FEV1/FVC ratio.
-
Dyspnoea - Severity of dyspnea was assessed with the modified Medical Research Council (MMRC) dyspnea scale as follows:
0-I only get breathless with strenuous exercise (no dyspnea)
a-I get short of breath when hurrying on the level or walking up a slight hill (mild dyspnea)
b-I walk slower than people of the same age on the level because of breathlessness or have to stop for breath when walking at my own pace on the level (moderate dyspnea)
c-I stop for breath after walking about 100 meters or after a few minutes on the level (severe dyspnea) and
d-I am too breathless to leave the house or I am breathless when dressing/undressing, going to washroom (very severe dyspnea)[11]
Distance walked in 6 minutes (6MWT) - We chose the six-minute–walk test because it predicts the risk of death in patients with COPD, the test has been standardized, and the clinically significant thresholds have been determined.[12]
Patients received points on a scale ranging from 0 (lowest value) to 3 (maximal value) for FEV1, 6MWT and dyspnoea. For body-mass index, the values were 0 or 1, because of the inflection point in the inverse relation between survival and body-mass index at a value of 21 [Table 1]. BODE index score was calculated by summation of score obtained for each variable (BMI, post-bronchodilator FEV1, MMRC dyspnea scale and 6 min walk distance (6MWD). The points for each variable were added, so that the BODE index ranged from 0 to 10 points.
Table 1.
Variables and Point Values Used for the Computation of the Body- Mass Index, Degree of Airflow Obstruction and Dyspnea, and Exercise Capacity (BODE) Index
| Variables | 0 | 1 | 2 | 3 |
|---|---|---|---|---|
| FEV1 (% of predicted)* | ≥65 | 50-64 | 36-49 | ≤35 |
| Distance walked in 6 min (m) | ≥350 | 250-349 | 150-249 | ≤149 |
| MMRC dyspnea scale $ | 0 -1 | 2 | 3 | 4 |
| Body-mass index # | >21 | ≤21 |
* FEV1 denotes forced expiratory volume in one second. FEV1 categories are based on stages identified by the American Thoracic Society (ATS). $ Scores on the modified Medical Research Council (MMRC) dyspnea scale ranging from 0 to 4. # Values for body-mass index were 0 or 1. BODE index scores measured were categorized into four quartiles, quartile 1 to 4 with scores of 0-2, 3-4, 5-6 and 7-10, respectively
Health-related quality of life (HRQoL) was measured using the English and vernacular (Hindi) versions of the St. George's respiratory questionnaire (SGRQ-C) validated for use in Indian population. It contains 50 questions, with 76 empirically derived weighted responses that cover 3 domains: symptoms, activity, and impact. The symptom component has eight items concerning frequency and severity of respiratory symptoms. The activity component has 16 questions that identify physical activities that are limited by, breathlessness. The impact component has 26 questions related to different aspects of social functioning and psychological disturbances resulting from airway disease. Scores ranging from 0 to 100 are computed for each component. In addition to the domain related score, a total score is also calculated. The SGRQ-C is scaled from 0 to 100; with 0 representing the best HRQOL. The SGRQ is a reliable, valid, and sensitive instrument for quality of life evaluation in COPD patients of different age groups, nationalities, and disease severity.[13,14] In the cohort, patients were evaluated with BODE index within 4 weeks of enrollment and were seen every 3-6 months for at least one year or until death. Ethical committee approval was obtained from the Ethics Committee for post graduate studies, Tata Main Hospital July 2016.
Statistical analysis
Data for continuous variables are presented as mean ± SD. Proportions were calculated for qualitative variables. Analysis of data was done with SPSS IBM version 21.0. Spearman's Rank correlation coefficient (ρ) and Pearson's correlation coefficient (r) were calculated to find out the correlation between different variables. Strength of the correlation was interpreted according to the value of correlation coefficient, which ranged from −1 to +1, where '−’ denotes negative correlation and '+’ denotes positive correlation. The degree of correlation was interpreted as weak, moderate, strong and very strong correlation as indicated by values ≤0.35, 0.36-0.67, 0.68-0.89 and ≥0.90, respectively. Prediction was assessed with receiver operating characteristic curve. Significance of P value was taken as P < 0.05.
Observations
A total of 60 participants with stable COPD were included in the study, of which 42 (70%) were males and 18 (30%) were females, male to female ratio being 2.3:1. The age of the study participants ranged from 40-73 years with mean (±SD) age was 57.2 (±9.5) years. Average BMI was 21 ± 3.15 kg/m2. 13 (21.7%) belonged to overweight and 27 (45%) obese category as per the Asian Indian classification of BMI. Ten (16.7%) study participants had history of diabetes and eleven (17.3%) had hypertension. Forty eight (80%) had past history of smoking, while 4 (6.7%) had history of exposure to biomass fuel combustion at home. Cumulative smoking pack-year was 32.18 ± 13.85. Mean ± (SD) of heart rate, systolic blood pressure, temperature and respiratory rate were 108 ± 14, 118 ± 11.3, 102 ± 1.1 and 22 ± 5, respectively. Mean ± (SD) hemoglobin of participants was 11.9 ± 1.7 gm/dl. WBC count, RBC count and platelet count were 3,950 ± 779, 242,123 ± 78,745 and 99,688 ± 18,956, respectively. Amongst the biochemical parameters, average fasting blood sugar was 169.52 ± 56 mg/dl. Total serum bilirubin and total serum proteins were 1.0 ± 0.67) mg/dl, and 7.6 ± 1.4 gm/dl, respectively.
BODE'S index score
Predicted FEV1% values were assessed and it was found that 4 (6.7%) patients had >65% of FEV1% value, 26 (43.3%) had value between 50- 64% of FEV1 value, 24 (40%) had 36-49% of predicted FEV1% and 6 (10%) had values ≤35 [Figure 1].
Figure 1.
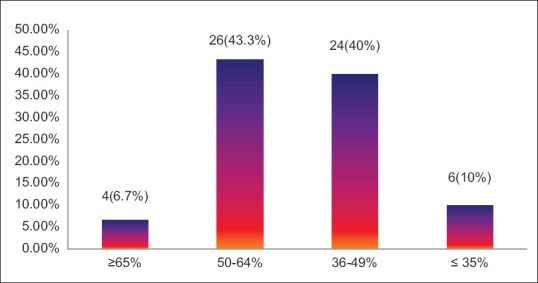
Predicted FEV1% value of study participants with COPD (n = 60)
Six minutes walking distance was assessed in the study participants and it was found that 4 (6.7%) were able to walk > 350 meters without any discomfort, 25 (41.7%) walked up to 349 to 250 meters, 23 (38.3%) walked up to 249 to 150 meters and 8 (13.3%) walked less than 149 meters [Figure 2].
Figure 2.

Six minutes walking distance of study participants with COPD (n = 60)
Modified medical research council score for dyspnea was applied to all study participants and a score of 0-1 was found in 33 (55%), 2 in 21 (35%), 3 in 4 (6.7%) and 4 in 2 (3.3%) patients [Figure 3].
Figure 3.
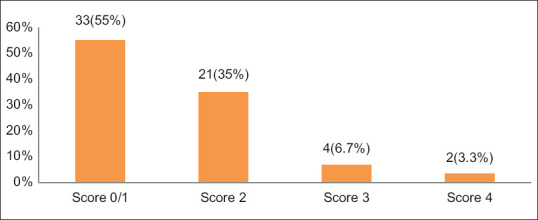
Modified medical research council dyspnea scale scores of study participants with COPD (n = 60)
BODE Index: BODE index values were as shown in the bar graph below [Figure 4]. None of the patients had index above 7.
Figure 4.
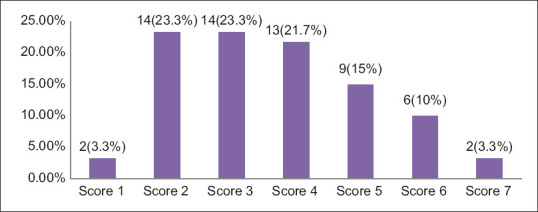
BODE index values of study participants (n = 60)
BODE index scores measured were categorized into four quartiles, quartile 1 to 4 with scores of 0-2, 3-4, 5-6 and 7-10 respectively. The distribution of patients in the BODE quartiles were as shown below in Table 2.
Table 2.
Distribution of BODE index subgroups or quartiles (n=60)
| BODE index subgroups or BODE quartiles | n (%) |
|---|---|
| BODE quartile 1 (0-2) | 16 (26.7) |
| BODE quartile 2 (3-4) | 27 (45) |
| BODE quartile 3 (5-6) | 15 (25) |
| BODE quartile 4 (7-10) | 2 (3.3) |
Mean (±SD) total values of symptom score, activity score, impact score and overall SGRQ – C scores were 59.1 ± 3.9, 62.1 ± 4.2, 43.2 ± 5.4 and 52.5 ± 4.9 respectively. Mean total SGRQ-C scores gradually increased with the increase in BODE index quartiles. The mean total SGRQ-C score was lowest in BODE quartile 1 and highest in BODE quartile 4. Mean symptom, activity and impact scores also increased with the increase in BODE index quartiles. Very strong correlation (P = 0.000; P < 0.01) was found between BODE quartiles and baseline total SGRQ-C scores [Table 3]. Figure 5 box whisker plot shows the relationship between the BODE index quartiles, the total SGRQ scores and the individual components (Symptom, Activity and Impact). Whiskers show standard deviation and horizontal lines within boxes show the mean for SGRQ total scores.
Table 3.
Distribution of SGRQ scores according to BODE quartiles
| BODE Quartiles | No (n) | Symptom (mean±SD) | Activity (mean±SD) | Impact (mean±SD) | Total score (mean±SD) |
|---|---|---|---|---|---|
| Quartile 1 | 16 | 39.1±3.8 | 45.6±3.1 | 18.2±5.5 | 26.5±2.3 |
| Quartile 2 | 27 | 50.9±3.3 | 51.6±3.1 | 28.2±5.2 | 39.1±5.3 |
| Quartile 3 | 15 | 66.9±5.8 | 67.5±5.8 | 57.4±5.9 | 59.1±5.3 |
| Quartile 4 | 2 | 79.2±2.6 | 83.5±4.6 | 68.9±5.2 | 77.1±6.6 |
| rS* | 0.893 | 0.842 | 0.823 | 0.881 | |
| P* | 0.000 (<0.01) | 0.00 (<0.01) | 0.000 (<0.01) | 0.000 (<0.01) |
* Spearman’s Rank correlation coefficient (rs). P value < 0.05 is statistically significant, SD - standard deviation
Figure 5.

Box whisker plot for the BODE index quartiles and the total SGRQ total scores and the individual components
The FEV1 values showed moderate and negative correlation with symptom and activity sub-scores and strong correlation with impact and total SGRQ scores, that is, lower values of FEV1 were associated with higher sub-scores and total scores. This relation was statistically significant, though the strength of association was moderate for symptom and activity sub-scores (r = -0.646 and r = -0.464) and strong for impact and total SGRQ score (r = -719 and -0.725 respectively). Similarly 6MWT values showed strong and negative correlation with all SGRQ sub-scores and total SGRQ scores. Strong and positive correlation was found between mMRC dyspnea scale and SCRQ sub-scores and total score. Lower BMI (≤21) was associated with higher total SGRQ score and higher BMI (>21) was associated with lower total SGRQ score. But the correlation between the BMI and total SGRQ scores was weak (r = −0.215; P = 0.01) [Table 4].
Table 4.
Distribution of mean SGRQ scores according to the individual components of BODE index
| FEV1 (%predicted) | n | Symptom (mean±SD) | Activity (mean±SD) | Impact (mean±SD) | Total (mean±SD) |
|---|---|---|---|---|---|
| ≥65% | 4 | 33.8±4.9 | 44.8±5.6 | 18.8±2.4 | 28.1±5.1 |
| 50-64% | 26 | 49.1±8.2 | 51.2±9.6 | 28.9±7.6 | 36.1±6.9 |
| 36-49% | 24 | 58.2±8.3 | 59.2±8.7 | 42.7±7.8 | 53.6±8.2 |
| ≤35% | 6 | 70.2±6.2 | 62.7±7.7 | 45.7±7.7 | 55.4±4.7 |
| r | -0.668 | -0.464 | -0.719 | -0.725 | |
| P | <0.01 | <0.01 | <0.01 | <0.01 | |
| mMRC dyspnea grade | n | Symptom (mean±SD) | Activity (mean±SD) | Impact (mean±SD) | Total (mean±SD) |
| 0-1 | 33 | 40.8±6.9 | 43.4±6.2 | 20.1±4.6 | 29.6±6.2 |
| 2 | 21 | 53.1±7.4 | 54.8±8.1 | 36.9±9.4 | 41.1±10.4 |
| 3 | 4 | 70.1±4.7 | 73.3±5.4 | 59.8±4.8 | 66.3±4.5 |
| 4 | 2 | 74.3±3.1 | 78.6±2.9 | 54.8±6.5 | 71.5±2.6 |
| r | 0.789 | 0.783 | 0.810 | 0.725 | |
| P | <0.01 | <0.01 | <0.01 | <0.01 | |
| 6 mt walk distance | n | Symptom (mean±SD) | Activity (mean±SD) | Impact (mean±SD) | Total (mean±SD) |
| ≥350 | 4 | 46.4±9.9 | 50.1±6.1 | 21.4±6.1 | 31.4±6.3 |
| 349-250 | 25 | 48.3±5.9 | 52.2±4.3 | 32.8±7.9 | 39.7±7.3 |
| 249-150 | 23 | 61.9±5.8 | 64.3±8.2 | 49.1±5.7 | 57.3±5.7 |
| ≤149 | 8 | 78.4±9.3 | 95.5±4.1 | 69.5±5.9 | 79.6±6.7 |
| r | -0.758 | -0.781 | -0.883 | -0.874 | |
| P | <0.01 | <0.01 | <0.01 | <0.01 | |
| BMI (kg/m2) | n | Symptom (mean±SD) | Activity (mean±SD) | Impact (mean±SD) | Total (mean±SD) |
| >21 | 20 | 52.9±4.9 | 54.2±8.2 | 25.2±9.2 | 38.8±9.6 |
| ≤21 | 40 | 46.8±12.3 | 51.5±11.4 | 36.2±10.1 | 42.5±12.1 |
| r | 0.135 | -0.164 | -0.219 | -0.215 | |
| P | 0.145 | 0.078 | 0.001 | 0.014 | |
r=Pearson’s correlation coefficient, Correlation is significant at the 0.01 level (two-tailed). BMI: Body mass index, FEV1: Forced expiratory volume in first second
Exacerbation of COPD during follow up period of one year
Among the study participants who have been followed up for a period of one year for any episode of exacerbation, 17 (28.3%) study participants had at least one episode of exacerbation [Figure 6] of which 12 (20%) patients required hospitalization and 5 (8.3%) patients could be managed with intensification of treatment and frequent follow up on OPD basis. There was no mortality.
Figure 6.
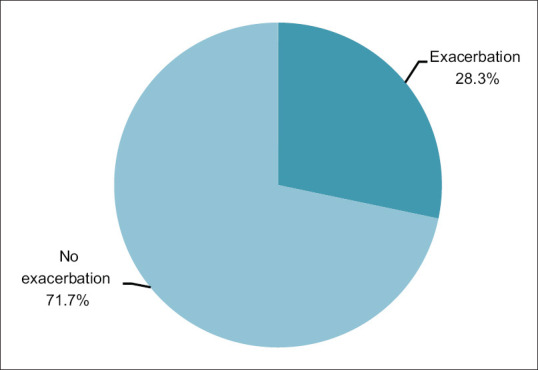
Pie chart showing exacerbation of COPD during follow up period of one year. (n = 60)
Prediction of exacerbation by BODE index
The area (95% CI) under the curve value is 0.877 (0.761-0.992) with a standard error value of 0.107. BODE index predicted 87% of the patients who developed acute exacerbations during follow-up (odds ratio- 0.33, 95% CI: 0.168-0.661, P = 0.0017) [Figure 7].
Figure 7.
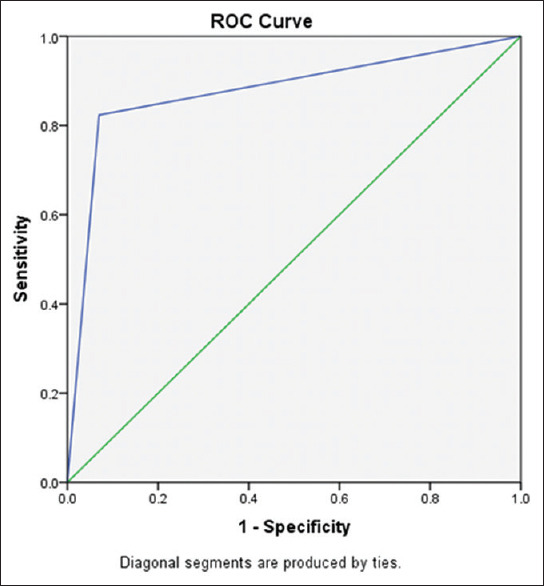
Receiver Operating Characteristic (ROC) curve analysis of BODE index score
Discussion
COPD is a disease characterized by partially reversible obstruction of the airways, according to the GOLD guidelines. Currently, COPD is considered to be the disease with increasing prevalence worldwide, much under-diagnosed and reported, and major cause of death and disability.[15] According to World Health Organization (WHO), roughly 4-6% of the adult population worldwide have clinically relevant COPD. 3 million deaths recorded every year, are caused by COPD (5% of all deaths).[16] Globally, the COPD burden is predicted to increase in the coming decades due to aging of the population and continued exposure to COPD risk factors.[17]
FEV1 is essential for the diagnosis and quantification of the respiratory impairment resulting from COPD. However, FEV1 does not adequately reflect all the systemic manifestations of the disease and post-bronchodilator FEV1% does not correlate with the patient's symptoms and quality of life assessed by SGRQ score.[6,18,19] As FEV1 is not identified as a predictor of health-related quality of life in a COPD patient, BODE index, which is a comprehensive, multi-stage scoring system was used. This study aimed to find out the correlation between the BODE index and health-related quality of life in stable COPD patients as assessed by SGRQ. It was observed that higher BODE quartiles were associated with higher (worse) SGRQ scores (Spearson's Rank coefficient correlation Rs-0.82, P = 0.000, P < 0.01). Thus, the correlation of BODE index quartiles with total SGRQ score was found to be very strong. The differences among the BODE quartiles were also highly significant for all three components (symptoms, activity and impact) of the SGRQ score (rS = 0.892, 0.842, 0.823 P = 0.000, P < 0.01 respectively). A study by Sarkar et al.[10] reported that higher BODE quartiles were associated with higher total SGRQ scores and SGRQ subscale scores (symptom, activity and impact). Very strong correlations were found between BODE quartiles and total SGRQ scores (P = 0.914; P < 0.01), activity (rS-0.764) and impact (rS-0.881) sub-scores, while moderate correlation was observed with symptoms domain (rS-0.585). They also reported that BODE index was strongly correlated with the HRQoL in stable COPD patients and it was better than GOLD classes of COPD severity to reflect the health status in patients with stable COPD. Yet another study by Ong KC et al.,[6] demonstrated significant relationship between BODE index and total SGRQ scores. In their study, total SGRQ scores were moderately to strongly associated with the BODE quartiles (rS = 0.27-0.46).
Among the individual sub-scores of BODE index, the decrease in the lung function (FEV1%predicted), and 6MWD, and an increase of MMRC dyspnea grade were associated with corresponding increase in total SGRQ and SGRQ component (symptom, activity, impact) scores [Table 3]. In our study, both 6MWT and mMRC dyspnea scale showed a strong correlation with the individual components and total SGRQ scores. Like our study, studies by González E et al.[20] and Oga T et al.[21] have shown a significant correlation between 6MWT distance and quality of life scores. However, the study by Sarkar et al.,[10] established moderate positive correlation between mMRC dyspnea scale and SGRQ score at baseline (r = -0.614; P < 0.01) and moderate negative correlation between activity (r = 0.694; P < 0.01), impact components (r = -0.641; P < 0.01) and total SGRQ score (r = -0.665; P < 0.01). The correlation between BMI and total SGRQ scores were weak and not statistically significant (P = 0.145). Similar observations were made independently by Lin YX et al.[22] in their study on BODE index and its correlation with HRQoL. Study by Araujo ZT et al. have found significant relationship between low BMI and peripheral muscle impairment and consequently low exercise capacity in individuals with COPD.[23] A study from Haryana by Sharma K et al., on 120 participants, showed BODE index to accurately predict mortality (area under the curve 0.801).[24]
Exacerbations are episodes of acute worsening of clinical condition in patients with COPD. GOLD 2018 update defines an acute exacerbation as “an acute event characterized by worsening of the patient's respiratory symptoms that is beyond normal day-to-day variations and leads to a change in medication”.[25] They have a negative impact on the patients’ quality of life, cause accelerated decline in the lung function, additional burden of hospitalization, and mortality.[25] Most exacerbations are due to infective causes, either bacterial or viral, although “non-infective” causes such as air pollution also contribute.
Our study found a significant co-relation between BODE index and COPD exacerbation (P < 0.0012). In their study of 16 months follow-up, Ong KC et al. also found that, BODE index correlated with the number of emergency visits related to exacerbation (P < 0.001).[6] In a study by Marin et al., BODE index was reported to be a much better predictor of the severity in COPD acute exacerbations than the FEV1 (incidence rate ratio, 1.20; 95% confidence interval [CI], 1.15 to 1.25; P < 0.001).[26] Study by Li CL et al. involving 396 COPD patients concluded that BODE index is a better predictor of disease severity, number of acute exacerbations (P < 0.001) and hospitalization expenses (P < 0.001).[27]
Some of the limitations of the study included small number of subjects and the levels of anxiety and depression, which are known to be significantly associated with quality of life in COPD patients, were not determined. Despite these limitations, BODE index was found to predict the health status among stable COPD patients.
Conclusion
BODE scoring system, a multidimensional scoring system, corresponds to important differences in health status of patients with COPD. The integrated scoring system correlated with the health-related quality of life in patients with COPD. It also could predict the exacerbations in these patients. The BODE index is a comprehensive, simple and feasible clinical scoring system in the evaluation of COPD patients that evaluates the pulmonary and extra pulmonary effects all together and gives a broader perspective of the disease. It should therefore be used in the clinical assessment of all patients of COPD.
Financial support and sponsorship
Nil.
Conflicts of interest
There are no conflicts of interest.
The study has received clearance from the ethical committee of Post graduate studies of Tata Main Hospital.
Informed consent was taken from all the participants.
Key Points:
Forced expiratory volume in one second (FEV1) is often used to grade the severity of COPD. However, the systemic aspects of the disease are not reflected in FEV1.
The BODE index is a multidimensional index of disease severity in COPD that incorporates four independent predictors: the body mass index (BMI), the degree of airflow obstruction assessed by the Forced Expiratory Volume in one second (FEV1), the modified Medical Research Council (mMRC) dyspnea scale, and the exercise capacity assessed by the 6-min walking distance (6MWD) test.
It has been suggested as a new follow up tool for the evaluation and predicting the health- related quality of life (HRQoL) and thus, is of prognostic significance in COPD patients.
In our study, the integrated scoring system correlated with the health-related quality of life (higher BODE quartiles correlated with worse SGRQ scores) and also could predict exacerbations in patients with COPD.
Acknowledgements
The authors would like to thank the staff of Pulmonary Medicine Department of Tata Main Hospital, for their support and collaboration.
References
- 1.Pauwels RA, Buist AS, Calverley PM, Jenkins CR, Hurd SS. Global strategy for the diagnosis, management, and prevention of chronic obstructive pulmonary disease: NHLBI/WHO Global Initiative for Chronic Obstructive Lung Disease (GOLD) Workshop summary. Am J Respir Crit Care Med. 2001;163:1256–76. doi: 10.1164/ajrccm.163.5.2101039. [DOI] [PubMed] [Google Scholar]
- 2.Lozano R, Naghavi M, Foreman K, Lim S, Shibuya K, Aboyans V, et al. Global and regional mortality from 235 cases of death for 20 age groups in 1990 and 2010: A systemic analysis for the Global Burden of Disease Study 2010. Lancet. 2012;380:2095–128. doi: 10.1016/S0140-6736(12)61728-0. [DOI] [PMC free article] [PubMed] [Google Scholar]
- 3.Murray CJL, Lopez AD. Mortality by cause for eight regions of the world: Global Burden of Disease Study. Lancet. 1997;349:1269–76. doi: 10.1016/S0140-6736(96)07493-4. [DOI] [PubMed] [Google Scholar]
- 4.Jones PW, Wijkstra PJ. Quality of life in patients with chronic obstructive pulmonary disease in: Management of Chronic Obstructive Pulmonary Disease. Eur Respir Mon. 2006;38:375–86. [Google Scholar]
- 5.Seemungal TAR, Hurst JR, Wedzicha JA. Exacerbation rate, health status and mortality in COPD-a review of potential interventions. Int J COPD. 2009;4:203–23. doi: 10.2147/copd.s3385. [DOI] [PMC free article] [PubMed] [Google Scholar]
- 6.Ong KC, Lu SJ, Soh CS. Does the multidimensional grading system (BODE) correspond to differences in health status of patients with COPD? Int J Chron Obstruct Pulmon Dis. 2006;1:91–6. doi: 10.2147/copd.2006.1.1.91. [DOI] [PMC free article] [PubMed] [Google Scholar]
- 7.Celli BR, Cote CG, Marin JM, Casanova C, Montes de Oca M, Mendez RA. The body-mass index, airflow obstruction, dyspnea, and exercise capacity index in chronic obstructive pulmonary disease. N Engl J Med. 2004;350:2308–10. doi: 10.1056/NEJMoa021322. [DOI] [PubMed] [Google Scholar]
- 8.Shapiro SD, Reilly JJ, Rennard SI. Chronic bronchitis and emphysema. In: Mason RJ, Broaddus VC, Martin TR, King TE Jr, Schraufnagel DE, Murray JF, editors. Murray and Nadel's Textbook of Respiratory Medicine. 5th ed. Philadelphia: Saunders Elsevier; 2010. pp. 919–76. [Google Scholar]
- 9.Katsura H, Yamada K, Kida K. Usefulness of a linear analog scale questionnaire to measure health-related quality of life in elderly patients with chronic obstructive pulmonary disease. J Am Geriatr Soc. 2003;51:1131–5. doi: 10.1046/j.1532-5415.2003.51363.x. [DOI] [PubMed] [Google Scholar]
- 10.Sarkar SK, Basuthakur S, Das SK, Das A, Das S, Choudhury S, et al. Evaluation of correlation of BODE index with health-related quality of life among patients with stable COPD attending a tertiary care hospital. Lung India. 2015;32:24–8. doi: 10.4103/0970-2113.148434. [DOI] [PMC free article] [PubMed] [Google Scholar]
- 11.Mahler D, Wells C. Evaluation of clinical methods for rating dyspnea. Chest. 1988;93:580–6. doi: 10.1378/chest.93.3.580. [DOI] [PubMed] [Google Scholar]
- 12.ATS Committee on Proficiency Standards for Clinical Pulmonary Function Laboratories. ATS statement: Guidelines for the six-minute walk test. Am J Respir Crit Care Med. 2002;166:111–7. doi: 10.1164/ajrccm.166.1.at1102. [DOI] [PubMed] [Google Scholar]
- 13.Xu W, Collet JP, Shapiro S, Lin Y, Yang T, Wang C. Validation and clinical interpretation of the St.George's Respiratory Questionnaire among COPD patients, China. Int J Tuberc Lung Dis. 2009;13:181–9. [PubMed] [Google Scholar]
- 14.Hajiro T, Nishimura K, Tsukino M, Ikeda A, Koyama H, Izumi T. Comparison of discriminative properties among disease specific questionnaires for measuring health related quality of life in patients with chronic obstructive pulmonary disease. Am J Respir Crit Care Med. 1998;157:785–90. doi: 10.1164/ajrccm.157.3.9703055. [DOI] [PubMed] [Google Scholar]
- 15.Global Initiative for Chronic Obstructive Lung Disease. Global strategy for the diagnosis, management, and prevention of chronic obstructive pulmonary disease. Available from: https://www.goldcopd.com .
- 16.World Health Organization. World Health Organization (WHO) website. 2016. [Last accessed on 2020 Mar 10]. Available from: http://www.who.int .
- 17.Mathers CD, Loncar D. Projections of global mortality and burden of disease from 2002 to 2030. PLoS Med. 2006;3:e442. doi: 10.1371/journal.pmed.0030442. [DOI] [PMC free article] [PubMed] [Google Scholar]
- 18.Tsiligianni I, Kocks J, Tzanakis N, Siafakas N, van der Molen T. Factors that influence disease-specific quality of life or health status in patients with COPD: A review and meta-analysis of Pearson correlations. Prim Care Respir J. 2011;20:257–68. doi: 10.4104/pcrj.2011.00029. [DOI] [PMC free article] [PubMed] [Google Scholar]
- 19.Jones PW. Health status and the spiral of decline. COPD. 2009;6:59–63. doi: 10.1080/15412550802587943. [DOI] [PubMed] [Google Scholar]
- 20.González E, Herrejón A, Inchaurraga I, Blanquer R. Determinants of health-related quality of life in patients with pulmonary emphysema. Respir Med. 2005;99:638–44. doi: 10.1016/j.rmed.2004.09.019. [DOI] [PubMed] [Google Scholar]
- 21.Oga T, Nishimura K, Tsukino M, Sato S, Hajiro T. Analysis of the factors related to mortality in chronic obstructive pulmonary disease: Role of exercise capacity and health status. Am J Respir Crit Care Med. 2003;167:544–9. doi: 10.1164/rccm.200206-583OC. [DOI] [PubMed] [Google Scholar]
- 22.Lin YX, Xu WN, Liang LR, Pang BS, Nie XH, Zhang J. The cross-sectional and longitudinal association of the BODE index with quality of life in patients with chronic obstructive pulmonary disease. Chin Med J (Engl) 2009;122:2939–44. [PubMed] [Google Scholar]
- 23.Araujo ZT, Holanda G. Does the BODE index correlate with quality of life in patients with COPD? J Bras Pneumol. 2010;36:447–52. doi: 10.1590/s1806-37132010000400009. [DOI] [PubMed] [Google Scholar]
- 24.Sharma K, Jain A, Thakar R, Sudan DPS, Goyal V, Goel N, et al. Prognostic assessment in COPD patients: BODE index and the health-related quality of life. J Assoc Chest Physicians. 2020;8:6–13. [Google Scholar]
- 25.GOLD Expert Panel. 2018 Global strategy for the diagnosis, management and prevention of COPD. [Last accessed 2018 Mar 19]. Available from: http://www.goldcopd.com .
- 26.Marin JM, Sanchez A, Alonso JE, Carrizo S. A multivariate grading system (BODE) as predictor of the severity of exacerbation in COPD [abstract] Am J Respir Crit Care Med. 2003;167:A23. [Google Scholar]
- 27.Li CL, Lin MH, Chen PS, Tsai YC, Shen LS, Kuo HC, et al. Using the BODE index and comorbidities to predict health utilization resources in chronic obstructive pulmonary disease. Int J Chron Obstruct Pulmon. 2020;19:289–95. doi: 10.2147/COPD.S234363. [DOI] [PMC free article] [PubMed] [Google Scholar]