

Abstract
Background and Aims:
Dengue is a vector-borne viral disease which is one of the major causes of public health problem in India, and its control is often the major challenges of municipal bodies in the country, especially in West Bengal. The previous outbreaks of the disease can be used to forecast the future occurrence and burden, so that authorities may optimize the available resources in order to contain and minimize the impact.
Materials and Methods:
Weekly disease outbreak data were extracted from Integrated Disease Surveillance Programme website and arranged as monthly data. Mann-Kendall test was used to determine the significance of the disease trends in various districts of Gangetic West Bengal. Time series analysis was done by using Seasonal ARIMA method to predict the number of Dengue outbreak cases for the year 2020.
Results:
Murshidabad was the only district of Gangetic West Bengal that had a significant upward Dengue cases outbreak trend. Nadia had a downward trend but it was not statistically significant. Model SARIMA (1,0,0) (1,0,0) 12 was chosen to forecast the Dengue outbreak cases which showed that the cases might start from the month of June, peak in August and wane off in October 2020. However, this prediction was not significant.
Conclusion:
Gangetic West Bengal might experience similar dengue cases as the previous year, but their numbers would be low. Only the district of Murshidabad would have upward trend. Knowledge in advance about periods of disease occurrence may enable health authorities to initiate control measures during the start of the outbreak season.
Keywords: Dengue outbreaks, MAKESENS application, seasonal ARIMA, time series analysis, trend analysis
Introduction
Dengue is a vector-borne viral disease of public health importance in nearly half of the globe. As per the World Health Organization (WHO) estimates, 100 to 400 million infections with any of the four serotypes of dengue virus occur each year.[1] Recently, outbreaks of dengue are increasing at an alarming pace in affected parts of the world including India. Occasionally, the infection leads to a potentially lethal complication, associated with haemorrhagic episodes mainly in re-infected cases with different viral serotypes. Dengue has a huge impact on both human health and the world economy. A study estimated that nearly 390 million dengue virus infections occur each year in Dengue-affected countries and more than one third of the cases are found in Asia.[2]
Dengue is endemic in almost all States and Union territories of India and occurs in a seasonal trend. Many cases are also reported at the withdrawal of the monsoon season. In 2018, the latest whole year for which the data is available as 101192 cases of Dengue which were reported to the National Health Authority of India. In 2019, till November, 136422 cases and 132 deaths were reported to the Ministry of Health and Family Welfare, Government of India.[3] This is an underestimate of all the actual cases in the community.[4]
In India, the National Vector Borne Disease Control Programme, under the aegis of the National Health Mission, is primarily responsible for overall vector and Dengue control. Integrated Disease Surveillance Programme is the source of information for us about the dengue numbers in India. Currently, the dengue surveillance in India is performed by passive, sentinel, and hospital based information.[5] Dengue is one of the major public health problems in West Bengal.[6] Almost all districts of the state are dealing with this mosquito borne disease. Primary care physicians see patients of fever. Knowing the local epidemiology of dengue will help the physician take appropriate steps in managing probable dengue cases.
Past numbers of the dengue outbreaks and cases are very important and useful source for predicting the future burden. The outbreaks of dengue can be predicted by suitable epidemiological models.[7,8,9] In the present study, we have developed a ARIMA-based prediction model for dengue using time series data over the past decade of state of West Bengal in order to forecast incidences of Dengue outbreak and cases for the year 2020.
Materials and Methods
Data collection
A disease outbreak is the occurrence of excess number of cases than expected in a given area or among a specific group of people over a particular period of time.[10] Integrated Disease Surveillance Project (IDSP) receives disease outbreak reports from all the States and Union Territories on a weekly basis through its IDSP portal. All disease outbreaks reported from the states/UTs are compiled in the form of a Weekly Outbreak Report and is uploaded on its website for availability to scholars, authorities and public. Weekly disease outbreak data available in public domain, spanning for a period of 10 years from 2010-2019 were downloaded from (IDSP) web portal.[11] Obtained data were cleaned and arranged (disease, state and district wise) in MS excel spread sheet. Subsequently, all forms of weekly outbreaks of dengue occurring in West Bengal were extracted. The number of total outbreaks reported from 2010-2019 was 151. Of these, 56 were excluded which were follow up of reports of the same outbreaks reported in previous weeks. Furthermore, 10 outbreaks occurring in districts in the Sub Himalayan West Bengal were also excluded. Finally, the remaining 85 dengue outbreaks occurring in the districts of Gangetic West Bengal were considered for descriptive analysis, trend analysis and building time series for Dengue forecast modelling as depicted in the flowchart in Figure 1.
Figure 1.

Selection of outbreaks of dengue cases of West Bengal from IDSP data for predictive analysis
Study area
The State of West Bengal is meteorically divided into two parts: Northern Sub Himalayan and Southern Gangetic.[12] In the present study the following 12 districts in the Gangetic West Bengal were considered: Bankura, Birbhum, Burdwan, Hooghly, Howrah, Murshidabad, Nadia, North 24 Parganas, Paschim Medinipur, Purba Medinipur, Purulia and South 24 Parganas.
Building time series of cases of Dengue outbreaks
Weekly Dengue outbreak data including suspected Dengue outbreak and mixed infection (Dengue and Chikungunya) reported from Gangetic West Bengal districts were arranged according to their dates of the onset of outbreak. Weekly data was transformed into monthly data and arranged in chronological order in Excel spread sheet for descriptive analysis. Trend analysis was done by Mann-Kendall statistics using MAKESENS application.[13] Time series analysis including seasonal ARIMA modelling was done by IBM SPSS® version 23 software.
In accordance with IDSP website's accessibility statement and copyright policy, the Central Surveillance Unit team at IDSP New Delhi had been informed about the utilisation of displayed weekly disease outbreak data for the generation of secondary data through analysis with the objective of forecasting of Dengue outbreak cases during the year 2020 in West Bengal.
Results
Of the 85 outbreaks incidences 72 (84.7%) were purely Dengue outbreaks, 7 (8.2%) were suspected Dengue outbreaks and 6 (7%) were mixed infection (Dengue and Chikungunya) outbreaks. 20 (23.5%) outbreaks were timely reported, 39 (45.8%) outbreaks were reported as follow up outbreak incidences, whereas 26 (30.6%) outbreaks were reported late in subsequent weeks as shown in Table 1.
Table 1.
Profile of Incidences of Dengue Outbreaks reported from West Bengal (2010 to 2019)
| Profile of Dengue Outbreaks | Characteristics of Outbreak Reporting | ||
|---|---|---|---|
| (1) Dengue outbreaks | 72 (84.7%) | (1) Timely reported | 20 (23.5%) |
| (2) Suspected Dengue Outbreaks | 7 (8.2%) | (2) Follow up reporting | 39 (45.8%) |
| (3) Mixed Infection Outbreaks | 6 (7.0%) | (3) Late reported | 26 (30.6%) |
| Total Outbreaks | 85 (100%) | Total Outbreaks | 85 (100%) |
From the weekly outbreak data from 2010 to 2019 it was observed that although maximum numbers of outbreaks (26 outbreaks, 30.6%) were reported from the district Nadia, the corresponding maximum Dengue outbreak cases (9291 cases, 35.6%) were reported from the district of North 24 Parganas in the last decade (2010-19). The highest numbers of outbreaks (15) were recorded in the year 2012. Highest number of cases (7573) were recorded in 2016. District North 24 Parganas recorded the highest number of cases (4607) in a single year, 2017 [Tables 2 and 3].
Table 2.
Dengue outbreaks in districts of Gangetic West Bengal
| Districts of West-Bengal | Incidences of Dengue Outbreaks from the Years 2010to 2019 | ||||||||||||
|---|---|---|---|---|---|---|---|---|---|---|---|---|---|
| West Bengal | SI. No. | Districts | 2010 | 2011 | 2012 | 2013 | 2014 | 2015 | 2016 | 2017 | 2018 | 2019 | Outbreaks |
| 1 | Bankuia | 1 | 1 | 1 | 3 (3.5%) | ||||||||
| 2 | Birbhum | 1 | 3 | 2 | 1 | 7(8.2%) | |||||||
| 3 | Burdwan | 1 | 4 | 2 | 7 (8.2%) | ||||||||
| 4 | Hooghly | 1 | 2 | 3 | 6 (7.0%) | ||||||||
| 5 | Howrah | 3 | 3 (3.5%) | ||||||||||
| Gangetic West-Bengal | 6 | Murshidabad | 1 | 1 | 1 | 1 | 1 | 5(5.«) | |||||
| 7 | Nadia | 3 | 12 | 4 | 1 | 2 | 1 | 2 | 1 | 26 (30.6%) | |||
| 8 | North 24 Parganas | 2 | 2 | 1 | 3 | 2 | 5 | 15 (17.6%) | |||||
| 9 | Paschim Medinipur | 1 | 1 | 1 | 3 (3.5%) | ||||||||
| 10 | Purba Medinipur | 3 | 2 | 1 | 6(7%) | ||||||||
| 11 | Punjlia | 1 | 1(1.2%) | ||||||||||
| 12 | South24Parganas | 2 | 1 | 3 (3.5%) | |||||||||
| Total Outbreaks in GWB | 8 | 5 | 15 | 10 | 9 | 8 | 12 | 9 | 6 | 3 | 85 | ||
Table 3.
Dengue outbreak cases in districts of Gangetic West Bengal
| Districts of West-Bengal | Incidences of CASES of Dengue Outbreaks from the Years 2010to 2019 | ||||||||||||
|---|---|---|---|---|---|---|---|---|---|---|---|---|---|
| West Bengal | SI. No. | Districts | 2010 | 2011 | 2012 | 2013 | 2014 | 2015 | 2016 | 2017 | 2018 | 2019 | CASES |
| 1 | Bankura | 6 | 12 | 149 | 167 (0.6%) | ||||||||
| 2 | Birbhum | 16 | 262 | 398 | 383 | 1059(4.0%) | |||||||
| 3 | Burdwan | 5o | 511 | 95 | 656(2.5%) | ||||||||
| 4 | Hooghly | 22 | 204 | 4302 | 4528(17.3%) | ||||||||
| 5 | Howrah | 640 | 640(2.4%) | ||||||||||
| Gangetic We st-Bengal | 6 | Murshidabad | 27 | 77 | 153 | 651 | 480 | 1388(5.3%) | |||||
| 7 | Nadia | 456 | 374 | 138 | 133 | 215 | 286 | 1066 | 27 | 2695(10.3%) | |||
| 8 | North 24 Parganas | 1434 | 573 | 42 | 1756 | 879 | 4607 | 9291 (35.6%) | |||||
| 9 | Paschim Medinipur | 7 | 1665 | 1568 | 3240(12.4%) | ||||||||
| 10 | Purba Medinipur | 122 | 290 | 464 | 876(3.3%) | ||||||||
| 11 | Purulia | 651 | 651 (2.5%) | ||||||||||
| 12 | South 24 Parganas | 210 | 728 | 938(3.6%) | |||||||||
| Total Cases in GWB | 1953 | 668 | 969 | 718 | 2299 | 748 | 7573 | 5566 | 4664 | 971 | 26129 | ||
Trends of Dengue outbreak cases in districts of Gangetic West Bengal (2010 to 2019)
MAKESENS application trends statistics program was used to deploy Mann-Kendall Statistical Test to infer the annual trends of dengue outbreak cases in the districts of Gangetic West Bengal. In computation of this statistical test MAKESENS exploits both S-statistics (for time series less than 10 values) and Z-statistics (for time series equal or more than 10 values). The 12 different time series comprising of annual Dengue outbreak cases of the 12 districts were computed and fed into the MAKESENS application. Since the values of all the districts were less than 10, S-statistics was utilized to calculate the significance of trends for each district.
It was observed that the districts Bankura, Bribhum, Burdwan, Hooghly, North 24 Parganas, Paschim Medinipur, Purba Medinipur and South 24 Parganas displayed an upward trend at value of α > 0.1 denoting the trends were non-significant. District Murshidabad also displayed upward trend at a significance level equal to 0.1 (α = 0.1) which was significant. District Nadia displayed downward trend for Dengue outbreak cases at significance level more than 0.1 (α > 0.1), which was non-significant. No trends could be computed for the districts of Howrah and Purulia as they have only one year of reported dengue outbreaks. The trend analysis statistics are shown in Table 4 and visually depicted in Figure 2.
Table 4.
Trend analysis of dengue cases in 12 districts of West Bengal
| TREND STATISTICS | Mann-Kendall trend* | Sen’s slope estimate | |||||
|---|---|---|---|---|---|---|---|
| Time series | First year | Last Year | n | Test S | Signific. | Q | B |
| Bankura | 2010 | 2019 | 3 | 3 | 23.833 | 6.00 | |
| Birbhum | 2010 | 2019 | 4 | 4 | 71.583 | -39.96 | |
| Burdwan | 2010 | 2019 | 3 | 1 | 9.000 | 50.00 | |
| Hooghly | 2010 | 2019 | 3 | 3 | 1070.000 | -2118.00 | |
| Howrah | 2010 | 2019 | 1 | ||||
| Murshidabad | 2010 | 2019 | 5 | 8 | + | 78.050 | -222.45 |
| Nadia | 2010 | 2019 | 8 | -6 | -21.393 | 380.07 | |
| North 24 Parganas | 2010 | 2019 | 6 | 5 | 279.000 | 327.50 | |
| PaschimMedinipur | 2010 | 2019 | 3 | 1 | 195.125 | 7.00 | |
| PurbaMedinipur | 2010 | 2019 | 3 | 3 | 85.500 | -305.50 | |
| Purulia | 2010 | 2019 | 1 | ||||
| South 24 Parganas | 2010 | 2019 | 2 | 1 | 259.000 | -1344 | |
* Since all Time Series have annual data less than 10, S-test statistics is used. “n” is the number of annual data for each district
Figure 2.

Trends of Dengue Outbreak Cases in Districts of Gangetic West Bengal from 2010 to 2019
Forecasting of Dengue outbreak cases in Gangetic West Bengal
Building forecasting model
SARIMA forecasting modelling was used to predict outcomes from independent variables that have seasonal behaviour or trends. The dengue outbreak cases from 2010-2018 were used as the estimation period and cases from 2019 were used as validation period. The cases predicted by the forecasting model for the year 2019 were validated with the actual number of observed cases for the same year. Various simulations were conducted using SPSS Seasonal ARIMA forecasting method. Some of the forecasting models are described in Table 5.
Table 5.
Selection of Seasonal Auto Regressive Integrated Moving Average (SARIMA) model for forecasting cases of Dengue outbreaks in Gangetic West Bengal
| SI No | Model Description | Stationary R Squared | Normalized BIC | MAPE | Ljung-Box Test | Predicted Cases | Observed Cases | Difference | Error Percentage |
|---|---|---|---|---|---|---|---|---|---|
| A | (1,0.0)( 1.0,0)12 | 0.228 | 12.964 | 304.230 | 0.633 | 1314.3 | 971 | 343.3 | -35.36% |
| B | (2,0,0)(1,0,0)12 | 0.257 | 12.979 | 269.047 | 0.833 | 1314.6 | 971 | 343.6 | -37.50% |
| C | (2,0,1)(1,0,1)12 | 0.277 | 13.056 | 251.263 | 0.750 | 1675.9 | 971 | 704.9 | -72.59% |
| D | (2,0,0)(1,0,1)12 | 0.276 | 13.005 | 241.446 | 0.807 | 1688.1 | 971 | 717.1 | -73.85% |
| E | (1,0,0)(1,0,1)12 | 0.257 | 12.978 | 297.254 | 0.619 | 1711.2 | 971 | 740.2 | -76.23% |
| F | (2,1,1)(0,1,1)12 | 0.564 | 13.136 | 125.942 | 0.712 | 2810.7 | 971 | 1839.7 | Not calculated |
| G | (1,1,2)(0,1,1)12 | 0.563 | 13.139 | 137.056 | 0.639 | 2828.9 | 971 | 1857.9 | Not calculated |
| H | (2,1,2)(0,1,1)12 | 0.562 | 13.201 | 138.544 | 0.529 | 2838.3 | 971 | 1867.9 | Not calculated |
| I | (0,1,1)(0,1,1)12 | 0.533 | 13.088 | 122.680 | 0.214 | 2867 | 971 | 1896 | Not calculated |
| J | (2,1,2)(1,1.0)12 | 0.525 | 13.283 | 144.693 | 0.226 | 3327.4 | 971 | 2356.4 | Not calculated |
| K | (1,1,2)(1,1,0)12 | 0.525 | 13.222 | 124.584 | 0.308 | 3334.5 | 971 | 2363.5 | Not calculated |
All models under consideration had a non-significant Ljung-Box statistical test, implying the residuals left over after model building process did not have any correlation between them and no model was missed out in the final model building process. All models gave an overestimate of the predicted values against the observed values. It was observed that the model F: (2,1,1)(0,1,1)12 had the maximum Stationary R squared value (0.564) close to 1. On a background of seasonal trend this model could utilize the most of the stationary component of the model to project as a simple mean model.
Model I, (0,1,1) (0,1,1)12 had the least Mean Average Percentage Error (MAPE) value (122.680), showing the variance of dependent (dengue outbreak cases) series with the model predicted level. Model A, (1,0,0) (1,0,0)12 displayed the least Normalized Bayesian Information Criterion (BIC) value (12.964) implying that this model was least penalized for over parameterization. This model also shows the closest predicted value (1314.3) against the observed value (971) which was an overestimate of about 35.36% of the observed value. Based on the above findings and keeping the model parsimonious, the criteria for selecting the forecasting model was least BIC value, model A: (1,0,0) (1,0,0)12 was chosen as the baseline model to forecast dengue outbreak cases for the year 2020. No transformation of inputs were performed in the modelling process. Constant have been included in the model to account for under/over differencing. Auto regression (p) has been performed in Lag 1 Seasonal auto regression (P) have been performed at Lag 1. The model parameters are displayed in Figure 3 and Table 6.
Figure 3.
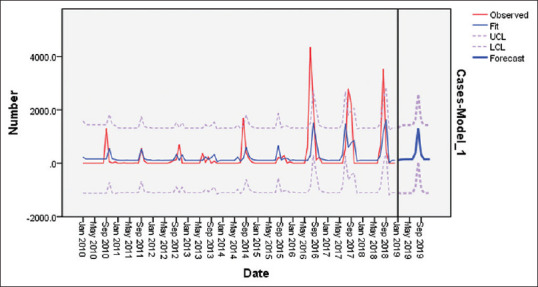
SARIMA (1,0,0)(1,0,0)12 Model Estimation period (2010 to 2018) & Validation period (2019): Incidence of Observed and Forecast of Dengue Outbreak Cases
Table 6.
SARIMA (1,0,0) (1,0,0)12 forecasting model Parameters of selected model A
| Variable | Estimate | Standard Error | T statistics | Sig. |
|---|---|---|---|---|
| Constant | 228.917 | 119.444 | 1.917 | 0.058 |
| AR Lag 1 | 0.307 | 0.093 | 3.302 | 0.001 |
| AR, Seasonal Lag 1 | 0.328 | 0.107 | 3.060 | 0.003 |
Furthermore, the analysis of the residuals that remained after model building process revealed that the residuals were not correlated as depicted by the Auto Correlation Function and Partial Auto Correlation Function. The correlation picture portrayed by the residuals were just “white noise” as depicted in Figure 4. Also, the Ljung-Box Test was also applied for identifying any significance of the residuals that turned out to be non-significant, i.e., the final model building process did not miss out any model that could have been possible with the residuals.
Figure 4.

SARIMA (1,0,0)(1,0,0)12 Model Residuals: Auto & Partial Correlation Functions
On comparing the forecast values of dengue outbreak cases with the observed cases that occurred in 2019, it was seen that the model projects non-significant upper critical limit (UCL) and lower critical limit (LCL) values for all months of 2019 except August with 1314.3 cases. In reality there are 971 reported dengue outbreak cases only in the month of August 2019. There is a difference of 343.3 cases which is an over-estimate of 35.4% of the actual value [Table 7].
Table 7.
Validation of selected SARIMA model
| Observed number of Dengue cases in outbreaks of 2019 in Gangetic West Bengal and the respective out-of-sample predicted values obtained from the SARIMA (1,0,0)(1,0,0)12 model | |||||||||||||
|---|---|---|---|---|---|---|---|---|---|---|---|---|---|
| Year: 2019 | Jan | Feb | Mar | Apr | May | Jun | July | Aug | Sep | Oct | Nov | Dec | Total |
| Observed | 0 | 0 | 0 | 0 | 0 | 0 | 0 | 971 | 0 | 0 | 0 | 0 | 971 |
| Predicted | 106.6 | 139.3 | 149.3 | 152.4 | 153.3 | 153.6 | 367.5 | 1314.3 | 311.0 | 153.7 | 153.7 | 153.7 | 1314.3 |
| UCl | 1317.2 | 1405.5 | 1420.6 | 1424.2 | 1425.2 | 1425.5 | 1639.3 | 2586.1 | 1582.9 | 1425.6 | 1425.6 | 1425.6 | |
| LCL | -1104.0 | -1126.9 | -1122.0 | -1119.4 | -1118.5 | -1118.2 | -904.4 | 42.5 | -960.8 | -1118.1 | -1118.8 | -1118.1 | |
| Significance | NS | NS | NS | NS | NS | NS | NS | Significant | NS | NS | NS | NS | |
Predicted values having both their Upper Critical Limit (UCL) & Lower Critical Limit (LCL) on either side of zero are significant (August 2019 value). UCL & LCL values (remaining months) on both sides of zero are treated as non-significant (NS).
Forecasting Dengue outbreak cases
On application of the model A: (1,0,0) (1,0,0)12 to predict forecast of dengue outbreak cases in the year 2020, it was observed that momentum of Dengue cases occurring in 2020 would start somewhere in June, peak around in August and wane off toward October [Figure 5].
Figure 5.
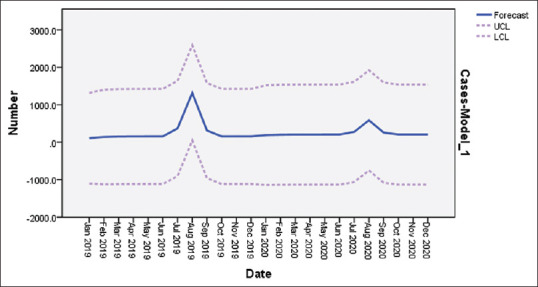
Number of projected dengue cases for the year 2020 in selected districts of West Bengal
However, on the basis of Upper/Lower Confidence Limits (UCL/LCL) of the predicted values for each months of 2020, it was found that they were not significant for any months.
Discussion
There is a current mechanism of weekly reporting of diseases for its causative aetiology from all Government recognized institutes and facilities in the Indian health system. The reporting is done for cases which are not only laboratory diagnosed but also suspected and physician approved symptomatic cases. The reports of all such facilities are compiled at a central level and any spurt of cases (in specific health facility purview) which are suggestive of any outbreak are relayed back and published in a weekly disease outbreak format consisting of the number of outbreaks reported, actions taken and the current status of the outbreak.[14] This chain of information sharing is satisfactory as long there is no delay in information sharing and taking appropriate measures to contain the outbreak. Our observation for West Bengal was that there was delay of reporting of more than 30% of outbreaks. Previous studies have divided West Bengal meteorologically into two parts, the northern Sub-Himalayan and southern Gangetic West Bengal.[15] The 10-year data extracted for West Bengal from IDSP showed that only 10 outbreaks were reported from Sub-Himalayan while 85 outbreaks from the Gangetic plains. It suggests that dengue outbreaks are more common and frequent in the Gangetic West Bengal with proportionately higher numbers of cases than the Sub-Himalayan region. This phenomenon may be attributed to be more density of population as well as greater density of responsible vectors due to more favourable mosquito genic conditions in the Gangetic plains than the Himalayan foot hills and also added with other factors such as more industrialization, urbanization and unplanned settlements.
The highest number of outbreaks in the last decade was reported from the district of Nadia and highest number of Dengue cases from the district of North 24 Parganas. The only district with a significant upward rising trend was that of Murshidabad. Cases of disease outbreaks were seen in all the districts of Gangetic West Bengal except Jhargram. The only district that displayed a downward trend was Nadia, which had the maximum number of Dengue outbreaks in the past decade (2010-2019). However, the trend was non-significant.
The forecasting model was chosen with information criterion in consideration like previous studies which have used Akiake Information Criteria (AIC). In this study more strict information criterion than the AIC is used in the form of Bayesian Information Criterion (BIC).[16]
No data transformation procedure was performed during the model building process. The SARIMA (1,0,0) (1,0,0)12 model had no differencing like in other prediction model (2,0,0) (1,0,0) used by Luz et al. for predicting Dengue in Rio de Janeiro, Brazil.[17] However, other studies of Dengue forecasting in Brazil, Bangladesh and India have incorporated differencing in their models.[7,18,19]
It was observed in the study that the predicted validation values have substantial difference with respect to the observed values. There are many reasons that might be attributed to this difference. It could be due to inclusion of only cases reported from outbreaks and not including sporadically occurring cases in the modelling process and also there is a sharp dip in the number of reported outbreak cases in 2019 than the preceding years. Further, the accuracy of the model could be achieved up to greater extent if other climatic parameters such as rainfall, temperature and humidity were also incorporated into the modelling process. Scope of improving modelling by including the diseases like Chikungunya transmitted by the same vector (Aedes mosquito) can also be explored.
Forecasting of a disease equips health administrators to have prepared themselves to deal better with the impending health problem. Having a prior knowledge about the estimates of outbreaks, cases, location and period, the limited resources can be optimized to tide over the situation. Preventive measures such as planning and organizing awareness campaigns, health activities and cleaning of potential vector breeding sites can be accelerated around the period of forecast.
Financial support and sponsorship
Nil.
Conflicts of interest
There are no conflicts of interest.
Acknowledgements
The authors are grateful to the Central Surveillance Unit (CSU) team at IDSP New Delhi for research support.
References
- 1.World Health Organization. Dengue and Severe Dengue. Factsheet, revised March 2020. Geneva: World Health Organization; 2020. [Last accessed on 2020 Mar 16]. Available from: https://www.who.int/news-room/fact-sheets/detail/dengue-and-severe-dengue . [Google Scholar]
- 2.Bhatt S, Gething PW, Brady OJ, Messina JP, Farlow AW, Moyes CL, et al. The global distribution and burden of dengue. Nature. 2013;496:504–7. doi: 10.1038/nature12060. [DOI] [PMC free article] [PubMed] [Google Scholar]
- 3.Dengue/DHF situation in India. National Vector Borne Disease Control Programme, Directorate General of Health Services, Ministry of Health and Family Welfare, Government of India. [Last accessed on 2020 Mar 16]. Available from: https://nvbdcp.gov.in/index4.php?lang=1&level=0&linkid=431&lid=3715 .
- 4.Bagcchi S. Dengue surveillance poor in India. Lancet. 2015;386:1228. doi: 10.1016/S0140-6736(15)00315-3. [DOI] [PubMed] [Google Scholar]
- 5.Pilot E, Nittas V, Murthy GVS. The organization, implementation, and functioning of Dengue surveillance in India-A systematic scoping review. Int J Environ Res Public Health. 2019;16:661. doi: 10.3390/ijerph16040661. [DOI] [PMC free article] [PubMed] [Google Scholar]
- 6.Hati AK. Studies on dengue and dengue haemorrhagic fever (DHF) in West Bengal State, India. J Commun Dis. 2006;38:124–9. [PubMed] [Google Scholar]
- 7.Bhatnagar S, Lal V, Gupta SD, Gupta OP. Forecasting incidence of dengue in Rajasthan, using time series analyses. Indian J Public Health. 2012;56:281–5. doi: 10.4103/0019-557X.106415. [DOI] [PubMed] [Google Scholar]
- 8.Liu D, Guo S, Zou M, Chen C, Deng F, Xie Z, et al. A dengue fever predicting model based on Baidu search index data and climate data in South China. PLoS One. 2019;14:e0226841. doi: 10.1371/journal.pone.0226841. [DOI] [PMC free article] [PubMed] [Google Scholar]
- 9.Jayaraj VJ, Avoi R, Gopalakrishnan N, Raja DB, Umasa Y. Developing a dengue prediction model based on climate in Tawau, Malaysia. Acta Trop. 2019;197:105055. doi: 10.1016/j.actatropica.2019.105055. [DOI] [PubMed] [Google Scholar]
- 10.Centers for Disease Control and Prevention (CDC) Lesson Six: Investigating an outbreak. Principles of epidemiology in public health practice: an introduction to applied epidemiology and biostatistics. (3rd Edition) 2006 Oct;:6–11. [Google Scholar]
- 11.Integrated Disease Surveillance Programme, NCDC, DGHS. Weekly outbreaks [Internet] Available from https://idsp.nic.in/index4.php?lang=1&level=0&linkid=406&lid=3689 .
- 12.Ghosh KG. Spatial and temporal appraisal of drought jeopardy over the Gangetic West Bengal, eastern India. Geoenvironmental Disasters. 2019 Dec 1;6(1):1. [Google Scholar]
- 13.Salmi T, Määttä A, Anttila P, Ruoho-Airola T, Amnell T, Maatta A. Detecting trends of annual values of atmospheric pollutants by the Mann-Kendall test and Sen's slope estimates: The Excel template application MAKESENS. Helsinki: Finnish Meteorological Institute; 2002. Aug, [Google Scholar]
- 14.Raut D, Bhola A. Integrated disease surveillance in India: Way forward. Global Journal of Medicine and Public Health. 2014;3(4):1–10. [Google Scholar]
- 15.Dastidar AG, Ghosh S, De UK, Ghosh SK. Statistical analysis of monsoon rainfall distribution over West Bengal, India. Mausam. 2010;61:487–98. [Google Scholar]
- 16.Clement EP. Using normalized bayesian information criterion (BIC) to improve box-jenkins model building. Am J Math Stat. 2014;4:214–21. [Google Scholar]
- 17.Luz PM, Mendes BV, Codeço CT, Struchiner CJ, Galvani AP. Time series analysis of dengue incidence in Rio de Janeiro, Brazil. Am J Trop Med Hyg. 2008;79:933–9. [PubMed] [Google Scholar]
- 18.Martinez EZ, Silva EA. Predicting the number of cases of dengue infection in Ribeirão Preto, São Paulo State, Brazil, using a SARIMA model. Cad Saude Publica. 2011;27:1809–18. doi: 10.1590/s0102-311x2011000900014. [DOI] [PubMed] [Google Scholar]
- 19.Jain R, Sontisirikit S, Iamsirithaworn S, Prendinger H. Prediction of dengue outbreaks based on disease surveillance, meteorological and socio-economic data. BMC Infect Dis. 2019;19:272. doi: 10.1186/s12879-019-3874-x. [DOI] [PMC free article] [PubMed] [Google Scholar]