Abstract
This protocol provides a step-by-step method to create recombinant fluorescent fusion proteins that can be secreted from mammalian cell lines. This builds on many other recombinant protein and fluorescent protein techniques, but is among the first to harness fluorescent fusion proteins secreted directly into cell culture supernatant. This opens new possibilities that are not achievable with proteins produced in bacteria or yeast, such as direct use of the fluorescent protein-secreting cells in live co-culture assays. The Fluorescent Adaptable Simple Theranostic (FAST) protein system includes a histidine purification tag and a tobacco etch virus (TEV) cleavage site, allowing the purification tag and fluorescent protein to be removed for therapeutic use. This protocol is split into five parts: (A) In silico characterization of the gene-of-interest (GOI) and protein-of-interest (POI); (B) design of the expression vector; (C) assembly of the expression vector; (D) transfection of a eukaryotic cell line with the expression vector; (E) testing of the recombinant protein. This extensive protocol can be completed with only polymerase chain reaction (PCR) and cell culture training. Additionally, each part of the protocol can be used independently.
Keywords: Fluorescent, Fusion protein, Recombinant, Comparative immunology, Non-model organism, Soluble, Trans-endocytosis
Background
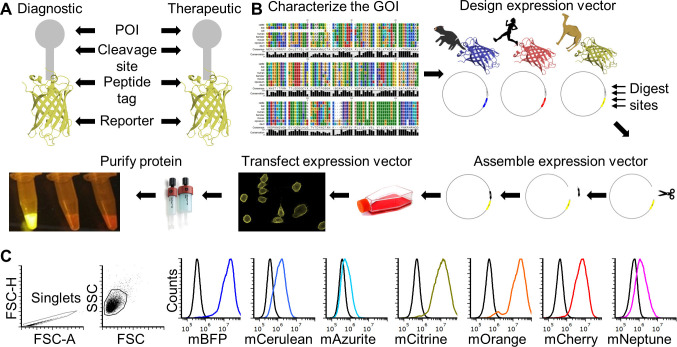
Recombinant proteins are key tools for many basic research and biomedical fields. Production of recombinant proteins generally entails design and assembly of expression vectors followed by production of the recombinant protein in prokaryotic or eukaryotic cells. Expression of proteins in eukaryotic cells is often preferred when post-translational modifications, such protein glycosylation, is important for downstream functional testing. Many excellent protocols are available for aspects of the full recombinant protein production cycle ( Benson et al., 2013 ; Flies et al., 2020 ), but few are available the provide step-by-step details for the entire production and functional testing process. This protocol can be adapted to produce species-specific recombinant proteins with and without a fluorescent reporter protein fused to a protein of interest (POI). It can also be used for creating vectors for non-secreted proteins (e.g., cell surface proteins). The methods can be used for most eukaryotic species, but we have focused on a single gene from the Tasmanian devil (Sarcophilus harrisii) for illustrative purposes. This protocol will result in a recombinant protein that includes the extracellular domain (ECD) of the CD200 (aka OX-2) protein that is fused directly to a fluorescent reporter protein. CD200 is an immune checkpoint protein that is highly expressed on several types of cancer. This protein will be secreted from mammalian cells after transfection and can be used directly from supernatant or purified for downstream use. An overview of the complete protocol can be seen in Figure 1 ( Flies et al., 2020 ).
Figure 1. FAST protein schematic and initial testing.
A. Schematic diagram of FAST protein therapeutic and diagnostic (i.e., theranostic) features. B. Graphic overview of FAST protein system including key steps: (1) characterize gene-of-interest (GOI) in silico; (2) design expression vectors; (3) digest FAST base vectors and insert alternative GOIs or colors; (4) transfect expression vectors into mammalian cells and monitor using fluorescent microscopy or flow cytometry; (5) purify the protein using 6xHistidine tag, visualize fluorescent color to show protein is in-frame and correctly folded. Image of microfuge tubes shows 100 μl of mCitrine, mOrange, and mCherry FAST proteins (1 mg/ml) excited with blue light with amber filter. Full protocols for vector construction and protein testing are available in the Supplementary Materials. C. Results of flow cytometry binding assay using Tasmanian devil 41BB (aka TNFRSF9, CD137) FAST proteins and cell lines expressing 41BB ligand (aka TNFSF9, CD137L). The colored lines in the histograms show binding of devil 41BB fused to mTagBFP, mCerulean3, mAzurite, mCitrine, mOrange, mCherry, or mNeptune2 to Chinese hamster ovary (CHO) cells transfected with devil 41BBL, and the black lines show binding to untransfected CHO cells. Figure reprinted from Flies et al. (2020) under CC BY-NC license.
The recombinant protein construct includes a linker protein with three additional features (Figure 1A). First is a TEV cleavage site, which allows the protein to be cleaved to separate the POI and the fluorescent reporter protein. Second is a rigid linker protein that provides additional separation of the POI and the reporter (i.e., so the two proteins do not interact with each other). Third is a 6x histidine (6xHis) tag that allows for easy purification from cell culture supernatant.
The protocol here describes how to make Tasmanian devil CD200-mTagBFP and CD200-mOrange Fluorescent Adaptable Simple Theranostic (FAST) proteins, but can be adapted to make most other type I transmembrane proteins and secreted proteins (e.g., cytokines). Simply replace the CD200 coding sequence with a different gene of interest (GOI) and repeat the step-by-step protocol. We have also used the expression vectors to produce type II transmembrane proteins (see definitions below for type I and II proteins).
We have made a spreadsheet available that has templates for performing each of the major experiments necessary to complete this protocol. The spreadsheet contains a tab with the list of reagents, a tab for recipes, and a tab for each experiment. Every experiment in our lab is given a unique ID based on the person performing the experiment. For example, the first experiment done by Andrew S. Flies would be exp_ASF_1. Each new lab member has their own three-letter code. We have titled the experiments in the accompanying spreadsheet as exp_ID_1.
FAST protein experiment templates from Flies et al. (2020) –Science Advances DOI: 10.1126/sciadv.aba5031 (inactive until June).
Materials and Reagents
0.22 μm PVDF syringe filter (Merck/Millipore, catalog number: SLGV033RS)
20 ml syringe (any supplier)
6-well plates, tissue culture treated (any supplier)
96-well plate, flat-bottom, tissue culture treated (any supplier)
96-well plate, U-bottom, tissue culture treated (any supplier)
Amicon Ultra centrifugal filter units, Ultra-15, MWCO 10 kDa (Merck/Millipore, catalog number: UFC901008)
Bacterial spreader (Merck/Sigma, catalog number: Z723193-500EA)
Flask, T175, tissue culture treated (T25, T75, T175, any supplier)
PCR tubes (any supplier)
Petri dishes, 100 mm (any supplier)
pH meter or pH strips (any supplier)
Pipet tips (unfiltered): 10, 200 and 1,000 μl (any supplier)
Pipet tips (filtered): 10, 200 and 1,000 μl (any supplier)
HisTrap excel columns (5 x 1 ml) (GE Life Sciences, catalog number: 17371205)
CHO-K1 cells (ATCC, catalog number: CCL-61)
E. coli DH5α competent cells (New England Biolabs, comes with NEBuilder kit)
Agarose (any supplier)
Agencourt CleanSEQ–Dye Terminator Removal (Beckman Coulter, catalog number: A29151)
Antibiotic Antimycotic Solution (100x) (Merck/Sigma, catalog number: A5955)
Big Dye Terminator kit (Thermo Fisher, catalog number: 4337455)
EX-CELL CHO protein free media (Merck/Sigma, catalog number: 14361C-1000ML)
ExpiCHO expression system (optional for high yield protein production) (Thermo Fisher, catalog number: A29133)
Formalin solution, neutral buffered, 10% (Merck/Sigma, catalog number: HT501128-4L)
Hyrdochloric acid (HCl) 12 M or higher (any supplier)
Hygromycin (Merck, catalog number: H0654-1G)
NEBuilder HiFi DNA assembly cloning kit (New England Biolabs, catalog number: E5520S)
NotI-HF (New England Biolabs, catalog number: R3189S)
Nucleic acid gel stain (any supplier)
OneTaq® Hot Start Quick-Load® 2x Master Mix with Standard Buffer (New England Biolabs, catalog number: M0488L)
Plasmid miniprep kit (Machery-Nagel, catalog number: 740499.50)
Polyethylenimine (PEI) (linear, MW 25,000) (Polysciences, catalog number: 23966-2)
Pur-A-LyzerTM Mega Dialysis Kit (Merck/Sigma, catalog number: PURG12020-1KT)
Q5® Hot Start High-Fidelity 2x Master Mix (New England Biolabs, catalog number: M0494L)
RPMI-1640 medium (Merck/Sigma, catalog number: R7509)
SmaI (New England Biolabs, catalog number: R0141S)
SOC media (New England Biolabs, comes with NEBuilder kit)
Sodium hydroxide (NaOH) 10 M or higher (any supplier)TrypLE Express enzyme (Thermo Fisher, catalog number: 12604039)
Water (e.g., Milli-Q deionized-distilled) (any supplier)
NaCl
KCl
Na2HPO4
KH2PO4
Tris base
FBS (heat inactivated)
Glutamine
2-ME
HEPES
DMEM
FCS
Sodium-pyruvate
DMSO
Tryptone
Yeast extract
KHCO3
Glycerol
Glycine
Bromophenol blue
1x Phosphate-buffered saline pH 7.4 (see Recipes)
10x Phosphate-buffered saline pH 7.4 (see Recipes)
Tris-buffered saline (TBS) pH 7.5 (see Recipes)
20% ethanol (see Recipes)
70% ethanol (see Recipes)
1 M HCl (see Recipes)
1 M NaOH (see Recipes)
Complete RPMI with 10% fetal bovine serum (cRF10) (see Recipes)
Complete RPMI with 5% fetal bovine serum (cRF5) (see Recipes)
Complete RPMI without fetal bovine serum (cRF0) (see Recipes)
Complete DMEM with 10% FBS (cDF10) (see Recipes)
Complete IMDM with 20% FBS (cIF20) for hybridomas (see Recipes)
2-mercaptoethanol (2-ME) (Merck/Sigma, catalog number: M3148) (see Recipes)
2x cell freezing media (see Recipes)
Ampicillin stock (see Recipes)
Luria broth (LB medium) (see Recipes) or (Merck/Sigma, catalog number: L3522)
Luria broth (LB) agar (see Recipes) or (Merck/Sigma, catalog number: L3147)
LB medium (low salt) (see Recipes)
LB agar (low salt) (see Recipes)
Bacterial freezing media (2x) (see Recipes)
1.5 M Tris pH 8.8 (see Recipes)
1 M Tris pH 6.8 (see Recipes)
1 M Tris pH 9.0 (see Recipes)
Ammonium chloride (block lysosomal degradation) (see Recipes)
Chloroquine diphosphate (Merck/Sigma, catalog number: C6628) (see Recipes)
RBC lysis buffer (see Recipes)
10% sodium azide (see Recipes)
4% paraformaldehyde (see Recipes)
Flow cytometry wash buffer with sodium azide, without EDTA (aka FACS buffer) (see Recipes)
Flow cytometry wash buffer with sodium azide and EDTA (aka FACS buffer) (see Recipes)
Flow cytometry fixation buffer (see Recipes)
2x Laemmli buffer (see Recipes)
6x SDS reducing buffer (see Recipes)
0.01 M Tris-HCl (see Recipes)
Tris-Glycine SDS running buffer (see Recipes)
0.15 M NaCl (see Recipes)
0.5 M EDTA (pH 8.0) (see Recipes)
50x TAE (see Recipes)
Glycerol & bromophenol blue gel loading buffer (6x) (see Recipes)
ELISA coating buffer (see Recipes)
ELISA Wash buffer (see Recipes)
D-luciferin potassium salt (see Recipes)
Lysis buffer for RNA extraction (see Recipes)
BDT sequencing buffer (see Recipes)
Immunofluorescence blocking buffer (see Recipes)
-
HisTrap Excel Reagents (see Recipes)
5 M imidazole
10x equilibration buffer
Equilibration buffer
Wash buffer
Elution buffer
Equipment
1 L beaker (any supplier)
Magnetic stir bar (any supplier)
-
ÄKTA start protein purification system (GE Life Sciences, catalog number: 29022094-ECOMINSSW)
Note: A simple peristaltic pump or gravity flow columns can be used instead to save cost.
Access to a DNA sequencing machine (any supplier)
Automated cell counter or haemocytometer (any supplier)
Bacteria shaker at 37 °C (any supplier)
Biosafety cabinet for sterile cell culture (BSC) (any supplier)
Cell culture incubators with 5% CO2 and 37 °C (any supplier)
Centrifuge, refrigerated is preferred but not necessary (any supplier)
Computer (any supplier)
Flow cytometer (any supplier)
Gel electrophoresis equipment (any supplier)
Gel Documentation System (any supplier)
Magnetic stirrer (any supplier)
Pipet controller (aka Pipet-Aid, pipettor) (any supplier)
Pipets (10 μl, 100 μl, 200 μl, 1,000 μl) (any supplier)
Thermocycler (any supplier)
Spectrophotometer (any supplier)
Software
NCBI BLASTN for sequence comparison (free use online; free download available: https://blast.ncbi.nlm.nih.gov/Blast.cgi)
-
SnapGene (free sequence viewer use online; purchase recommended for plasmid construction, SnapGene: https://www.snapgene.com/)
Note: Software for designing plasmids and aligning sequencing results. Other options are available, but this is the best in our opinion.
CLC Sequence Viewer (CLC sequence viewer is free; CLC Main Workbench, Qiagen available here)
-
Phobius (free use online: http://phobius.sbc.su.se/)
Online algorithm for determine the location of SigP (Signal peptide), ECD, TMD (Transmembrane domain), and Intracellular domain, (ICD) for the protein-of-interest.
-
TMHMM server (free use online: https://services.healthtech.dtu.dk/service.php?TMHMM-2.0)
Prediction of transmembrane helices in proteins. Should produce results that nearly match Phobius.
-
SignalP (free use online: http://www.cbs.dtu.dk/services/SignalP/)
The SignalP 5.0 server predicts the presence of signal peptides and the location of their cleavage sites in proteins from Archaea, Gram-positive Bacteria, Gram-negative Bacteria and Eukarya.
-
Simple Modular Architecture Research Analysis (SMART) (free use online: http://smart.embl-heidelberg.de/)
Identifies key structural domains in proteins. Complements Phobius and TMHMM analysis.
-
Eukaryotic Linear Motif (ELM) resource (free use online: http://elm.eu.org//index.html)
Annotation and detection of eukaryotic linear motifs (i.e., regions of the protein sequence that have known functions).
-
Webcutter (free use online: http://heimanlab.com/cut2.html)
Tool for finding potential restriction sites in a DNA sequence by introducing silent mutations that do not change the protein sequence. This is used to introduce restriction sites in the plasmid during construction that can then be used for downstream modifications of the plasmid.
-
Russel Lab (free use online: http://www.russelllab.org/aas/)
Note: If you need to change an amino acid to introduce a restriction site, then check the amino acid proper ties and consequences of substitutions to see which amino acid is the best substitution.
Databases (free to use online)
-
Genbank (https://www.ncbi.nlm.nih.gov/genbank/) ( Benson et al., 2013 )
Sequence database maintained by the National Center for Biotechnology Information (NCBI), National Library of Medicine (NLM), and National Institutes of Health (NIH)
-
Ensembl (http://ensembl.org/) ( Zerbino et al., 2018 )
Sequence database maintain by the European Molecular Biology Laboratory (EMBL)
-
UniProt (https://www.uniprot.org/) (Consortium, T. U. 2018)
This should be a first stop for basic understanding of any protein of interest. Annotations for human and mouse genes are very detailed and in most cases the proteins for other species have similar features (e.g., locating the extracellular and transmembrane domains within the protein). Commercial suppliers are also useful for cross-referencing UniProt and your own protein analysis results (e.g., RnD Systems).
Note: We have found that for species with limited information (e.g., Tasmanian devils), a de novo transcriptome assembly is extremely useful. The initial genome assemblies for many species are incomplete and/or inaccurate, so Genbank and Ensembl may not contain the correct sequence for your GOI. A de novo assembly of RNA sequencing data can provide accurate full gene transcripts that can be used to cross-check with Genbank and Ensembl sequences. Furthermore, the use of a de novo transcriptome assembly allows this protocol to be applied in species where reference genome assemblies are not available. RNA sequencing data can obtain with single-read or paired-end protocols, although paired-end data is recommended for greater sequence confidence. A transcriptome from peripheral blood cells, spleen, or lymph node should yield most of the immune system related genes. A de novo transcriptome assembly requires deeper bioinformatics skills than the rest of this protocol, so for teams without this expertise we recommend finding an experienced collaborator in the first case and then developing your own skills if needed. Please contact Dr Andrew Flies @WildImmunity for help finding a collaborator with the necessary skills.
Procedure
We have separated the protocol into five parts.
Procedure A: Characterize the GOI and POI
Procedure B: Design the expression vector
Procedure C: Assemble the expression vector
Procedure D: Transfect a eukaryotic cell line with the expression vector
Procedure E: Test the recombinant protein
-
Characterize the GOI and POI
-
1
Identify GOI (e.g., CD200, CD200R1, 41BB, 41BBL, PD1, or PDL1).
-
2
Find approved gene name from the HUGO Gene Nomenclature Committee for your GOI (http://www.genenames.org/).
e.g., CD200 (OX2, OX-2, MOX1, MOX2, MRC)
-
3
Use Ensembl or NCBI Genbank to search for the gene by name.
-
4
Locate the transcript sequence(s) for the gene.
Multiple versions may exist for each gene. e.g., CD200_X1, X2, X3, X4 (Genbank) or CD200-201, 202 (Ensembl).
Note: Transcript sequences in Genbank and Ensembl should match, but we find that they are often different, so it is best to check both databases for your GOI/POI.
-
5
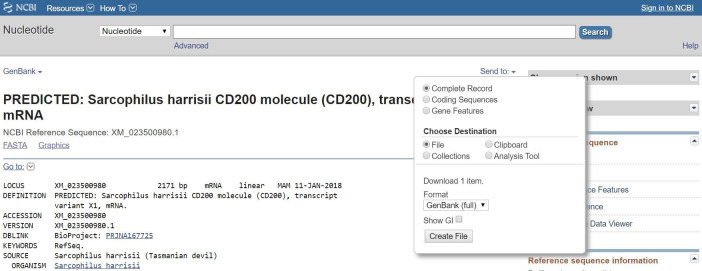
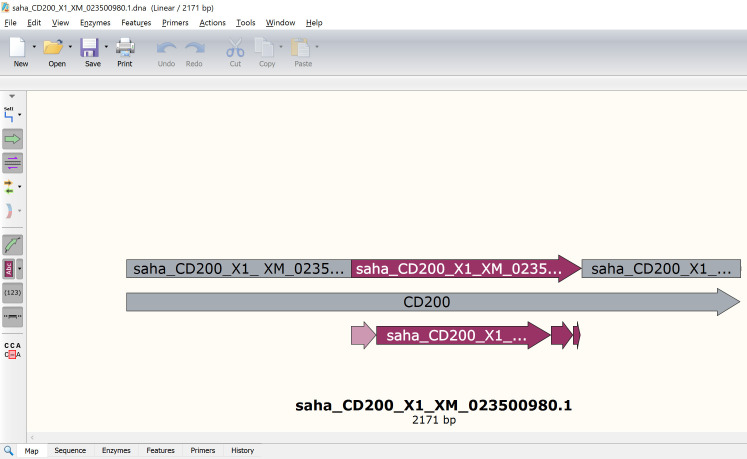
Save the GenBank (.gb) file cDNA transcripts to your computer using the appropriate naming convention (Figure 2) .
-
Species code _ approved gene name _ reference code.
e.g., saha_CD200_ENSSHAT00000000104-201 (Ensembl).
e.g., saha_CD200_X1_XM_023500980.1 (GenBank).
-
See the species table below for appropriate species code.
First two letters for the Latin genus and species.
e.g., Tasmanian devil: Sarcophilus harrisii (saha).
Ensembl uses three letter species codes (sha), but we recommend the four letter code (saha).
-
Ensembl codes start with ENS, then the species code, then either G for gene or T for transcript.
e.g., ENSSHAG00000000091
e.g., ENSSHAT00000000104
An NCBI account can be created to save your transcripts online.
The FASTA (.fa or .fasta) sequences are also ok, but the GenBank (.gb) have additional useful information.
-
-
6
Open the files using SnapGene. Note that other software programs can be used.
-
7
If the coding sequence (i.e., open reading frame (ORF) for the gene) is not annotated, then check Ensembl. If additional information is needed, perform a BLAST search to compare your GOI sequence to other species. This should allow you to determine where the potential start codons (ATG) and stop codons (TAA, TAG, or TGA) are for your GOI.
-
8
Create a new feature in the SnapGene file that indicates where the coding sequence is located.
Highlight the DNA sequence.
Select Add Feature and set the feature type to ‘CDS’ for coding sequence.
-
9
Copy the amino acid translation (i.e., protein sequence) of the coding sequence and use this to characterize the protein using freely available analysis software.
Phobius: predicts transmembrane topology and signal peptides (Figure 3) (http://phobius.sbc.su.se/).
-
ProtParam tool on the ExPASy bioinformatics server: predicts molecule weight and extinction coefficients (http://web.expasy.org/protparam/).
Remove the SigP from the protein sequence for the molecular weight and extinction coefficient analysis, because the SigP should not be present in the final protein product.
SignalP: predicts the signal peptide location and the probability that a peptide will be targeted the secretory pathway (Figure 4) .
Eukaryotic Linear Motif (ELM) resource: annotation and detection of eukaryotic linear motifs (http://elm.eu.org//index.html).
Simple Modular Architecture Resource Tool (SMART): identification and annotation of signaling domain sequences (http://smart.embl-heidelberg.de/).
-
10
Save the results from each of the above programs.
Save as either a webpage (html) or PDF.
-
Save with the correct file names that matches your SnapGene file name.
saha_CD200_X1_ XM_023500980.1_Phobius
saha_CD200_X1_ XM_023500980.1_ProtParam
saha_CD200_X1_ XM_023500980.1_SignalP
saha_CD200_X1_ XM_023500980.1_ELM
saha_CD200_X1_ XM_023500980.1_SMART
-
11
If you don’t have a gene table yet, create a spreadsheet and record the key information for the protein so that you have a single reference to lookup key information about your protein. You can also save most of the information in the SnapGene files.
-
12
Update the annotation of the SnapGene file with key information from each prediction tool.
Note: It is useful to refer to UniProt during the steps below to see if the POI in your species is similar to the ortholog in humans (https://www.uniprot.org/uniprot/P41217).
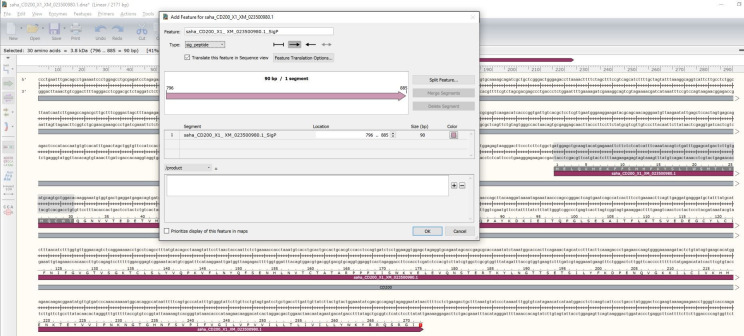
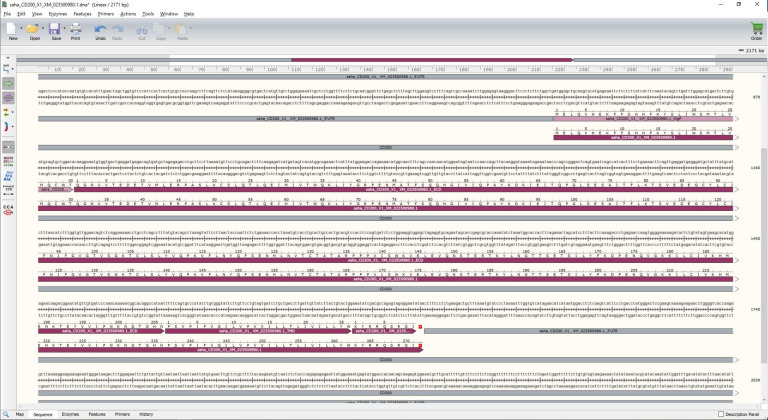
Phobius: signal peptide (SigP; Figure 5), extracellular domain (ECD; Figure 6), transmembrane domain (TMD), intracellular domain (ICD, aka cytoplasmic domain) (Figure 7) .
SignalP: Prediction of signal peptides and secreted proteins.
ProtParam: molecular weight in kilodaltons (kDA).
ELM: key motifs (e.g., Immunoreceptor tyrosine-based inhibition motif (ITIM), Immunoreceptor tyrosine-based activation motif (ITAM).
SMART: Immunoglobulin (Ig) or Tumour necrosis factor (TNF) domains.
-
13
Make sure to save your SnapGene file. You can also export it as a GenBank (.gb) file as a backup.
-
14
In SnapGene, copy the amino acid sequence and create a new protein sequence in CLC Sequence Viewer.
-
Include the full sequence name to match your SnapGene file.
e.g., saha_CD200_X1_ XM_023500980.1
-
Include the common name.
e.g., devil
-
Include the Latin species name.
e.g., Sarcophilus harrisii
-
-
15
Create a new folder for each gene.
e.g., CD200
-
16
Save the file into the correct gene folder.
Compare the POI across species
-
17
Use the NCBI “Gene” database to find the name of your GOI (e.g., CD200). The gene page will have an “orthologs” link that will show all published orthologs (i.e., the same gene in different species) for the gene.
-
18
Use NCBI blast to find homologs for the species listed in the gene table below.
-
19
Download multiple sequences simultaneously (tick boxes for matched genes that are relevant).
-
20
Save the files to your computer or NCBI account.
-
21
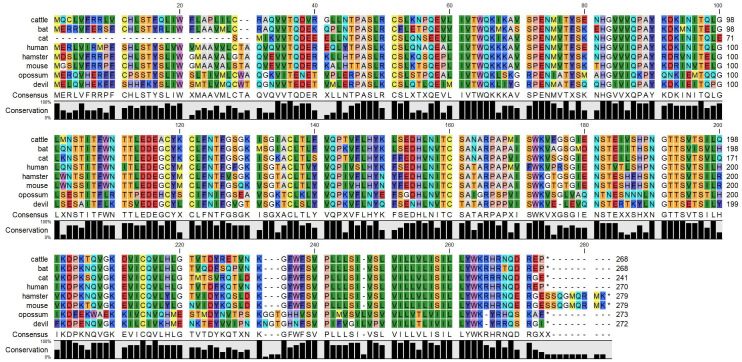
Copy the protein sequences into CLC Sequence Viewer and create a protein alignment (Figure 8).
-
22
Determine if key structural features of the protein are conserved among species.
e.g., cysteines that form disulfide bonds
e.g., conserved signal peptide and transmembrane domain
-
1
-
Design expression vector
-
Choose an expression vector (aka plasmid) for the gene.
Here we will demonstrate the process by inserting the Tasmanian devil CD200 analyzed above into our pAF164 vector. The FAST protein vectors were constructed using Sleeping Beauty plasmids available from Addgene and the Erik Kowarz lab ( Kowarz et al., 2015 ). We will cut the saha_TNFRSF9_ XM_003765221.2-ECD DNA sequence out of the pAF164 vector using restriction enzymes, and then use Gibson Assembly (e.g., NEBuilder) to insert the saha_CD200_X1_XM_023500980.1-SigP-ECD.
***Critical step***
If you are making a soluble protein, then you need to include only the coding region for the SigP and ECD of your protein (e.g., SigP-ECD) into your expression vector.
If you are making a full-length cell surface protein, then you want to include the whole ORF for your gene (e.g., SigP-ECD-TMD-ICD) in your expression vector but make sure to remove the stop codon at the end of the ORF so that the ORF continues to the 3'-end of the fluorescent protein coding sequence.
-
In SnapGene, set the origin of the plasmid to the first base at the 5'-end of the ORI. This creates a standard reference point for all the plasmids in our library.
Open the SnapGene file and place the cursor between the first base of the 5’ ORI and the base directly preceding the 5’ base.
View → Set origin.
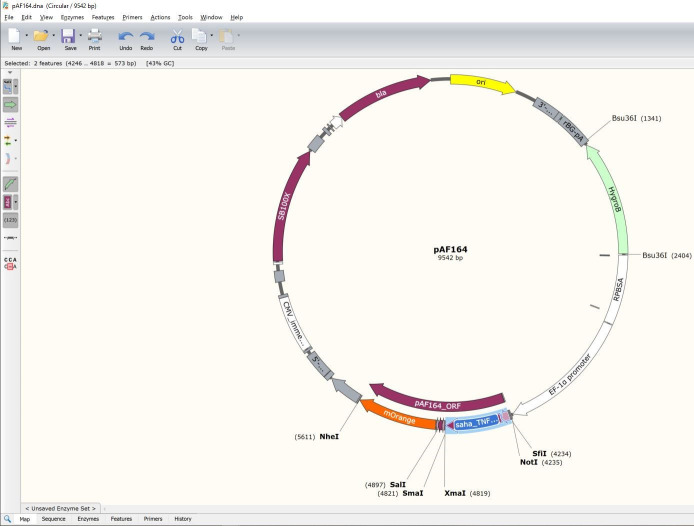
Find the location of the coding sequence to be replaced (TNFRSF9-SigP-ECD) (Figure 9).
Switch from "Map" view to "Sequence" view.
-
Make sure the entire coding sequence for the GOI to be replaced is highlighted (Figure 10).
***Critical step: Make sure to only highlight the GOI; do not highlight the SmaI/XmaI restriction site following the GOI, TEV site, linker, 6xHis, SalI restriction site, or fluorescent protein (e.g., mOrange).***
Switch to the SnapGene file containing your GOI. In this case we will switch to the saha_CD200_X1_XM_023500980.1 file created in Procedure A.
-
Highlight the saha_CD200_X1_XM_023500980.1 SigP and ECD (Figure 11).
***Critical step: To make a secreted protein, you need to make sure that only the SigP and ECD of the GOI/POI is included in the new plasmid construct.***
If the SignalP algorithm predicts that you POI has a weak SigP, then you might want to replace your SigP with a stronger SigP. We often use the hamster interleukin 2 (mau_IL2_NM_001281629) SigP because we produce our proteins using Chinese hamster ovary (CHO) cells, so the hamster SigP works well. The SigP of the protein is usually cleaved off in the endoplasmic reticulum by a signal peptidase, and thus is generally not included in the mature secreted protein and should not alter downstream function. Basically, a strong SigP will yield a higher protein concentration at the end of this process.
mau_IL2_NM_001281629_SigP DNA: atgtacagcatgcagctcgcatcctgtcttgcactgacgctcgcactccttgtcagcagt
mau_IL2_NM_001281629_SigP protein: MYSMQLASCLALTLALLVSS
Switch back to the pAF164 plasmid file.
-
Rename the file so you do not destroy the previous file.
pAF176_OFP is the devil CD200-mOrange FAST protein
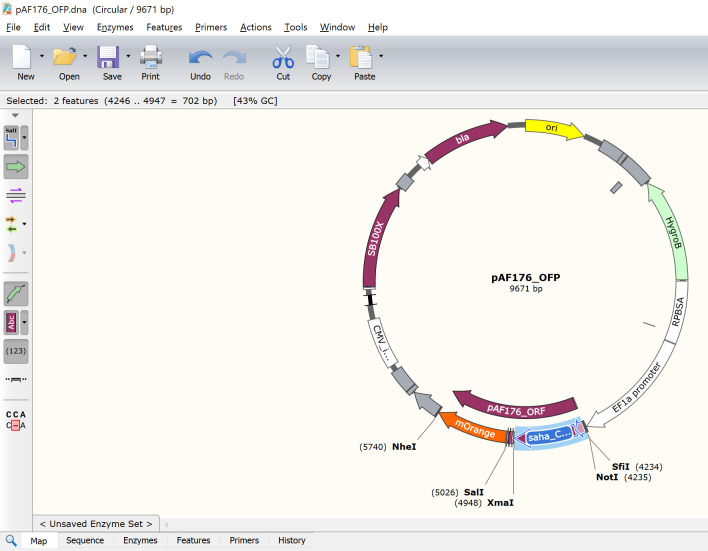
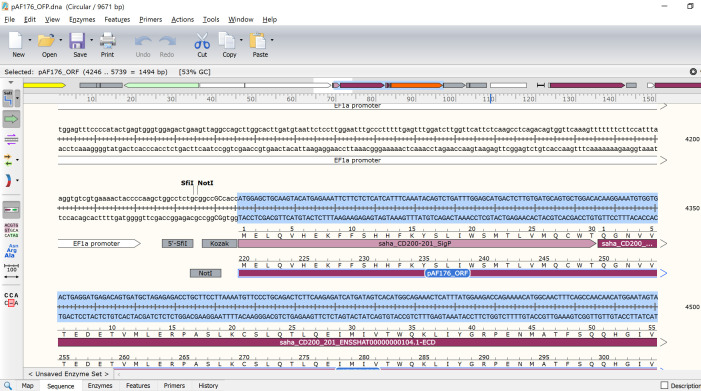
Paste the copied saha_CD200_X1_XM_023500980.1_SigP-ECD where the previous GOI is in the pAF176 file (Figure 12).
-
Update the pAF176_ORF feature to run from the ATG start codon at the start of the SigP to the TAG stop codon at the end of mOrange (Figure 13).
For pAF176 with saha_CD200_X1_XM_023500980.1 fused to mOrange, the exact DNA locations should be 4246 to 5745. This should yield a 1497 bp ORF and a 690 amino acid protein. Note that the number of base pairs in an ORF should always be divisible by three because each amino acid requires a three base pair codon. If your ORF is not divisible by three, then the protein might be out-of-frame and will not produce the correct protein.
-
Examine the updated pAF176 sequence to make sure the complete ORF is in frame. For example, the ORF for the saha_CD200_X1_XM_023500980.1 mOrange FAST protein N-terminus (i.e., CD200 start) should have MELQV (Figure 14) and the C-terminus (i.e., mOrange end) should have DELYK*. The '*' indicates the stop codon.
***Critical step: Make sure there are no early stop codons in your sequence. This can arise by including the ICD of your GOI in the construct, which will result in the linker and fluorescent reporter protein not being translated.***
-
At this point you have a full in silico plasmid construct. Next, we need to develop a method to get the actual DNA for our GOI into this construct. There are two options. The first and easiest method is to order a synthetic double stranded DNA block (e.g., gBlock) from a commercial supplier (e.g., IDT DNA). If you are confident that you know the exact sequence for your GOI, then we recommend this option. If you are not 100% confident about your DNA sequence, then it might be better to use PCR to amplify your GOI. Both methods require that the DNA sequence to be inserted into the expression vector has at least 20 bp overlaps with the insertion site in the expression vector. In the supplied pAF164 vector, we have annotated the overlap regions as "Gibson_5'_overlap" and "Gibson_3'_overlap". The pAF176 vector that contains the devil CD200 sequence is available from the authors of this protocol if you want to use it to practice replicating a working construct before embarking on your own sequences.
-
gBlock method: Highlight the Gibson_5'_overlap + SigP + ECD + Gibson_3'_overlap and create a new feature called pAF176_gBlock.
The gBlock should be 778 bp for this example.
-
PCR method: Create a forward and reverse primer to amplify the insert from cDNA from your species (Figure 15).
The primers will contain 18-30 bases that match the 5'-end of your GOI. The annealing (i.e., melting) temperature for the match to your GOI should be at least 55 °C. For the pAF176 construct, the match to saha_CD200_X1_XM_023500980.1 can be 21 bp (~57 °C): atggagctgcaagtacatgag.
The primers also need to contain extensions to add the vector overlap regions during each cycle of PCR amplification.
Use the cursor to highlight the 5'-end of the Gibson_5'_overlap through the end of your intended match for your GOI primer (59 bp total): gtgaaaactaccccaagctggcctctgcggccgccaccatggagctgcaagtacatgag.
Note that the general principles of primer design should be adhered to, but we find that most primers will work on the first try. We try to have our primers end in a C or G and avoid having the primer end in duplicates (e.g., GG or CC) or triplicates, but these are acceptable if the GOI has long repeats and there is no other option.
Repeat steps i-iv for constructing the reverse primer for the 3’-end of your GOI.
-
Order the gBlock or primers from a commercial supplier and proceed to Procedure C.
-
-
Assemble the expression vector
Notes:
We will essentially use the Gibson Assembly process (Gibson et al., 2009), but we generally use the NEBuilder kit.
-
The full set of primers, gBlocks, and plasmids are available in the supplementary material from the publication associated with this protocol (Flies et al., 2020).
Prepare the DNA insert for assembly into the expression vector using Gibson assembly
exp_ID_1: Insert_PCR tab in the (experiments spreadsheet)
-
1
Before opening the vials containing gBlocks or primers, spin the vials at 10,000 × g for one minute to ensure all lyophilized DNA is at the bottom of the vial.
-
2
Dilute the gBlock and/or primers to 100 μM in sterile deionized distilled water (ddH2O). TE buffer can also be used, but ddH2O has worked well for us.
-
3
If you are inserting a gBlock into the expression vector, then skip to Step C14.
-
4
Perform touchdown PCR to amplify and extend your target GOI.
The extension primers will have a low annealing temperature (~60 °C) during the initial amplification because only about ~50% of the primers bind to the target DNA (Figure 16). After the target DNA has been amplified the primer annealing temperature will be higher (e.g., 68 °C). To account for the potential trade-off between target specificity and the difficulty of amplifying rare target transcripts we use a touchdown PCR. We start at a high annealing temperature and decrease the temperature by 1 °C for each of the first ten cycles. Then we run an additional 25-35 cycles at a higher annealing temperature to increase specificity.
-
5
Set up PCR reaction using high-fidelity polymerase. We use New England Biolabs Q5® Hot Start High-Fidelity 2x Master Mix.
-
6
While the PCR is running pour a 1% TAE agarose gel with nucleic acid stain.
-
7
When the PCR is finished, dilute 20 μl of reaction mix with gel loading buffer.
-
8
Add ~20 μl of reaction + bromophenol blue gel loading buffer to the appropriate lanes on the gel.
Note: You will need a deep well to add a 20 μl volume, but it is good to use as much DNA as possible because DNA recovery from gels can be low.
-
9
Run for ~30 min at 100 V in 1x TAE buffer.
-
10
Visualize the gel on a blue light transilluminator.
If a blue light transilluminator is not available, a UV light source can be used. Care should be taken to limit DNA exposure to UV light as this can damage DNA and be a considerable source of downstream cloning problems. Use a sterile razor blade or plastic cutting instrument to cut around the target DNA band. Make sure not to cut directly on the glass of your UV/blue light as this can damage the glass. Use a new blade for each band to prevent carry over of DNA between samples.
-
11
Purify the DNA using a commercially available DNA gel purification kit.
-
12
Quantify the DNA on a NanoDrop spectrophotometer using the A280 DNA setting.
-
13
Dilute the DNA to 10 ng/μl using TE and store the DNA at -20 °C until needed.
Prepare the plasmid DNA for assembly into the expression vector
exp_ID_2: Plasmid_Digest (experiments spreadsheet)
-
14
Thaw plasmid pAF137 (or other vector as needed) and store on ice.
-
15
Thaw restriction enzymes on ice (e.g., NotI-HF, SmaI).
Note: XmaI and SmaI both have the same recognition site, but SmaI yields a blunt cut and is thus less likely to re-anneal during the Gibson assembly process.
-
16
Mix the DNA and restriction enzymes according to the manufacturer’s instructions.
***Critical step: Incomplete digests are a major source of downstream issues so ensuring a clean digest is critical.***
After we have confirmed a clean cut by using the digest in a successful assembly, we keep the digest and reuse for future assemblies.
-
17
Option 1: Prepare a 1% agarose gel with nucleic acid stain capable of holding 60 μl of reaction mix + bromophenol blue loading buffer. We generally accomplish this by placing a piece of tape between two of the teeth in the comb when setting the gel.
Option 2: Use 2-4 wells to load the entire 60 μl volume. You will have to cut several bands from the gel instead of one band if you use option 2.
-
18
Add the digested DNA to gel. Always include undigested plasmid as a control and a DNA ladder to estimate the size of bands.
-
19
Run for ~30 min at 100 V in 1x TAE buffer.
-
20
Visualize the gel on a blue light transilluminator (Figure 17).
-
21
Purify the DNA using a commercially available DNA gel purification kit.
-
22
Quantify the DNA on a NanoDrop spectrophotometer using the A280 DNA setting.
-
23
Store the digested DNA at -20 °C until needed.
Assemble the expression vector
exp_ID_3: Plasmid_Assembly (experiments spreadsheet)
-
24
Calculate the amount of plasmid DNA, insert DNA, and Gibson assembly master mix (e.g., NEBuilder) reagent needed.
We generally use a 1:3 ratio of plasmid:insert for single inserts less than 1,000 bp.
We also use 50 ng of digested plasmid DNA in 10 μl reactions instead of the 20 μl assemblies that are recommended by the manufacturer.
-
25
Thaw NEBuilder HiFi DNA assembly master mix on ice.
-
26
Add the DNA and reagents to the mix.
-
27
Use NEBuilder positive control (provided by the manufacturer) for your positive control.
-
28
Incubate at 50 °C for 60 min for single inserts. 15 min is sufficient, but 60 min seems to work better.
-
29
Store samples on ice or freeze until needed. It is best to perform assembly within one day, but assemblies stored for up to 14 days can still work.
Transform assembled expression vector in bacteria for plasmid amplification
Note: Use a separate set of pipets for bacterial work and for sterile cell culture work.
-
30
Transfer bacterial growth plates with LB agar and 100 μg/ml of ampicillin to a 37 °C incubator to pre-warm them.
-
31
Use DH5α competent bacteria in 1.5 ml microfuge tubes for transformation.
-
32
Thaw the bacteria on ice and be prepared to add the assembled plasmid to the bacteria as soon as they are thawed (2-5 min).
-
33
Add 2 μl (10 ng) of the DNA assembly directly to the bacteria and pipet cells up-and-down 5x to mix.
Gently tap the vial to ensure the DNA is thoroughly mixed with the bacteria.
-
34
Immediately place the vial on ice and incubate for 30-45 min.
The next step requires a rapid transition from ice to 42 °C and back to ice. Either set a microfuge heat block for 42 °C or prepare a water bath at 42 °C. We have achieved more consistent results using a water bath. If a water bath is not available, you can use any liquid container, fill it with warm water and adjust the temperature to 42 °C immediately prior to the heat shock step.
-
35
Transfer the bacteria vials from the ice to 42 °C for 30 s.
-
36
Transfer back to ice for at least two min.
-
37
Add 950 μl of SOC media to each tube.
-
38
Close the tubes tightly.
-
39
Transfer tubes to an orbital shaker, set to at least 180 rpm. Storing the tubes horizontally or at a 45-degree angle helps to ensure proper mixing.
-
40
Incubate on an orbital shaker at 37 °C for 60 min.
-
41
Spin transformed bacteria at 8,000 × g for 30 s.
-
42
Resuspend the bacteria in 100 μl of LB media with 100 μg/ml of ampicillin and transfer to the LB agar plates with ampicillin.
-
43
Spread the bacteria evenly on half of the plate using a bacteria spreader.
-
44
Use an inoculating loop to streak bacteria to the other half of the plate. This approach should yield individually recognizable colonies even with high and low transfection efficiencies.
-
45
Store the residual bacteria in the vial at 4 °C to use in case of downstream problems.
-
46
Incubate the plates overnight at 37 °C.
Perform colony PCR to determine if insert is present in bacteria
exp_ID_4: Colony_PCR (experiments spreadsheet)
-
47
Examine the bacteria plates within 18 h of plating the bacteria. Count the number of colonies on each plate.
***Critical step: A few bacterial colonies on the negative control plates is ok if the number of colonies on your new assemblies is at least 5x higher. The positive control plate should have too many colonies to count.***
-
48
Determine the number of colonies to test.
-
49
Create a colony PCR protocol (see “colony_PCR” tab in protocol spreadsheet).
-
50
Use pSB_EF1a_seq.FOR and pSB_bGH_seq.REV to amplify the entire ORF of the FAST protein coding sequences. The forward primer binds to the EF1α promotor upstream of the GOI and the reverse primer binds to the bGH UTR region downstream of the fluorescent protein coding sequence.
-
51
Use SnapGene to calculate the expected size of the amplicon based on the length of the amplified DNA and primers.
-
52
Label PCR tubes to match the protocol.
-
53
Create an extra set of PCR tubes to match the bacterial colonies to be tested. Label the tubes as “bacteria tubes”.
-
54
Add 10 μl of sterile PBS to each of the bacteria tubes.
-
55
Thaw the primers and OneTaq® Hot Start Quick-Load® 2x Master Mix with Standard Buffer (NEB # M0488L).
OneTaq Master Mix contains gel loading buffer, so do not add additional loading buffer prior to running the gel.
-
56
Mix the PCR reagents according to the protocol in the “colony PCR” spreadsheet.
-
57
Distribute the PCR mix to the colony PCR tubes.
-
58
Use a filtered pipet tip to gently touch one of the selected bacterial colonies.
***Critical step***
Make sure to touch only a single colony and do not take the entire colony. Mixing two colonies will lead to failure. Also, the colony might have to be used to start a new culture if other problems arise, so leave enough bacteria in the colony to inoculate a new culture.
Try not to get agar on the tip, as too much can overload the PCR. Even a single bacterium should have enough DNA for the PCR.
-
59
Insert the pipet tip with the bacteria into the appropriate “bacteria tube” that contains 10 μL of sterile PBS. Pipet up-and-down several times and drag the tip around the tube to ensure that some of the bacteria remain in the PBS and some of the bacteria remain on the tip. These tubes are the bacterial stock for seeding an overnight culture if the colony PCR yields positive results.
-
60
Directly transfer the tip with the bacteria to appropriate colony PCR tube. Pipet up-and-down several times and drag the tip around the tube to ensure that some bacteria are transferred into the colony PCR tube.
-
61
Discard the tip into bleach and repeat for each additional colony.
-
62
Run the PCR reaction for 30-35 cycles with an annealing temperature of 55 °C. See experiment template for additional details.
-
63
Pour a 1% TAE agarose gel with nucleic acid stain while the PCR is running.
-
64
Transfer 10 μl from colony PCR tubes into the appropriate wells on the gel.
-
65
Run for ~30 min at 100 V in 1x TAE buffer.
-
66
Record an image of the gel.
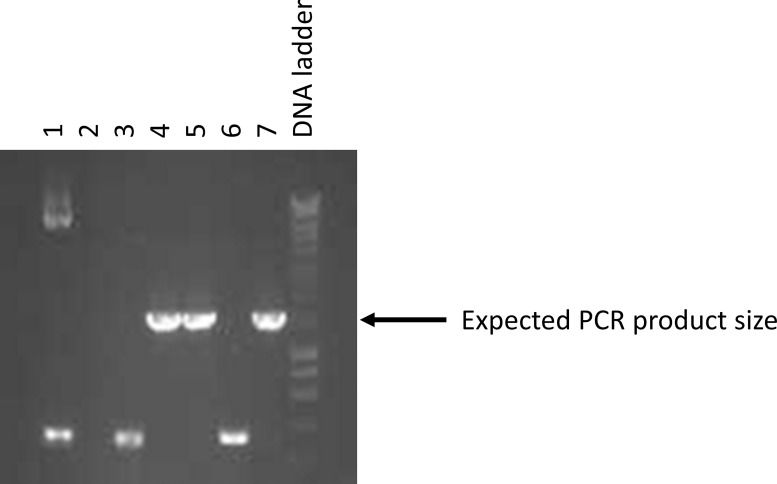
-
67
Determine which lanes/tubes had the correct size amplicon (Figure 18).
-
68
Set up overnight cultures for colonies that yielded amplicons with the correct size by transferring 5 ml of LB media with 100 μg/ml of freshly thawed ampicillin into a sterile 50 ml tube.
-
69
Transfer 5 μl from the “bacteria tubes” into the appropriate 50 mL tubes to inoculate the overnight culture.
Inoculated untransformed bacteria can be used as a negative control (i.e., untransformed bacteria should not have ampicillin resistance). The NEBuilder positive control cells or any bacteria with ampicillin resistance can be used as a positive control.
Incubate at 37 °C overnight on an orbital shaker with at least 180 rpm.
-
70
After overnight incubation (less than 16 h) check to see if the bacteria have proliferated. A turbid (i.e., cloudy) tube indicates that the bacteria have proliferated.
Miniprep to isolate plasmid DNA from bacteria
-
71
Label 2 ml microfuge tubes for the tubes that show bacterial proliferation.
-
72
Transfer 1.5 ml of bacterial broth to the appropriate microfuge tube.
-
73
Spin at 8,000 × g for 30 s.
-
74
Remove the supernatant with a pipette.
-
75
Transfer another 1.5 ml of the same bacterial broth(s) to their respective tubes and spin and remove supernatant again. If the bacteria produce a high copy number of the plasmid, then this second step is not needed.
-
76
Follow the manufacturer’s instructions for the miniprep procedure.
Ensuring complete lysis of the bacteria to release the plasmid DNA is critical to getting a high yield of plasmid DNA.
-
77
Quantify the DNA using the A280 DNA setting on a NanoDrop spectrophotometer.
Blank the spectrophotometer with the elution buffer provided with the plasmid DNA kit.
-
78
Store the plasmid DNA in the freezer until you are ready to sequence the DNA.
Sequencing plasmid DNA
We strongly recommend that you use a commercial DNA sequencing service provider to sequence your DNA. For example, in Australia there are many Australian Genome Research Facility (AGRF) collection points where DNA with sequencing primers can be dropped off. Sequencing results are usually returned within 1-2 days. If your institution has a DNA sequencing machine, contact the manager of the machine to get the correct protocol and advice. The protocol below is specific for using an Applied Biosystems 3400 Genetic Analyzer with Big Dye Terminator (BDT). Other reagents and sequencing machines will have different protocols.
exp_ID_5: Plasmid_Sequencing (experiments spreadsheet)
-
79
Label PCR tubes for the sequencing PCR.
PCR for sequencing requires only a single primer, as opposed to normal PCR that requires a forward and reverse primer. However, you will want to sequence the plasmid insert from both the forward and reverse orientation, so two reactions are needed for each plasmid.
pSB_EF1a_seq.FOR: Binds upstream of the DNA insert.
pSB_bGH_seq.REV: Binds downstream of the DNA insert.
-
80
Retrieve primers, plasmids, sequencing buffer, and the BDT on ice.
Primers and plasmids are stored at -20 °C.
Sequencing buffer is stored at 4 °C.
-
BDT is stored in 10 μL aliquots at -80 °C.
Purchasing a BDT kit is a relatively large investment, so hopefully you can just use a sequencing service instead of doing the whole process yourself.
-
81
Prepare the sequencing mix.
Make a little extra to make sure you don’t run out on the last tube.
1x vol (μl)
Sequencing Buffer 1.75
Big Dye Terminator 0.25
DNA μl (100-500 ng for plasmid) X
Primer 1
Add H2O to 10 μl 10 - 1.75 - 0.25 - X - 1
-
82
Aliquot ddH2O into PCR tubes.
-
83
Aliquot DNA into PCR tubes.
-
84
Aliquot primer into PCR tubes.
-
85
Mix total BDT + sequencing buffer and aliquot into PCR tubes (2 μl/tube).
-
86
Run sequencing reaction on thermal cycler.
Denature at 96 °C for 10 s.
-
Anneal at 55 °C for 5 s.
50 °C is recommended but the annealing temperatures are generally higher, so we usually use 55 °C.
Extend at 60 °C for 4 min.
-
Run for 35 cycles
25 cycles should work, but usually results in a residual 'dye front' in the results around 70 bp from the 5’start region.
Cleaning your sequencing reaction with Agencourt CleanSEQ
-
87
Vortex the CleanSeq tube to resuspend any magnetic particles that may have settled.
-
88
Add 10 μl of CleanSeq to each sample.
-
89
Add 42 μl of 85% ethanol to the sample(s) according to the table below.
-
90
Mix reaction thoroughly by pipet mixing or by replacing the lids and inverting several times. The mixture should be homogenous after mixing.
-
91
Place samples onto a magnetic plate for 3 min. Wait for the solution to clear before proceeding to the next step.
-
92
Aspirate the cleared solution and discard. This must be performed while on the magnetic plate.
-
93
Do not disturb the ring of beads stuck to edge of the tube.
***Critical step: Pipet with great care to avoid carrying over beads into your sequencing assay.***
-
94
Add 100 μl 85% ethanol.
-
95
Incubate for 30 s.
-
96
Aspirate and discard the ethanol.
-
97
Repeat Steps 95-97 once.
-
98
Dry samples at room temperature for at least 15 min.
***Critical step: Ensure the samples can fully dry; residual ethanol will affect results.***
-
99
Add 30 μl of water and mix using a pipet or again by adding the caps and inverting several times. Incubate the plate for 2 min at room temperature.
-
100
Remove 15 μl of the clear liquid, avoiding any beads, and add it to the 96-well sequencing plate. Be careful not to disturb the ring of beads.
-
101
Denature the clean sequencing products by placing the plate in the thermal cycler (with the grey septa lid in place) and heating at 95 °C for 5 min. Make sure the heated lid function is switched off.
-
102
The reaction plate is now ready to be loaded into the sequencer.
-
103
Kindly ask the manager of the sequencing machine to setup your first protocol.
Analyze sequencing results
This protocol shows how to analyze your results using SnapGene, but many other programs, including the Genomics Workbench Sequence Viewer, can also be used.
-
104
Export the .abi files from the sequencing machine and save the files in your experiment data folder.
-
105
Other information is available about the sequencing run, but the .abi files provide the chromatograms for assessing quality and aligning to your plasmid files.
-
106
Open the SnapGene file for your plasmid.
-
107
Click the alignment button.
-
108
Click “Align imported sequences”.
-
109
Locate your .abi chromatogram files.
-
110
First examine the “Map view” alignment to get an idea of where your sequencing results align relative to the whole plasmid.
-
111
Next click the “Sequence view” tab to see the DNA alignments.
***Critical step: Your sequence needs to be perfect. If your sequencing results show a substitution, insertion, or deletion, you need to pick a new bacterial colony from your agar plates and do another colony PCR, overnight bacterial culture, plasmid purification, and sequencing reaction.***
Note: The start and end of the chromatogram can be messy, so seek advice from more experienced colleagues to interpret the results from these regions if needed.
-
1
-
Transfect a eukaryotic cell line with the expression vector
Now that you have assembled and sequenced your plasmid expression vector, the plasmid DNA can be used to generate your POI. The Sleeping Beauty transposon system (learn more at https://blog.addgene.org/sleeping-beauty-awakens-for-genome-engineering) within the FAST protein vector should be effective in many different cell lines, but considerations should be made when selecting a cell line to make your protein. The all-in-one vector contains the transposon cassette (i.e., the POI to be expressed in the cell line) and the transposase (i.e., the enzyme that inserts the cargo into the genome of the cell), so you only need to transfect one plasmid rather than separate plasmids for the transposon and transposase. Once inside the cell, the cytomegalovirus promoter (CMV) will drive high expression of the transposase enzyme. The transposase enzyme then binds the inverted terminal repeats of the transposon cassette and cuts the cassette out of the plasmid. The remaining plasmid DNA is then degraded. The cassette is inserted between 'TA' dinucleotides in the host cell genome, so the insertion site could be almost anywhere, and multiple copies can be integrated into a single cell. Excess transposase should be degraded over time as part of the normal cell regulatory processes.
Cassettes that successfully integrate into the genome are permanently integrated. As the insertion site can be anywhere in the genome that contains a 'TA' dinucleotide, the insertion site could affect cell function. For example, if the cassette inserts into the coding region of a host cell gene that is critical for cell division, the host cell will no longer divide and should eventually die. Alternatively, the cassette could insert into an inactive region of the genome (e.g., highly methylated), which could lead to reduced expression of the POI. However, we have performed RNAseq on a few of our Sleeping Beauty cell lines, and the transcript for the GOI is generally among the most highly expressed transcripts in the cell (i.e., the cells are making a lot of this RNA).
We use CHO cells for making most of our secreted proteins. We also use CHO cells for initial testing of cell surface proteins because these cells are reported to not express Fc receptors, which could bind to FAST proteins with a Fc region and to secondary antibodies in downstream experiments. CHO cells are used to make most proteins for clinical use and yield protein glycosylation patterns similar to other mammalian cell lines ( Zerbino et al., 2018 ). A basic adherent CHO-K1 cell line can be used for all aspects of this protein production. We have switched to a suspension ExpiCHO cell line that can be grown at high density (5 x 10⁶ cells/ml) in protein-free media. We suggest starting with a low passage CHO-K1 cell line to keep things simple and cheap.
When you move into functional testing of your proteins you will likely want to use a cell line from your study species. We have made dozens of devil facial tumor cell lines using this system. We have also transfected human (e.g., HEK-293, K562) and dog (A-72, DH82) cell lines. A similar Sleeping Beauty system has been used to make chimeric antigen receptor T cells (CAR-T) for human clinical trials, so the system should work for immune cells, however we have not attempted this yet.
After a quick batch of protein, you can collect the culture supernatant for 3-7 days after transfection and use it to test your protein. A good yield of protein will require high transfection efficiency (i.e., at least half of the cells in the flask have the transposon cassette integrated into the genome). Your GOI and subsequent POI can be expressed directly from the plasmid if it fails to integrate into the genome. However, the non-integrated plasmid DNA will be degraded within a few days. We generally create stable cell lines instead of collecting protein from the initial transfection. Unless your transfection is 100% efficient, which is very unlikely, you will need to either sort your cells or use drug selection to make a stable cell line. Sorting cells based on the fluorescent protein expression is fast because the sort can be done the next day, but we have observed high cell death when we sort cells soon after the transfection. Thus, we add a high concentration of a selection drug (e.g., hygromycin) as soon as the fluorescent reporter is visible by microscopy or by taking an aliquot of your cells and running them through a flow cytometer. We have used hygromycin, geneticin (G418), blastomycin, and puromycin for selection. All of these selection drugs work, but we have found that the hygromycin selection is fast and complete. As many of these drugs kill cells by damaging DNA, expression of your drug resistance gene needs to be high to avoid unnecessary DNA damage. This is critical if you are making a cell line for functional testing.
We use polyethyleneimine (PEI) at a 3:1 ratio with DNA (3 μg PEI for each 1 μg DNA) for most of our transfections. It is among the cheapest of transfection reagents, can be freeze/thawed many times, and can be stored for long periods of time at -20 °C. Our transfection efficiency is generally 5-30%, which is considered low by some standards, but the rapid proliferation of the CHO cells allows us to develop a fully selected cell line within 5-10 days in most cases.
Prepare the PEI transfection reagent using the heat method (see manufacturer for alternatives)
Protocol from Polysciences Inc. (Protocols for product # 23966–linear polyethyleneimine 25,000)
-
1
Weigh 500 mg to 2 g of PEI powder.
-
2
Suspend PEI in beaker with 500 ml to 2 L of water (to final concentration of 1 mg/ml).
-
3
Cover top of container and heat to 80 °C and stir for three h, or until solution is mostly clear.
-
4
Cool the solution to room temperature.
-
5
Adjust the pH of the solution to 7.0.
-
6
Sterile filter through 0.22 µm membrane
-
7
Aliquot to desired volumes.
-
8
Store aliquots at -20 °C.
Transfection of mammalian cells
exp_ID_6: Transfection (experiments spreadsheet)
Note: If your plasmids do not contain a fluorescent reporter protein, then we suggest obtaining at least one verified plasmid that does contain a fluorescent reporter protein. This will allow for easy monitoring of the transfection efficiency and drug selection by microscopy or flow cytometry.
***Critical step: We strongly suggest making additional cell lines that express only the base vectors (pAF112, pAF123) that can be used as negative controls in downstream testing.***
Day 0: Thaw cells for transfection
-
9
Thaw at least 1 x 10⁶ CHO-K1 cells.
-
10
Add to T75 flask in cRF10.
-
11
Culture overnight and replace media with fresh cRF10.
Note: If the cells are approaching 80% confluence, then passage the cells to preserve log phase growth and cell viability.
Day 2: Aliquot cells into 6-well plates
-
12
Remove media from the cells.
-
13
Rinse with 5 ml of sterile room temperature PBS.
-
14
Remove PBS from the flask.
-
15
Add 4 ml of TrypLE (i.e., recombinant trypsin) to the flask to detach adherent cells.
-
16
Incubate at 37 °C for 3-5 min.
-
17
Examine the flask under a microscope. The cells should be floating or appear round at this point.
-
18
Gently tap the side of the flask to detach the remaining weakly adherent cells.
-
19
Add 8 ml of cRF10 to the flask.
-
20
Pipet the cells up-and-down 5x. Each time, expel the media towards the base of the flask (i.e., where the adherent cells were) to gently force the weakly adherent cells from the flask.
-
21
Transfer the cells to a 50 ml tube.
-
22
Spin at 200 × g for 3 min at room temperature.
-
23
Count the cells using a hemocytometer or automated counter.
Automated counters are acceptable for cell lines, but often not for primary tissues (e.g., blood cells).
-
24
Dilute the cells to 1 x 10⁵ cells/ml in cRF10.
-
25
Transfer 2.5 ml of cells (2.5 x 10⁵ cells) to each well in a 6-well plate.
-
26
Incubate overnight.
Day 3: Transfection
-
27
Examine the cells using a microscope. Cells should be 50-70% confluent prior to the transfection.
If the density is too low, then wait until the next day.
If the density is too high, then discard this plate and go back to day 2 to plate a new batch of cells.
-
28
Thaw plasmids and PEI transfection reagent on ice.
Note: Thaw the plasmids and PEI completely (i.e., no solids remain in the tubes).
-
29
Whilst thawing, label a microfuge tube for each plasmid.
-
30
Prepare a master mix of PEI in PBS at 60 μg/ml in a microfuge tube (or 15 ml tube for larger transfections).
Make 1.2x the total amount needed to ensure there is enough master mix. For example, if 10 plasmids are to be transfected, then 100 μl of PEI in PBS is needed for each plasmid to yield a total of 1.0 ml. Make 1.2 ml to ensure there is enough.
-
31
Add PBS to master mix tube.
-
32
Add PEI to master mix tube.
-
33
Mix by gently pipetting. Do not vortex.
-
34
Add 100 μl of PBS to a microfuge tubes for each plasmid.
-
35
Add 2.0 μg of plasmid DNA to the appropriate microfuge tube (e.g., 2 μg DNA per 100 μl PBS).
-
36
Mix by gently pipetting. Do not vortex.
-
37
Add 100 μl from the master mix (PEI in PBS) into the microfuge tubes that contain plasmid DNA. This should give 6 μg of PEI to achieve a 3:1 PEI:DNA ratio.
-
38
Mix by gently pipetting once. Do not vortex.
-
39
Incubate at room temperature for 15 min.
-
40
Aspirate the media on the CHO cells.
-
41
Gently replace media on CHO cells with 2 ml of fresh cRF10.
-
42
Add 200 μl from the DNA:PEI solutions dropwise to the appropriate wells.
-
43
Gently rock the plate back and forth to spread the PEI:DNA complex throughout the well.
Note: Do not swirl the plate.
-
44
Incubate the cells with transfection reagents in cRF10 for 3-24 h.
Day 4: Drug selection and monitoring
-
45
Replace the media with 2 ml of warm cRF10 the next morning. If toxicity is a problem, then change the media after 3-6 h.
-
46
Examine the cells using a fluorescent microscope or via flow cytometry to determine transfection efficiency.
If your plasmids do not contain a fluorescent reporter, then include a standard fluorescent protein vector (e.g., GFP) as a positive control to help monitor transfection success.
For flow cytometry, we often collect the floating cells and run through the flow cytometer. This will consist mainly of dead cells but should provide a yes/no answer as to whether the transfection was successful.
-
47
Add selection reagent (i.e., hygromycin at 800 μg/ml) as soon as the reporter is visible or after 24 h.
-
48
Monitor daily and record fluorescence and confluence.
Massive cell death should occur within 1-3 days if using a high dose of hygromycin. Remove the floating cells every other day and replace with fresh cRF10 with 800 μg/ml of hygromycin.
Small colonies of cells should start forming in 2-5 days.
Allow dividing colonies to reach at least 20 cells before using TrypLE to detach the cells.
-
49
When the cells are actively proliferating in high dose hygromycin, then passage the cells using TrypLE as described above in the Day 2 steps.
-
50
When all cells express the reporter protein (i.e., drug selection is complete), or when all cells appear healthy in the flask, then the hygromycin dose can be dropped to 100-200 μg/ml.
-
51
Expand the cells and freeze.
3-5 vials are enough unless you will be using these cells regularly.
-
For cells secreting recombinant proteins, we generally purify one large batch of proteins that lasts for several years.
Note: If your vector was used to make surface protein or other non-secreted protein, then you can skip the remainder of Part D. Make sure to freeze at least two vials of cells at a minimum of 1 x 10⁶ cells at -80 °C.
Days 10-18: Collect supernatant for testing
-
52
Passage cells to a low density (1 x 10⁵ cells/ml) in cRF5 in T75 flasks.
-
53
The selection drug can be omitted at this step as long as you have a frozen stock in the freezer.
We have maintained Sleeping Beauty-transfected cells without ongoing drug selection for 3 months and observed minimal decrease in the expression of target proteins.
-
54
Allow cells to proliferate to > 90% confluence.
-
55
Collect supernatant.
-
56
Centrifuge at > 3,000 × g for 15 min at 4 °C.
-
57
Collect the supernatant and use a 20 ml syringe with a 0.22 μm PVDF filter to remove cellular debris.
-
58
Store the supernatant at 4 °C and use within 28 days.
We have observed that some FAST proteins are still capable of binding their expected receptor after 2 months in supernatant at 4 °C. However, protein stability is variable, so it is best to test the protein immediately after collection of supernatant.
Adapt cells to protein-free media to produce high quantities of pure protein
-
59
Cells can be used from the steps above or thawed from a frozen vial.
-
60
Ensure the cells are fully-drug selected and cultured in cRF5.
Ongoing drug selection is optional at this point. We generally maintain a low concentration of drug (e.g., 100 μg/ml of hygromycin).
-
61
When cells are in log-phase proliferation and 30-50% confluence, remove half of the cRF5 from the flask and replace with warm CHO EX-CELL protein free media.
Any protein-free CHO cell specific media should work here, but we have had good results with CHO EX-CELL media. Note that this CHO EX-CELL media requires addition of 4x the amount of L-glutamine than for RPMI.
Alternatively, proteins can be purified from cRF5 supernatant. The HisTrap columns should purify only the His-tagged proteins, with minimal carryover of the FBS components (e.g., bovine serum albumin). Ensure the drug used for selection of the cell line (e.g., hygromycin) does not contain a His-tag.
-
62
Repeat Step D61 except replace all the media with CHO EX-CELL protein-free media.
There is often a decrease in cell viability at this stage. Ensure that you have a large batch of cells with greater than 90% viability to continue.
If you are using a suspension culture system, such as a spinner flask or propeller flask, then you will need to seed the cells at a high density (minimum of 5x10⁵ cells/mL).
-
63
Collect supernatant from this point forward.
Centrifuge supernatant and store at 4 °C as described above.
Filtration can be omitted here; the purified proteins will be filtered later.
-
64
Expand the cells into 3 x T175 flasks by seeding 5 x 10⁶ cells/flask with 30 ml of CHO EX-CELL media.
-
65
Allow the cells to proliferate to ~80% confluence.
***Critical step: Do not let the cells exceed 80% confluence, as they need to be rapidly proliferating at all times following transfer to protein-free media.***
-
66
Continue passaging cells until at least 200 ml of supernatant has been collected.
Note: Cell lines do not always adapt well to the protein-free media. If you have repeated problems expanding the cell line, then you might want to purify the proteins from cRF2.5 media instead of protein-free media.
-
67
Centrifuge all supernatant and store at 4 °C.
-
68
Purify protein within 24 h to minimize aberrant protein aggregation and degradation. Many proteins will be stable for longer periods of time, but the best practice is to purify the proteins soon after collection.
Protein purification
The six histidine residues (6xHis) included in the linker peptide between the POI and the fluorescent reporter in the FAST protein allows for easy purification of protein secreted from eukaryotic cells. The basic protocol is to centrifuge your supernatant to remove debris, then use a peristaltic pump to apply your supernatant to an affinity column. The 6xHis-tag binds to Ni2+ ions in the column, and the proteins are then eluted using high concentration of imidazole, which competes with the 6xHis for binding to Ni2+ ions.
Most medium and large institutions will likely have a protein purification system available. We suggest asking around to see what you can find. Otherwise, a basic peristaltic pump will suffice. Plastic tubing can be found a home improvement or home brewing shop. The connector parts for the purification should come with the protein columns that you purchase. Determine what speed on the pump is required for a flow rate of 1 ml/min. You can do this by placing the output tubing into a graduated cylinder and measuring how long it takes to run 10 ml of water through the column. Adjust the pump and repeat as many times as needed until you are confident that you have an accurate flow rate. Note that when the column is connected the flow rate can vary slightly. Also determine the volume of liquid that your tubing holds from intake to output. This helps with the elution step, so you don't collect unnecessary flow through into your protein collection tubes.
After you calibrate the flow rate to 1 mL/minute, then plug the pump into a simple electrical outlet timer, which will allow you to walk away while you run large supernatant volumes through the column.
The manufacturer's protocol for HisTrap excel columns is currently found here.
-
69
Prepare all necessary solutions listed in the Recipes spreadsheet.
5 M imidazole.
HisTrap excel equilibration buffer (20 mM sodium phosphate, 0.5 M NaCl, pH 7.4).
If several purifications are planned, then prepare a 10x HisTrap excel equilibration buffer. Otherwise prepare a 1x HisTrap excel equilibration buffer.
HisTrap excel wash buffer (20 mM sodium phosphate, 0.5 M NaCl, 10 mM imidazole, pH 7.4).
HisTrap elution buffer (20 mM sodium phosphate, 0.5 M NaCl, 0.5 M imidazole, pH 7.4).
-
70
Label 10 microfuge tubes to collect your eluted protein.
-
71
Combine all supernatants that contain the same protein (e.g., pAF176 supernatant).
If some supernatant aliquots are fresh and some are > 7 days old, then it might be better to purify only the fresh supernatant.
-
All supernatants should have been centrifuged at > 3,000 × g and 4 °C for 15 min before this step.
Note: The supernatants can be filtered through a 0.45 μm PVDF membrane to remove debris, but this is not necessary with the HisTrap excel purification columns that our team generally uses for 6xHis-tag purification.
-
72
Dilute your supernatant 1:1 (v/v) with equilibration buffer. The pH should now be ~7. If the pH is not between 6 and 8, then adjust with a weak acid or base.
-
73
Place the output tubing into a waste collection vessel.
-
74
If the tubing in the pump or your protein purification machine has not been used for several weeks or was not cleaned properly after its last use, then wash the tubing with 1 M NaOH. Set the pump to draw the NaOH solution into the tubing. After running enough NaOH solution into the tube to fill the tubing, you can stop the pump and let it soak for 1-24 h. Then empty the tube out and rinse with sterile water.
Note: Make sure all of the NaOH is removed from the tubing before using it for protein purification.
-
75
Fill the pump tubing with sterile ddH2O.
Note: Make sure the tubing intake is completely submerged in all solutions throughout this process; air bubbles in the tubing or column can ruin your purification and protein.
-
76
Remove the stopper plug from the top of your column.
-
77
Set the pump to run at a low flow rate (< 1 ml/min) and allow the ddH2O to drip onto the intake port on top of the column to force out the air. A small volume of the ddH2O should overflow the column as this helps to ensure there is no air in the intake port.
-
78
Stop the pump.
-
79
Twist the tubing connector into the column, making sure there is no air trapped in the column.
***Critical step: Ensure that no air bubbles enter the column.***
-
80
Remove the snap-off end of the column outlet.
-
81
Transfer the intake tubing into the equilibration buffer.
-
82
Equilibrate the column with 5 column volumes of equilibration buffer at 1 mL/minute.
-
83
Stop the pump.
Note: Be gentle with the tubing so that air does not enter the tubing during the transfer.
-
84
Submerge the intake tubing to the bottom of your sample vessel.
Note: If the sample is in a graduated cylinder (make sure it is clean), then you will know precisely your sample volume and can set the timer accordingly.
-
85
Transfer the output tubing into a clean "flow through" collection vessel. If for some reason your purification fails, then you can re-run the flow through to salvage the protein.
-
86
Set the timer to run ~80% of the sample volume through the column.
-
87
Start the pump.
-
88
Start the timer.
Make sure you monitor the tube during the transition from equilibration buffer to the sample. If you observe bubbles in the tubing, then disconnect the tubing from the column and allow the bubble to be forced out. Then re-connect the tubing and column using the "drop-to-drop" method described above.
Make sure to monitor the pump as the timer approaches its stopping point. If your flow rate was faster than expected, then you could end up sucking air into the column and ruining your protein.
-
89
Re-start the pump if you have sample left in your vessel and let it run until your sample is nearly gone. It is better to leave a few mL of your sample in the vessel than to try to get every drop and risk introducing air into the column.
-
90
Stop the pump.
-
91
Submerge the intake tubing into the wash buffer vessel.
-
92
Start the pump.
-
93
Run 20 column volumes of wash buffer through the column.
-
94
Stop the pump.
-
95
Submerge the intake tubing into the 0.5 M imidazole elution buffer.
-
96
Start the pump and run several mL into the flow through container.
Note: The volume to run into the flow through is determined by the volume that your tubing holds (i.e., a long tube needs more solution to flow through it to clear the tube).
-
97
Transfer the output tubing into your first protein collection microtube and collect ~1 ml.
-
98
Repeat this until you have collected at least 10 ml and are confident that all of your protein has been eluted.
-
99
Check the protein collection tubes.
Note: If you are purifying a FAST protein, then you simply place your tubes on a blue light and see if they fluoresce (Figure 19).
-
100
Check the protein concentration using a spectrophotometer that can be used with small volumes (e.g., 1 μl on a NanoDrop spectrophotometer).
-
101
Set the extinction coefficients on the machine to match the extinction coefficients calculated in Procedure A, Step 9b and use the absorbance at the 280 nm setting on the NanoDrop spectrophotometer.
-
102
Blank the spectrophotometer using elution buffer.
-
103
Measure and record the protein concentration in each of your protein collection tubes. Also record the absorbance at 280 nm and the ratio of absorbances at 260 and 280 nm. These should give an indication of the purity of your protein.
-
104
Store the tubes on ice while you wash your column and the tubing.
-
105
Submerge the intake tubing in equilibration buffer.
-
106
Start the pump.
-
107
Run 10 column volumes through the column.
-
108
Stop the pump.
-
109
Submerge the intake tubing in 20% ethanol.
-
110
Start the pump.
-
111
Run 10 column volumes through the column.
-
112
Stop the pump.
-
113
Twist the column outlet cover (should come with your column) onto the outlet port of the column.
-
114
Twist the connector out of your column.
-
115
Place a few drops of 20% ethanol into the intake port on the column to make sure there is no air in the column.
-
116
Twist the original stopper plug back into the column.
-
117
Store the column in a 15 ml tube contain 20% ethanol. Columns can be stored for several months (potentially years) until you need to re-use it.
It is best to use a different column for each different protein, but with proper elution and washing of the columns you should be able to use the same column for different proteins if you are on a limited budget. Re-using a column for a different protein should be reported in experimental methods.
-
118
At this point your tubing should be clean. You can connect the intake tubing to the output tubing to create a circular system. If you are confident that your tubing will not leak, then you can store it with ethanol inside for a day or two or rinse with water for long term storage.
Protein dialysis
-
119
Prepare 3 L of autoclaved PBS.
-
120
Store the PBS on ice or at 4 °C until the PBS is cold.
-
121
Wet your dialysis cassettes with cold, sterile PBS.
-
122
Transfer your PBS to a clean 1 L beaker.
-
123
Drop a sterile magnetic stir bar into your PBS cover with aluminum foil and store the beaker on ice or at 4 °C.
-
124
Combine the solutions from your protein collection tubes that contain a reasonable yield of your POI. Basically, if there is no protein in some of the tubes, then you don't need them.
-
125
Transfer your combined protein solution into the dialysis cassette.
-
126
Float the cassette in the cold PBS.
-
127
Place the container on a magnetic stirrer in a refrigerator or cold room.
-
128
Set the magnetic stirrer to a low rpm, just enough so that the PBS is clearly moving in a circular motion around the container.
-
129
Stir for at least one hour; overnight is OK as long as the temperature is 4 °C.
-
130
Transfer the cassette to a new beaker with fresh, cold PBS.
-
131
Stir again for at least one hour.
Protein filtration and aliquoting
***Critical step: Perform these steps in sterile laminar flow biosafety cabinet (BSC). The centrifugation steps will take place outside the laminar flow BSC, but the tubes should always remain closed when outside of the BSC.***
-
132
Place a sterile 50 ml collection tube in a sturdy rack in the BSC.
-
133
Remove the plunger from a 20 ml syringe in the BSC.
-
134
Connect a 0.22 μm PVDF filter to a 20 ml syringe filter.
Note: Be careful not to touch the outlet of the filter, as the bottom half of the filter needs to remain sterile.
-
135
Add ~5 ml of cold, sterile PBS into the syringe to pre-wet the filter.
-
136
Pipet your dialyzed protein into the PBS within the syringe.
-
137
Place the plunger back into the syringe and gently expel the solution through the filter into the 50 ml collection tube.
Note: Some residual liquid will be retained in the filter, resulting in reduced protein recovery. Flushing the filter with additional PBS can reduce protein loss.
-
138
Transfer the sterile protein solution into a protein spin filter unit (e.g., Amicon ultra).
We generally use an Amicon Ultra centrifugal filter units, Ultra-15, MWCO 10 kDa. Most fluorescent proteins are > 20 kDa and our POIs are also generally > 20 kDa, so a large cut-off weight is acceptable without a risk of losing the purified protein. However, our proteins are produced in cell culture using protein free media, and His-tag purified, so using a 10 kDa cut off should result in minimal protein loss and > 90% pure protein.
-
139
Add cold, sterile PBS to fill the spin filter to full capacity (15 ml).
-
140
Centrifuge the unit according to the manufacturer's instructions.
Ensure the solution remains cold at all times.
30 min at 3,000 × g should result in concentration of the solution from a ~15 ml volume to < 3 ml.
-
141
Top up to 15 ml again with cold, sterile PBS for a second wash.
-
142
Centrifuge for 30 min at 3,000 × g.
-
143
Place the unit back into the sterile BSC.
-
144
Highly concentrated FAST proteins should be visible even with only visible light excitation at this step (Figure 20).
-
145
Transfer the concentrated protein to a microfuge tube placed on ice.
-
146
Measure the protein concentration as described above in Procedure D–Protein Purification.
Blank with cold PBS this time instead of elution buffer.
Enter the exact extinction coefficients determined in Section A, step 9b into the spectrophotometer.
Record absorbance ratios.
-
147
If the concentration is too low, centrifuge the filter unit again to achieve a smaller volume. Then take another aliquot and measure.
-
148
Repeat until the protein concentration is at least 0.5 mg/ml.
Concentration should be in the 0.5 mg/ml to 2.0 mg/ml range to ensure the spectrophotometer is accurate.
-
149
Optional step: Dilute your protein to 1 mg/ml or 0.5 mg/ml with cold, sterile PBS. This makes for easy calculations for downstream experiments.
-
150
Aliquot your protein into sterile 1.5 ml snap cap microfuge tubes and store on ice.
10 μl/tube is ideal, as you can thaw a fresh batch each time you need the protein.
If storage space in -80 °C freezer is limited, then you can aliquot 50-100 μl/tube.
-
151
Label your tubes with the protein name, date, and concentration.
-
152
Freeze at -80 °C until needed.
If you will use the protein within the next week, you can store an aliquot at 4 °C.
Most of our proteins seems to tolerate a few freeze/thaw cycles, but it is best to thaw only once and use the entire aliquot.
-
1
-
Test the recombinant protein
There are many ways to test your protein. SDS-PAGE and western blots can be used to confirm protein size and epitopes and detailed protocols are available elsewhere (Consortium, 2018). However, if the ultimate goal is to determine receptor-ligand interactions and the protein has been well-studied in other species, then proceeding directly production of a cell line that expresses the receptor to test binding via flow cytometry can be the most efficient approach. This is the approach we will describe here in Procedure E.
If your protein is likely to have a functional effect on certain cell types, then functional testing is also a good option. For example, if you made a recombinant interferon-gamma cytokine, then you could treat primary cells or cell lines from your species of interest with a range of doses and assess MHC-I and PD-L1 upregulation via qPCR. This should give you an answer within one week on whether or not your protein is functional. Additionally, check the products available from commercial suppliers of human and mouse recombinant proteins. In many cases you can attempt to replicate their validation methods for your species.
If you made an expression vector for the receptor (e.g., CD200R1) for your soluble POI (e.g., CD200), then proceed with Procedure E. If you have not made a cell line with you target receptor yet, then repeat Procedures A-D, with the exception that when you design your insert you will need to keep the TMD and ICD of your target receptor GOI/POI.
Flow cytometry to test receptor-ligand interaction
exp_ID_7: Flow_Cytometry (experiments spreadsheet)
Purpose:
To test the binding of FAST proteins to cell lines transfected with receptors expected to bind to the POI (e.g., CD200-mOrange or CD200-mTagBFP bind to CHO.CD200 cell lines).
Overview:
A single-step assay that adds FAST proteins to live target cells. The soluble protein can bind the surface receptor and remain on the surface of the cell or enter the cell via receptor-mediated endocytosis. Lysosomal degradation of the captured protein is blocked via the use of chloroquine or ammonium chloride, which allows fluorescent signal to accumulate over time and yield a stronger signal. The cells are washed a single time prior to analysis via flow cytometry.
Note: If you only have a single FAST protein (e.g., CD200-mOrange), then you won't have a proper negative control (e.g., mOrange only). However, by testing the single FAST protein against several cell lines you can determine if your protein binds specifically to the expected cell line. For example, test the CD200 FAST protein against wild type (CHO), vector only (CHO.pAF112), CD200R1 (CHO.pNP1), and PDL1 (CHO.pAF146) cell lines. If the CD200 FAST protein binds only to CHO.pNP1, then a strong inference can be made that the expected protein interaction occurs.
Thaw your original CHO cell line that secreted the FAST proteins for each color used. These can be used as single-color positive controls for setting up the flow cytometer. These can be thawed the day before the assay in cRF10 and used the next day.
In this assay we will prepare a "quick load" plate that contains the FAST proteins at their final staining concentration. This allows the use of a multichannel pipet for quick transfer of the treatment to the target cells and reduces variation in staining time.
See "exp_ID_FlowCytometry" for fillable Plate layout
Materials and reagents needed for Procedure E:
T75 sterile tissue-culture treated cell culture flask with vented cap–1 for each cell line used
1x U-bottom 96-well plate (sterile with lid)
1x U-bottom 96-well plate (sterile with lid) for aliquoting treatments for rapid loading of warm treatments (i.e., this is the "quick load" plate)
Sterile microfuge tubes–1 for each FAST protein used
Sterile 50 ml tubes–2 for each cell line
Sterile 5 ml tubes–1 for each cell line used
Automatic pipettor and 10 ml sterile pipets
Pipets and sterile pipet tips (10 μl, 100 or 200 μl, and 1,000 μl)
Flow cytometer that can detect mTagBFP, mCitrine, and mCherry
Centrifuge
Incubator at 37 °C with 5% CO2
Laminar flow biosafety cabinet (i.e., sterile hood to work in)
70% ethanol
Bleach
Warm TrypLE
Warm cRF5 or cRF10 (> 300 ml); use cRF5 for CHO cells, cRF10 for most other cell lines
Hygromycin 200 μg/mL (H200) in cRF5. Hygromycin stock generally is at ~50 mg/ml
0.1 M chloroquine. Ammonium chloride can be used instead of chloroquine and won't require purchasing new reagents for most labs, but we generally use chloroquine
FAST proteins (___ μg–depends on number of cell lines used) *Thaw fresh batch if needed*.
Cold FACS buffer (without EDTA–we haven't tested if EDTA affects FAST protein binding to cell lines). A healthy CHO cell line does not clump, so no need for EDTA
-
Warm cRF5 (~100 ml)
Thaw and culture cells prior to starting the experiment
Day 0: Thaw cells
-
1
Thaw target cells in cRF10.
Cell line target
CHO wild type
CHO.pAF123 vector control
CHO.pMK1 saha_CD200 (full-length surface protein)
CHO.pNP1 saha_CD200R1 (full-length surface protein)
Days 1-2: Passage cells
-
2
Replace media with cRF5. Cell confluence should be <80% on the day the assay begins. Passage cells as needed to ensure cells are in proliferation phase when assay begins.
Day 3: Binding assay
-
3
Warm TrypLE and cRF5 in a water bath.
-
4
Thaw the FAST proteins on ice.
-
5
See "exp_ID_Flow_Cytometry" Table 1–FAST protein dilutions for a fillable table.
Notes:
Protein binding kinetics are influenced by temperature, so it is important to maintain consistent temperatures across treatments.
Avoid using the outside wells on a plate for an assay in which temperature and moisture content are important. These wells heat the fastest and have the highest evaporation rate.
-
6
Transfer 5 ml of cRF5 to a 5 ml tube.
-
7
Add 5 μl of 100 mM chloroquine to achieve a 100 μM concentration of chloroquine in cRF5. Chloroquine is added to block acidification of the lysosome, which allows internalised fluorescent proteins to accumulate and yield a stronger signal ( Qureshi et al., 2011 ).
-
8
Transfer 1.4 ml of cRF5 with 100 μM chloroquine into microfuge tubes (1 for each FAST protein).
-
9
Transfer the appropriate volume of FAST protein into the microfuge tube.
-
10
Aliquot 110 μl of diluted FAST proteins into the appropriate wells of a U-bottom 96-well plate.
-
11
Aliquot 110 μl of PBS into all other wells. This is performed to maintain humidity and temperature in wells without cells.
Note: You will transfer 100 μl from this plate to the assay plate below.
-
12
Store the quick load plate at 37 °C with the lid on until needed (no more than an hour or two).
Preparation of adherent target cell lines
-
13
Decant media from target cells in T75 flasks into a waste reservoir containing bleach.
Notes:
Final concentration of bleach in the reservoir at the end of the experiment should be > 10%.
If using a different target cell line that is not adherent (i.e., suspension cells), then TrypLE is not needed and cells can be transferred directly to a 50 ml tube and centrifuged.
-
14
Transfer 5 ml of room temperature PBS into the flask.
-
15
Gently rock the flask back-and-forth to rinse the cells.
-
16
Decant the PBS from the flask into the waste reservoir.
-
17
Add 3 ml of warm TrypLE to each flask.
-
18
Incubate for 5 min at 37 °C.
-
19
Add 7 ml of warm cRF5 to each T75 flask.
-
20
Use a 10 ml pipet to aspirate and gently expel the media against the base of the flask (i.e., where some cells might still be adherent).
-
21
Use a 10 ml pipet to transfer the cells to the appropriate 50 ml tube.
-
22
Centrifuge at 200 × g for 4 min.
-
23
Decant the media into the waste reservoir.
-
24
Resuspend the cells in 2 ml of warm cRF5 (Without chloroquine for this step).
-
25
Count the cells using an automated cell counter or a hemocytometer.
Notes:
See " exp_ID_7: Flow_Cytometry " Table Cell Counts for fillable table.
See plate layout above.
25,000-100,000 of each cell line per well is acceptable as long it is consistent across cell lines.
-
26
Transfer the appropriate volume of cell stock into a new 50 ml tube (i.e., volume to reach 1 x 10⁶ cells).
-
27
Top up the tube to 10 ml with cRF5.
-
28
Spin at 200 × g for 4 min.
-
29
Whilst spinning, aliquot 1 x 10⁵ to 1 x 10⁶ cells back into original flask for future experiments if needed.
-
30
Add cRF5 with H200 to reach 5 ml in a T25 flask, or 12 mL in T75 flask.
Quickly load the assay plates
-
31
Retrieve the 50 ml tubes from the centrifuge and remove the supernatant (always check for a pellet before removing supernatant).
-
32
Transfer 1 ml of cRF5 + chloroquine into the tube and pipet 5x to resuspend 1 x 10⁶ cells/ml.
-
33
Quickly transfer 100 μl of cells from the appropriate tube to the appropriate wells (see plate layout above).
-
34
Quickly examine the cells using a microscope to ensure they are round and healthy.
Note: It is difficult to focus the lens on U-bottom plates, but focusing on the very bottom of the well allows visualization of the cells well enough to confirm they are present.
-
35
Remove the quick load plate from 37 °C only when you are ready to load.
-
36
Use a multichannel pipet to quickly transfer 100 μl from the quick load plate containing the FAST proteins to the assay plate containing the cells.
Note: Use the multichannel pipet to gently mix the cells 5x. Discard the pipet tips and get new tips for each transfer.
-
37
Incubate at 37 °C for 1 to 3 h.
Prepare the assay plates for flow cytometry analysis
-
38
Spin the plates at 500 × g for 3 min.
-
39
Remove the lid of the plate, turn it upside down and dump out the media.
Note: If you do not have experience doing this, fill a test plate with water and practice before using the real cells. Surface tension holds the liquid in plate when the plate is inverted. To dump the media, use a rapid downward movement and then stop the motion smoothly without jerking the plate back up.
-
40
Add 100 μl of warm TrypLE to each well that contains cells.
-
41
Incubate at 37 °C for 5 min.
-
42
Examine the cells using a microscope to ensure the cells are no longer adherent to the plate.
-
43
Add 100 μl of cold FACS buffer (with NaN3).
-
44
Pipet cells up-and-down 5x to create a single-cell suspension.
-
45
Spin the plates at 500 × g for 3 min at 4 °C.
-
46
Remove the lid of the plate, turn it upside down and dump out the media.
-
47
Pipet cells up-and-down 5x in 200 μL FACS fix using a multichannel pipet.
-
48
Incubate at 4 °C for at least 15 min.
Notes:
Storing the plate on a rocking platform during this step is helpful but not necessary.
For FAST proteins with predicted low affinity, it might be best to run the cells directly in the FACS buffer.
-
49
Spin at 500 × g for 3 min.
-
50
Resuspend in 250 μl FACS buffer and transfer to FACS tubes.
Note: If your flow cytometer has a plate loader, you can run the cells directly from the plate. However, if this is the first time trying the assay it might be best to run the cells from tubes instead of plates.
-
51
Store at 4 °C until flow cytometry analysis.
Flow cytometry
Note: If this is your first time doing flow cytometry, then you will need to find a colleague with experience to help you on this assay. Do not be shy about reaching across disciplines, this could be a good opportunity for collaboration.
-
52
Decant media from your single-color positive control cell lines (e.g., cells that secreted your FAST proteins–CHO.pAF176).
-
53
Transfer 5 ml of room temperature PBS into the flask.
-
54
Gently rock the flask back-and-forth to rinse the cells.
-
55
Decant the PBS from the flask into the waste reservoir.
-
56
Add 3 ml of warm TrypLE to each flask.
-
57
Incubate for 5 min at 37 °C.
-
58
Examine the cells using a microscope to ensure they look round and not adherent. If the cells look round but are still adherent, give the flask a gentle tap to dislodge the cells from the flask.
-
59
Add 7 ml of cold FACS buffer to the flask.
-
60
Use a 10 ml pipet to mix up and down and gently expel the media against the base of the flask (i.e., where some cells might still be adhering to the flask).
-
61
Centrifuge at 500 × g for 3 min at 4 °C.
-
62
Thoroughly resuspend the cells in flow cytometry fixation buffer.
-
63
Store at 4 °C in the dark (i.e., wrapped in aluminum foil) until needed.
Note: Fixed cells can be stored for months and reused as controls for setting up the flow cytometer.
-
64
Activate the lasers and filters on your flow cytometer to match your fluorescent proteins. If you do not have experience with flow cytometry, then please consult with the flow cytometry facility manager.
-
65
Create plots for analyzing your samples.
Forward Scatter-Height against Side Scatter-Height (use to identify target cell population - i.e., live cells).
Forward Scatter-Area against Forward Scatter-Height (use to exclude doublets).
BFP-Height against mOrange-Height.
Note: You can also create a histogram for each color.
-
66
Run your first sample using the default settings on the flow cytometer (based on daily quality control testing).
-
67
Identify your target population using the Forward Scatter (size) and Side Scatter (granularity) properties.
-
68
Draw a gate around your target population.
-
69
Identify single cells using the Forward Scatter-Area against Forward Scatter-Height plot.
-
70
Draw a gate around the single cell population.
-
71
Add a quadrant gate to each of the multicolor plots. These gates can be adjusted as needed based on the fluorescent output of your single-color controls.
-
72
Run your single-color controls and adjust voltage and compensation as needed. This requires an experienced flow cytometry user.
-
73
Adjust gates as needed.
Note: If analyzing unfixed cells, it is important to use unfixed single-color controls as fixation may alter the background fluorescence of cells.
-
74
After setting voltages and gates, run the samples and record at least 10,000 events.
-
75
Analyze the data using the software available at your institution (e.g., FCS Express, FlowJo).
-
1
Figure 2. Transcript file export from NCBI GenBank.
Figure 3. CD200 Phobius protein analysis of devil CD200.
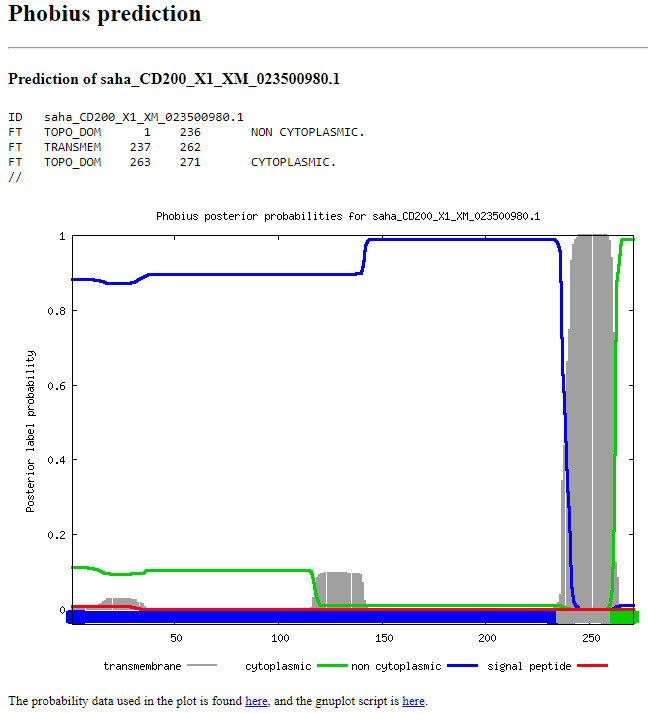
Analysis of Tasmanian devil CD200 using Phobius algorithm to identify the signal peptide, and extracellular domain, transmembrane and intracellular domains, and ICD (aka cytoplasmic). CD200 is predicted to have a weak signal peptide (aka SigP). The TMHMM server can be used for additional analyses, but usually yields results similar to Phobius.
Figure 4. CD200 SignalP 5.0 protein analysis of devil CD200.
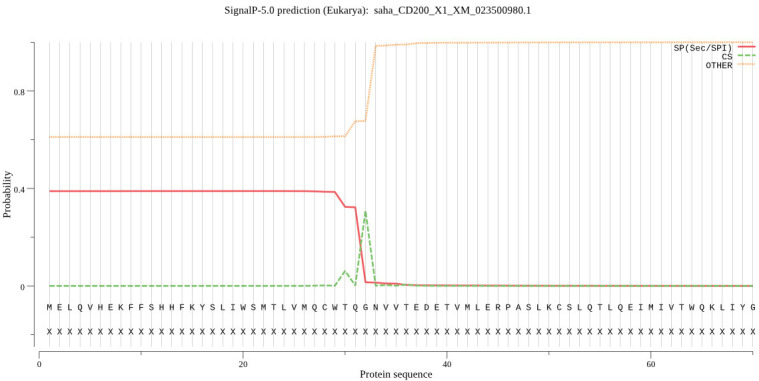
Analysis of Tasmanian devil CD200 using the SignalP 5.0 algorithm to determine the probability of having a signal peptide. The output suggests that the CD200 SigP has a 40% chance of leading to a secreted protein. We used this native CD200 SigP for a CD200-mTagBFP and CD200-mOrange FAST proteins and we recovered an adequate yield of these proteins in supernatant, suggesting the CD200 SigP is sufficient for FAST protein secretion.
Figure 5. Assigning the CD200 signal peptide.
Highlight the SigP sequence identified by SignalP and then choose Feature → Add Feature. When the dialog box opens paste in the name with the sequence reference number and the suffix SigP (e.g., saha_CD200_X1_ XM_023500980.1_SigP). Change the "type" to sig_peptide.
Figure 6. Assigning CD200 functional domains.
From the "Sequence" view of the CD200 annotation in SnapGene. To annotate the CD200 sequence, highlight the ECD sequence identified by Phobius and then choose Feature → Add Feature. When the dialog box opens paste in the name with the sequence reference number and the suffix ECD (e.g., saha_CD200_X1_ XM_023500980.1_ECD). Tick the box for "Translate this feature in sequence view". Repeat this process for the TMD and ICD. You can also add features for the 5' untranslated region (5' UTR) and 3' untranslated region (3' UTR).
Figure 7. Final devil CD200 annotation domains.
Linear "map" view of CD200 annotation in SnapGene. Map view of the Tasmanian devil CD200 transcript, including the 5’ and 3’ UTR, and the predicted SigP, ECD, TMD, and ICD.
Figure 8. Multispecies protein alignment of CD200.
The black bar graphs below the alignment represent the percent conservation of amino acids across eight species. The RasMol coloring scheme is used to highlight traditional amino acid properties (e.g., green = aliphatic amino acids leucine, isoleucine valine), which aids in interpretation of amino differences across species.
Figure 9. Selection of the GOI feature to be replaced by a new GOI.
Map view of the plasmid file and GOI region to be replaced by a new GOI.
Figure 10. Sequence view of the GOI region to be replaced by a new GOI.
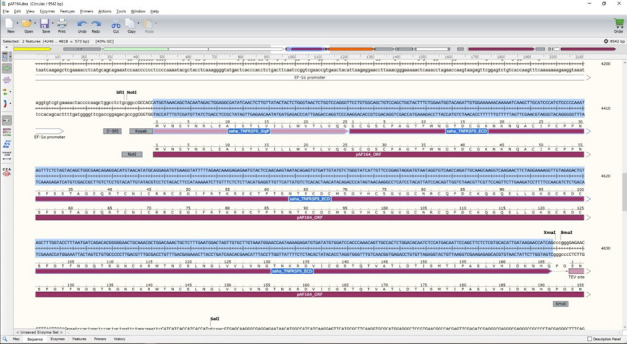
Figure 11. SigP-ECD of the POI.
Map view of the DNA file for the GOI to be inserted into the expression vector. Make sure to select the SigP + ECD. If you GOI does not have a SigP, then you might consider using the SigP from a different gene. We usually use the hamster IL-2 SigP because it works well in the CHO cells that we use for producing soluble proteins.
Figure 12. New CD200 expression vector (pAF176).
The POI is highlighted in blue. Note that the stop codon at the 3'-end of the fluorescent protein should be the only in-frame stop codon in the entire ORF (5'-end SigP to the 3'-end of mOrange).
Figure 13. Update ORF to match the ATG start codon for the newly inserted gene.
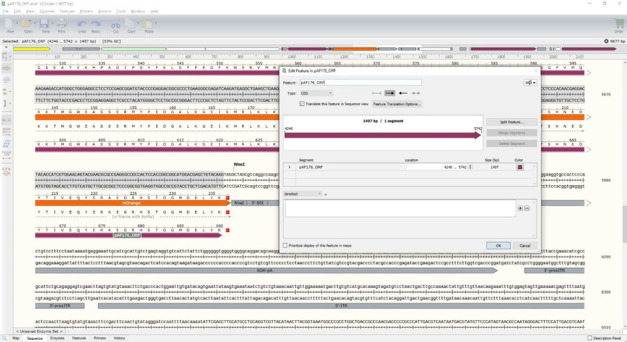
Figure 14. N-terminus of the new ORF.
If you are using Tasmanian devil CD200, then make sure that the N-terminus matches the MELQV amino acid sequence shown here. If you have inserted a different gene, the sequence will be different, but the start location should be the same (position 4246 if you have “Set origin” correctly in Step B2b).
Figure 15. Gibson assembly primers.
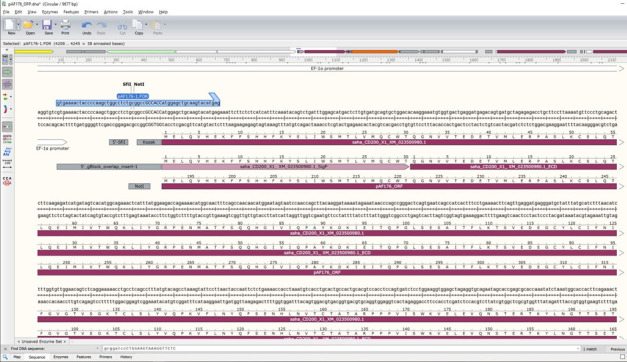
Forward primer for amplifying GOI, flanking the region and providing sequence overlap with the vector backbone.
Figure 16. Overlap extension PCR to add the 5’ and 3’ overlaps onto the GOI for assembly into the expression vector.
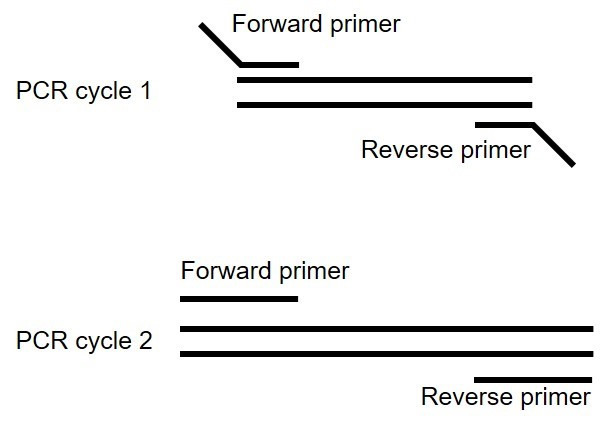
Figure 17. Image of digested and undigested plasmid DNA migration in agarose gel electrophoresis.
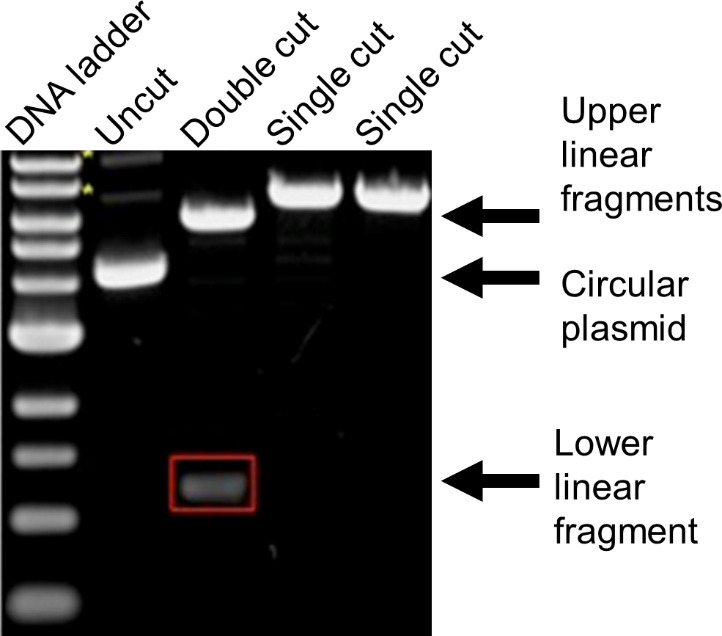
Lane 1 shows the DNA ladder and lane 2 shows the plasmid in its native state (i.e., no restriction digest). Lane 3 shows a plasmid that has been digested with two different restriction enzymes. When each enzyme cuts only one site in the plasmid, this results in two fragments. The upper band needs to be excised and purified and then used to assemble your new plasmid. The lower band is the fragment that needed to be removed from your plasmid prior to assembly. Lanes 4 and 5 show plasmids that have been digested with a single restriction enzyme. Note that circular DNA (lane 2) travels through the agarose gel faster than linear DNA (lanes 4 and 5) even when they are equivalent size. Image adapted from Addgene (https://blog.addgene.org/plasmids-101-how-to-verify-your-plasmid).
Figure 18. Example of a colony PCR agarose gel electrophoresis.
The three strong bands indicated match the expected size of a plasmid that contains the desired insert. Select 5 of the bacterial colonies that match these results and culture them overnight (not more than 16 h) in 5 ml of LB media with ampicillin at 37 °C and shaking at 200 rpm.
Figure 19. Image of FAST protein elution tubes.

The first few tubes will likely contain only a low concentration of protein, the middle tubes should contain the bulk of the protein, and the last tubes should contain little or no protein. This indicates that the fluorescent fusion protein has been eluted from the column and shows that the fluorescent protein is properly folded.
Figure 20. Concentrated FAST proteins.
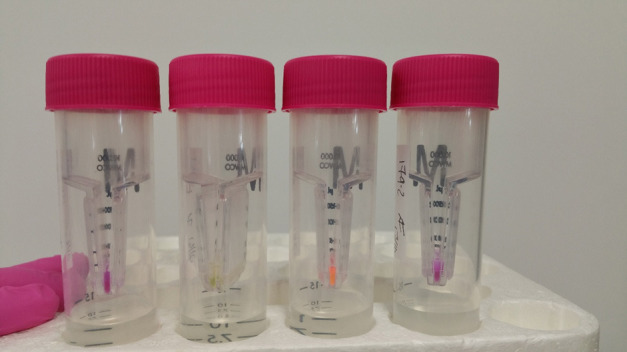
Image of FAST proteins in centrifugal concentration tubes. Highly concentrated FAST proteins can be seen even using visible light. From left to right are mCherry, mCitrine, mOrange, and mCherry.
Notes
Procedure A: Troubleshooting
| Step | Problem | Possible solution(s) |
| 3 | Cannot find your GOI in any databases |
The GOI might not exist in your species. We suggest trying this process with a known gene before trying to discover a completely new gene. Prepare a de novo transcriptome assembly and BLAST the de novo assembly with the GOI sequence from the most closely related species that you can find. |
| 4 | Numerous isoforms of GOI | Compare coding regions and functional domains for the optimal transcript. If needed, compare to orthologs and homologs to identify a master transcript. |
| 4 | Conflicting transcripts of GOI | Identify changes to DNA/protein sequence and implications for final protein. Compare to orthologs and homologs. |
| 7 | No start or end signal in GOI transcript | Use the partial sequence to identify full-length sequences from an alternate database. Investigate de novo transcriptome if possible. |
| 9 | Limited information available or retrievable for GOI annotation | Identify potential functional domains by comparison to orthologs or homologs. |
| 9 | No SigP for GOI transcript | Use the partial sequence to identify full-length sequences from an alternate database. Investigate transcriptome if possible. Alternately, use native SigP from other similar, well-expressed protein. |
| 17-22 | Limited or no conservation of functional domains between GOI and orthologs/homologs | Investigate other potential transcripts, using ortholog and homolog queries. If none other recovered, the transcript may still be of relevance, if not functionally equivalent. |
Procedure B: Troubleshooting
| Step | Problem | Possible solution(s) |
| 7 | No SigP in GOI transcript | Use the hamster IL2 SigP as described in step 7. See vector pAF92 for additional details (https://www.addgene.org/135929/). |
| 13 | GOI segments not in optimal GC% range | Order more than one possible primer to find a combination that can amplify the target sequence with the necessary vector overlap segments. |
Procedure C: Troubleshooting
| Step | Problem | Possible solution(s) |
| PCR and gel | No PCR product | See general PCR troubleshooting guidelines elsewhere. |
| DNA extraction from gel (PCR or plasmid digest) | Insufficient PCR product yield or plasmid DNA used in restriction digest. | Re-run the PCR or restriction digest. If the yield is low again, then use the low yield DNA in the assembly as long as the band size in the gel was correct. |
| Assembly and transformation | Too many colonies |
Perform new overnight restriction digest Split bacteria in half or thirds Plate less bacteria Check ampicillin concentration (check the date plates were made) Incubation on orbital shaker following the head shock step was too long. One hour of incubation is sufficient. If the incubation time is extended, then the bacteria can enter exponential growth phase and result in vast expansion of positive clones. |
| Assembly and transformation | No colonies or negative for insert |
Poor restriction digest. Check enzymes, reaction conditions, methylation of the restriction enzyme site. Overlaps in the insert may be not long enough or poorly designed. Homemade competent bacteria may be of poor quality, purchase competent cells from a supplier (e.g., NEBuilder kit comes with pre-aliquoted DH5α). If a UV light source was used to visualize DNA in gel, then care should be taken to limit DNA exposure to UV light as this can damage DNA and be a considerable source of downstream cloning problems. Use a sterile razor blade or plastic cutting instrument to cut around the target DNA band. Make sure not to cut directly on the glass of your UV/blue light as this can damage the glass. Use a new blade for each band to prevent carry over of DNA between samples. |
| Overnight culture of bacteria. | Bacterial culture fails to expand | Make sure the correct antibiotic and dosage was used. |
| Analyzing your sequencing results. | Sequencing results are not clean |
Residual ethanol on the DNA. Repeat the sequencing protocol and allow more time for your DNA to dry when trying to remove the ethanol. Single-primer sequencing PCR failed. Try using the paired sequencing primers on the plasmid with a 'normal' polymerase (e.g., OneTaq) to make sure the reaction works at 55 °C. Ask the manager of the sequencing facility for insight. |
Procedure D: Troubleshooting
| Step | Problem | Possible solution(s) |
| Transfection | No reporter proteins evident or cells did not survive drug selection |
Human error is the most common problem. Specifically, pipetting of the plasmid DNA. Use fresh media and a new batch of PEI. Cells density was too high. |
| Transfection | No survival after transfection or selection |
Drug dose was too high. Human error is the most common problem. Specifically, pipetting of the plasmid DNA. |
| Transfection | Populations not expanding after > 7 days drug selection. |
Drug dose was too high. Increase percentage of FBS in the media to 15-20%. |
| Protein expression | Selected cell populations not expressing desired protein. |
If neither the reporter or POI are expressed, then check the expression vector construct to ensure the ORF does not have an early stop codon. Also confirm the expression vector sequencing was accurate and perfect. Some proteins will fail for unknown reasons. For well-characterized proteins such as IFN-γ, we expect this system to work > 95% of the time. For POIs that have not been produced recombinantly in mammalian cells, the failure rate is likely to be 10-20%. |
| Protein purification. | Low protein expressed/collected/purified. |
Cells were not rapidly dividing in culture. Protein was degraded quickly in the supernatant. |
Procedure E: Troubleshooting
| Step | Problem | Possible solution(s) |
| No signal | FAST protein degraded |
Chloroquine or ammonium chloride not added. Receptor-mediated endocytosis can activate proteasomal degradation. Try proteasome blocker if the literature suggests this pathway is active. |
Recipes
See associated Recipes spreadsheet, which includes calculations for adjusting volumes and concentrations.
Acknowledgments
We thank the co-authors of the manuscript associated with this protocol: Chrissie E.B. Ong, Alana De Luca, A. Bruce Lyons, Gregory M. Woods. We wish to thank Ginny Ralph for her ongoing care of Tasmanian devils, and the Bonorong Wildlife Sanctuary for providing access to Tasmanian devils, and Ruth Pye for providing care for devils and collecting blood samples. We would like to thank Mahalia Kingsley and Nirdesh Poudel for plasmid construction.
Funding: ARC DECRA grant # DE180100484, ARC Linkage grant # LP0989727, ARC Discovery grant # DP130100715, Morris Animal Foundation Grant-in-Aid # D14ZO-410, University of Tasmania Foundation Dr Eric Guiler Tasmanian Devil Research Grant through funds raised by the Save the Tasmanian Devil Appeal (2013, 2015, 2017 and 2018), and Entrepreneurs’ Programme - Research Connections grant with Nexvet Australia Pty. Ltd. # RC50680, Royal Hobart Hospital Research Foundation Incubator Grant # F0026331.
Competing interests
The authors received funding from Nexvet Australia Pty. Ltd for related studies.
Citation
Readers should cite both the Bio-protocol article and the original research article where this protocol was used.
Supplementary Data.
References
- 1. Benson D. A., Cavanaugh M., Clark K., Karsch-Mizrachi I., Lipman D. J., Ostell J. and Sayers E. W.(2013). GenBank. Nucleic Acids Res 41(Database issue): D36-D42. [DOI] [PMC free article] [PubMed] [Google Scholar]
- 2. Consortium T. U.(2018). UniProt: a worldwide hub of protein knowledge. Nucleic Acids Res 47(D1): D506-D515. [DOI] [PMC free article] [PubMed] [Google Scholar]
- 3. Flies A. S., Darby J. M., Lennard P. R., Murphy P. R., Ong C. E. B., Pinfold T. L., Lyons A. B., Woods G. M. and Patchett A. L.(2020). A novel system to map protein interactions reveals evolutionarily conserved immune evasion pathways on transmissible cancers. Science Advances. preprint available at bioRxiv: 831404. [DOI] [PMC free article] [PubMed] [Google Scholar]
- 4. Gibson D. G., Young L., Chuang R.-Y., Venter J. C., Hutchison C. A. and Smith H. O.(2009). Enzymatic assembly of DNA molecules up to several hundred kilobases. Nature Methods 6(5): 343-345. [DOI] [PubMed] [Google Scholar]
- 5. Kowarz E., Löscher D. and Marschalek R.(2015). Optimized Sleeping Beauty transposons rapidly generate stable transgenic cell lines. Biotechnol J 10(4): 647-653. [DOI] [PubMed] [Google Scholar]
- 6. Qureshi O. S., Zheng Y., Nakamura K., Attridge K., Manzotti C., Schmidt E. M., Baker J., Jeffery L. E., Kaur S., Briggs Z., Hou T. Z., Futter C. E., Anderson G., Walker L. S. and Sansom D. M.(2011). Trans-endocytosis of CD80 and CD86: a molecular basis for the cell-extrinsic function of CTLA-4. Science 332(6029): 600-603. [DOI] [PMC free article] [PubMed] [Google Scholar]
- 7. Zerbino D. R., Achuthan P., Akanni W., Amode M. R., Barrell D., Bhai J., Billis K., Cummins C., Gall A., Giron C. G., Gil L., Gordon L., Haggerty L., Haskell E., Hourlier T., Izuogu O. G., Janacek S. H., Juettemann T., To J. K., Laird M. R., Lavidas I., Liu Z., Loveland J. E., Maurel T., McLaren W., Moore B., Mudge J., Murphy D. N., Newman V., Nuhn M., Ogeh D., Ong C. K., Parker A., Patricio M., Riat H. S., Schuilenburg H., Sheppard D., Sparrow H., Taylor K., Thormann A., Vullo A., Walts B., Zadissa A., Frankish A., Hunt S. E., Kostadima M., Langridge N., Martin F. J., Muffato M., Perry E., Ruffier M., Staines D. M., Trevanion S. J., Aken B. L., Cunningham F., Yates A. and Flicek P.(2018). Ensembl 2018. Nucleic Acids Res 46(D1): D754-D761. [DOI] [PMC free article] [PubMed] [Google Scholar]
Associated Data
This section collects any data citations, data availability statements, or supplementary materials included in this article.


