

Abstract
Objective
We evaluated whether identification of undiagnosed HIV-infected people who inject drugs (PWID) via respondent-driven sampling (RDS) can be enhanced through a precision RDS (pRDS) approach.
Design/Methods
First, using prior RDS data from PWID in India, we built a prediction algorithm for recruiting undiagnosed HIV-infected PWID. pRDS was tested in Morinda, Punjab where participants were randomly assigned to standard or pRDS. In the standard RDS approach, all participants received 2 recruitment coupons. For pRDS, the algorithm determined an individual’s probability of recruiting an undiagnosed PWID, and individuals received either 2 (low probability) or 5 (high probability) coupons. Efficiency in identifying undiagnosed HIV-infected PWID for the RDS approaches was evaluated in two ways: the number needed to recruit (NNR) and identification rate/week.
Results
Predictors of recruiting undiagnosed PWID included HIV/HCV infection, network size, syringe services utilization, and injection environment. 1631 PWID were recruited in Morinda. From the standard RDS approach, 615 were recruited, including 39 undiagnosed; from pRDS, 1012 were recruited, including 77 undiagnosed. In pRDS, those with higher predicted probability were more likely to recruit others with HIV/HCV co-infection, undiagnosed and viremic HIV, and who utilized services. pRDS had a significantly higher identification rate of undiagnosed PWID (1.5/week) compared to the standard (0.8/week). The NNR for pRDS (13.1) was not significantly lower than the standard approach (15.8).
Conclusions
pRDS identified twice as many undiagnosed and viremic PWID significantly faster than the standard approach. Leveraging RDS or similar network-based strategies should be considered alongside other strategies to ensure meeting UNAIDS targets.
Keywords: respondent-driven sampling, network sampling, people who inject drugs, India, undiagnosed HIV
INTRODUCTION
Awareness of status is the first target in the UNAIDS 95-95-95 targets to end AIDS by 2030 – 95% of people living with HIV (PLWH) diagnosed2. Along with maximizing prevention efforts, identifying and treating a large majority of PLWH will avert new infections. This must occur in a human rights framework, including respecting the unique needs of key populations such as men who have sex with men (MSM) and people who inject drugs (PWID). For these populations, structural factors such as stigma, discrimination, and criminalization often make accessing HIV prevention and care difficult thus leading to large gaps in the care continuum - particularly at diagnosis3. Among PWID in India, a large community-based sample identified that only 40% of those HIV-infected were aware of their infection4.
Meeting the UNAIDS diagnosis target will require new approaches to reach those not currently engaged in HIV testing services. Respondent-driven sampling (RDS), a type of chain-referral sampling, is commonly used in public health for HIV surveillance and research among key populations for which a sampling frame does not exist5. Using recruitment coupons distributed to peers, RDS leverages social network connections to recruit study participants, rather than utilizing study staff to identify and recruit individuals. Sampling weights can be applied to provide unbiased population estimates such as HIV prevalence. Researchers have noted the potential of RDS to be used beyond surveillance to an implementation tool or intervention to quickly reach and engage individuals at high-risk for HIV6–9. In prior work, we found RDS rapidly identified PWID in India, including many that were HIV-infected but previously undiagnosed or viremic, in other words, individuals not engaged in traditional HIV services such as clinic-based HIV testing and care or outreach services10. This prior work focused on traditional RDS approaches that distribute the same number of coupons to everyone regardless of individual characteristics. The objective of this study is to evaluate whether the efficiency of identification of undiagnosed HIV-infected PWID in India can be further enhanced through an approach that steers the RDS by providing more coupons to those deemed more likely to recruit undiagnosed HIV-infected individuals – a precision RDS (pRDS) approach.
METHODS
Overview
The evaluation of the pRDS approach was conducted in Morinda, Punjab, in north India. To design pRDS, we first identified characteristics that predicted RDS recruitment of an undiagnosed HIV-infected PWID. Since there is significant regional variation in the HIV epidemic/continuum and drug use across India, previously collected RDS data from four cities in northern India were used to build a prediction algorithm. This algorithm then determined differential coupon distribution in the pRDS approach. Detailed methods are described below.
Predicting recruitment of undiagnosed HIV-infected PWID
Study design and procedures
To identify characteristics that predict recruitment of an undiagnosed HIV-infected PWID, data from the National Collaboration on AIDS (NCA) trial (ClinicalTrials.gov identifier: NCT01686750) were used. The NCA trial was a cluster-randomized trial among MSM and PWID in India investigating the effectiveness of integrated care centers on the uptake of HIV testing11. Population-level effectiveness was assessed using two community cross-sectional samples, baseline and endline, collected via RDS. Data used for this study were baseline data from four cities in northern India in the PWID stratum (Amritsar, Ludhiana, Chandigarh, and New Delhi).
Study participants were recruited using RDS between January and July 2013. Two seeds and all subsequent study participants received two recruitment coupons to distribute randomly to others they knew injected drugs in the community. Seeds were selected from focus groups and selected to represent varying geographic, HIV-related, and drug-related characteristics of the local populations. Seeds and all other study participants received 250 rupees for completing study procedures and 50 rupees for each eligible participant referred. Recruitment continued until the desired sample size in each city was met (~1000 recruits). Eligibility criteria included (1) ≥18 years old, (2) provision of informed consent, (3) possession of a valid coupon unless a seed, and (4) self-reported injection drug use in the prior 24 months. Details on study procedures have been published elsewhere12.
Statistical methods
Participants were categorized as undiagnosed if positive by the onsite HIV test and self-reported no prior diagnosis. Using the linkage between recruiters and their recruits, we determined whether each participant recruited at least one undiagnosed PWID. Recruitment predictors were identified using two methods: logistic regression models and a random forest. Characteristics investigated included HIV infection and others associated with HIV risk among PWID in the literature, including socio-demographics, HCV infection, sexual and injection drug use risk behaviors, and network size. In total, more than 50 characteristics were explored.
Univariable logistic regression models were conducted for each characteristic and area under the receiver operator curve (AUROC) calculated using a 10-fold cross-validation technique to address over fitting of the model13. Additionally, a classification random forest was built, which included 56 different characteristics and 500 trees. The best split at each node in the tree was determined by the Gini index. Variable importance was calculated for each characteristic using the permutation method14.
A multivariable prediction algorithm was built that included characteristics with an AUROC>0.5 from the univariable logistic regression or a VIMP>0 from the random forest. For the pRDS, a cut-point in predicted probability calculated from the prediction algorithm was required to divide the sample into two groups: 1) likely to recruit an undiagnosed HIV-infected PWID and 2) unlikely to recruit an undiagnosed PWID. Sensitivity and specificity of the probabilities were calculated to assess the ideal cut-point which was chosen so that sensitivity was optimized while ensuring specificity was at least 0.5.
Evaluating the precision RDS approach
Study design and procedures
To evaluate the pRDS approach, an RDS was conducted in Morinda, Punjab, where recruitment continued for a year, regardless of sample size accrued. In December 2017, two seeds initiated recruitment and each received two recruitment coupons to distribute randomly to others they knew who injected drugs in their community. Then beginning at the first wave of recruitment and beyond (i.e., recruits of the seeds, recruits of wave 1, etc.), individuals were randomized to one of two coupon approaches - standard or pRDS - in a 1:1 allocation (Figure 1) using a computer program with a randomization list and randomly varying block sizes (8, 10, 12, 14 and 16). In the standard approach, all PWID received two recruitment coupons. If randomized to pRDS, a program extracted an individual’s questionnaire responses and HIV/HCV test results and entered them into the prediction algorithm (i.e., the multivariable logistic regression model described above) and calculated their predicted probability of recruiting an undiagnosed PWID. If the predicted probability was below the pre-determined cut-point they received two coupons, and if greater than or equal to the cut-point, they received five coupons. RDS recruitment continued in this manner until December 2018.
Figure 1.
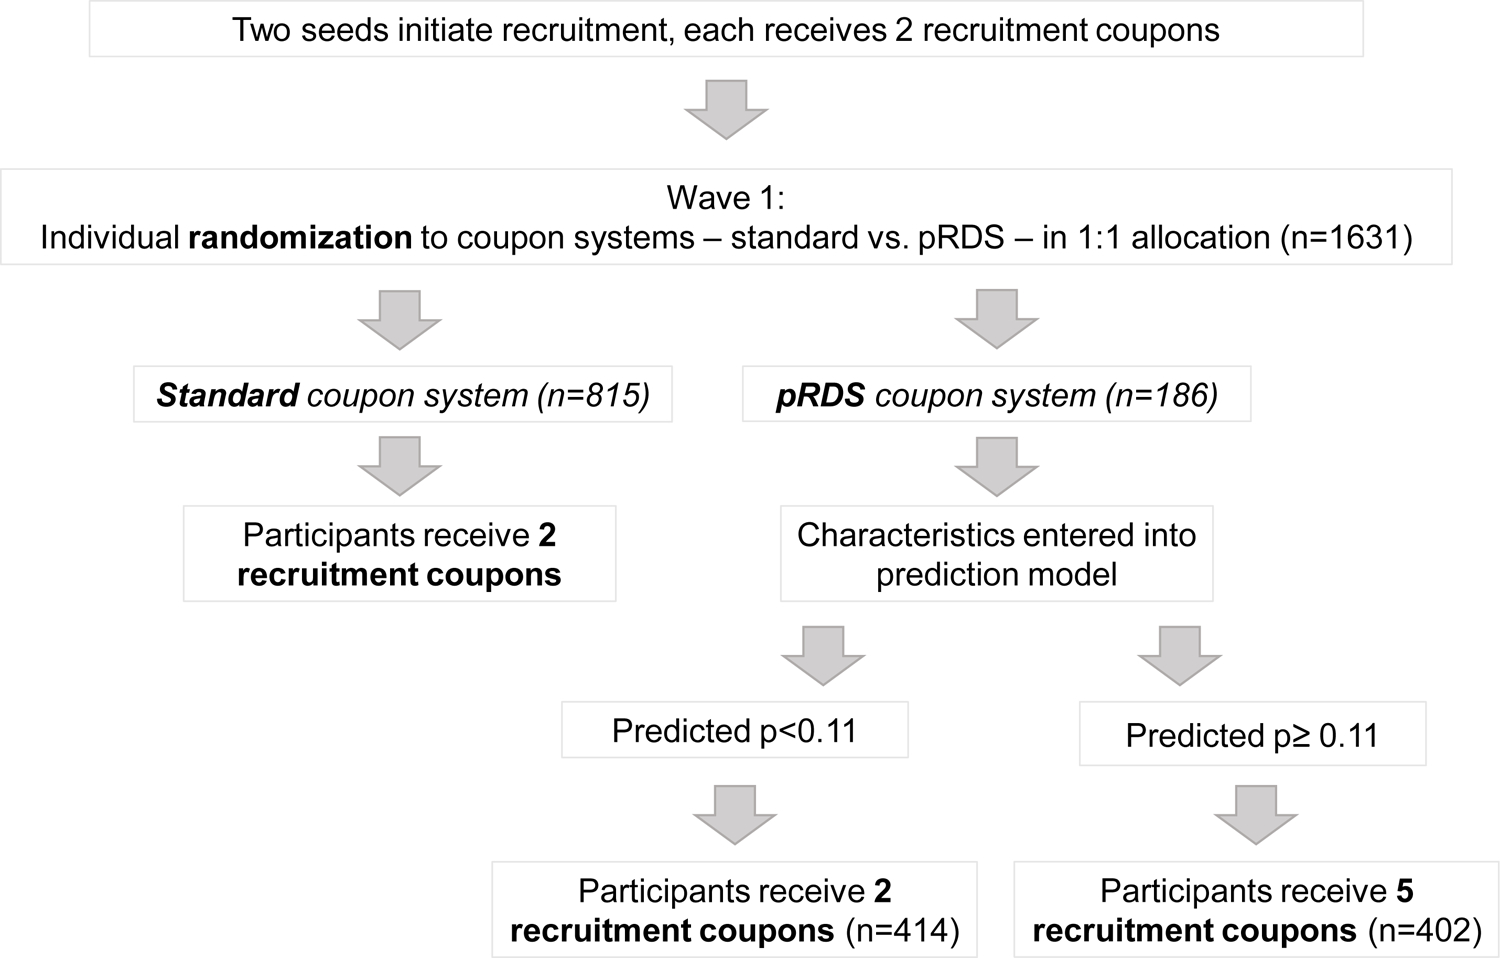
Randomization and coupon distribution flow diagram
Eligibility criteria to enroll were the same as the NCA trial with the exception of injection drug use in prior 12 months (rather than 24). Seeds and all other study participants received 250 rupees for completing procedures and 50 rupees for each eligible study participant referred. A biometric system was used to prevent duplicate enrollment. Following consent, participants provided a blood sample and completed an interviewer-administered questionnaire that collected socio-demographics, HIV and HCV testing/care, injection and sexual behaviors, harm reduction service utilization, and network characteristics. HIV/HCV pre- and post-test counseling with referrals to care were provided. HIV testing was conducted in accordance with Indian guidelines using 3 rapid tests. HCV antibody testing was conducted using SD BIOLINE HCV (Standard Diagnostics, Inc, Korea). HIV RNA was measured using RealTime HIV-1 (Abbott Laboratories, Abbott Park, IL, USA).
Statistical methods
Efficiency was evaluated in two ways: tthe number needed to recruit (NNR) and identification rate. Both were used to compare the efficiency of the standard vs. pRDS approach in identifying undiagnosed HIV-infected PWID. The NNR (total number recruited / number of undiagnosed PWID identified) is the average number of individuals recruited in order to find one undiagnosed individual. The lower the NNR, the more efficient approach, meaning fewer persons need to be tested. The identification rate is the average number of undiagnosed individuals identified per week (number of undiagnosed HIV-infected PWID identified / number of weeks RDS recruitment was active). Here, efficiency is measured in terms of the time required to identify undiagnosed persons. The difference in NNR and rate between the approaches was calculated and a confidence interval estimated using bootstrapping. For secondary analyses, we explored the NNR and identification rate by months of cumulative recruitment and the NNR and rate for viremic PWID (i.e., HIV viral load ≥ 150 copies/mL) for each approach.
Analyses were conducted using Stata (StataCorp. 2017. Stata: Release 15.1. Statistical Software. College Station, TX: StataCorp LLC) and the randomForestSRC package in R (R Core Team (2016). R: A language and environment for statistical computing. R Foundation for Statistical Computing, Vienna, Austria. URL https://www.R-project.org/). P-values were considered statistically significant at <0.05.
Ethical clearances
This study was approved by the institutional review boards of the Johns Hopkins University School of Medicine and the Y.R. Gaitonde Centre for AIDS Research and Education.
RESULTS
Predicting recruitment of an undiagnosed HIV-infected PWID
A total of 4,002 PWID were recruited across the four NCA trial sites. Median age was 28 (interquartile range [IQR]: 23 – 35), nearly all were male (99.7%), 45.4% had a primary education or less, about half were injecting daily (52.3%), and of those injecting in the prior 6 months, 79.7% reported injecting buprenorphine, the most commonly used drug. HIV prevalence was 18.5%; 72.8% of whom were previously unaware of their status. HCV prevalence was 46.8%. The overall coupon return rate was 50.1%; 42.2% recruited no other participants, 15.9% recruited one, and 42.0% recruited two;12.1% recruited at least one undiagnosed HIV-infected PWID.
Characteristics of recruiting an undiagnosed HIV-infected PWID are presented in Table 1 along with their predictive accuracy calculated from univariable logistic regressions (i.e. AUROC) and the random forest (i.e. VIMP). The larger an individual’s PWID network size, the more likely they were to recruit an undiagnosed PWID (one increase in ln OR: 1.10, 95% CI; 1.03 – 1.18); network size had the highest AUROC (0.534). Compared to those HIV and HCV negative, PWID with mono-HCV infection (OR: 1.38, 95% confidence interval [CI]: 1.11 – 1.71) and co-infection (OR: 1.78, 95% CI: 1.37 – 2.31) were significantly more likely to recruit an undiagnosed PWID; HIV/HCV status had the second highest AUROC (0.531). Other characteristics with an AUROC>0.5 included the number of sexual partners, injecting buprenorphine, injecting in a shooting gallery, and using a needle/syringe exchange program (NEP) in the prior six months. Demographics - age, sex, marital status, and education - were not significantly associated with recruiting an undiagnosed PWID. HIV/HCV status, NEP use, and injecting in a shooting gallery also had VIMP scores above zero. Characteristics with VIMP scores above zero but with an AUROC<0.5 include injecting sedatives and stimulants, injecting with multiple people and sexual partners, being incarcerated, injecting at a friend’s house, public toilet, or other place in the prior six months, and being female.
Table 1.
Characteristics of recruiting an undiagnosed HIV-infected PWID and their predictive accuracy
| Characteristic | Did not recruit undiagnosed PWID (N=3516) |
Recruited undiagnosed PWID (N=486) |
Odds Ratio | 95% CI | AUROC | VIMP |
|---|---|---|---|---|---|---|
| n (col %)/ median (IQR) | n (col %)/ median (IQR) | |||||
| Socio-demographics | ||||||
| City | ||||||
| Amritsar | 880 (25.0) | 121 (24.9) | Reference | -- | -- | |
| Chandigarh | 905 (25.7) | 93 (19.1) | 0.75 | 0.56 – 0.99 | ||
| New Delhi | 874 (24.9) | 127 (26.1) | 1.06 | 0.81 – 1.38 | ||
| Ludhiana | 857 (24.4) | 145 (29.8) | 1.23 | 0.95 – 1.59 | ||
| Age, years (model by 10 years) | 28 (23 – 35) | 29 (23 – 36) | 1.06 | 0.96 – 1.17 | 0.499 | −0.00499 |
| Female (model vs. male/hijra) | 12 (0.3) | 2 (0.4) | 1.21 | 0.27 – 5.41 | 0.457 | 0.00002 |
| Marital status | ||||||
| Never married | 1828 (52.0) | 275 (56.6) | Reference | 0.495 | −0.00189 | |
| Married/long-term or living w/partner | 1418 (40.3) | 179 (36.8) | 0.84 | 0.69 – 1.03 | ||
| Widowed/divorced/separated | 270 (7.7) | 32 (6.6) | 0.79 | 0.53 – 1.16 | ||
| Education | ||||||
| No/primary school | 1594 (45.3) | 221 (45.5) | Reference | 0.490 | −0.00308 | |
| Secondary school | 1413 (40.2) | 206 (42.4) | 1.05 | 0.86 – 1.29 | ||
| At least high school graduate | 509 (14.5) | 59 (12.1) | 0.84 | 0.62 – 1.13 | ||
| HIV/HCV characteristics | ||||||
| Tested for HIV in prior year | 1180 (33.6) | 166 (34.2) | 1.07 | 0.88 – 1.31 | 0.495 | −0.00133 |
| HIV positive | 623 (17.7) | 119 (24.5) | 1.50 | 1.20 – 1.88 | 0.502 | -- |
| HIV status and diagnosis | ||||||
| HIV negative | 2893 (82.3) | 367 (75.5) | Reference | 0.502 | −0.00125 | |
| HIV positive, undiagnosed | 456 (13.0) | 84 (17.3) | 1.45 | 1.12 – 1.88 | ||
| HIV positive, diagnosed | 167 (4.8) | 35 (7.2) | 1.65 | 1.13 – 2.42 | ||
| HIV status and viral load | ||||||
| HIV negative | 2896 (82.4) | 367 (75.5) | Reference | 0.497 | -- | |
| HIV positive, undetectable | 70 (2.0) | 10 (2.1) | 1.13 | 0.58 – 2.21 | ||
| HIV positive, detectable | 550 (15.6) | 109 (22.4) | 1.56 | 1.24 – 1.97 | ||
| HCV positive | 1606 (45.7) | 268 (55.1) | 1.46 | 1.21 – 1.77 | 0.520 | -- |
| HIV/HCV status | ||||||
| HIV and HCV negative | 1794 (51.0) | 199 (41.0) | Reference | 0.531 | 0.00049 | |
| HIV positive/HCV negative | 116 (3.3) | 19 (3.9) | 1.48 | 0.89 – 2.45 | ||
| HIV negative/HCV positive | 1099 (31.3) | 168 (34.6) | 1.38 | 1.11 – 1.71 | ||
| HIV and HCV positive | 507 (14.4) | 100 (20.6) | 1.78 | 1.37 – 2.31 | ||
| Sexual risk behaviors | ||||||
| Lifetime sexual partners | ||||||
| None | 455 (12.9) | 81 (16.7) | Reference | 0.500 | −0.00012 | |
| 1 or 2 | 1095 (31.1) | 148 (30.5) | 0.76 | 0.57 – 1.02 | ||
| 3 to 7 | 1155 (32.9) | 162 (33.3) | 0.79 | 0.59 – 1.05 | ||
| 8 to 17 | 459 (13.1) | 53 (10.9) | 0.65 | 0.45 – 0.94 | ||
| 18 or more | 352 (10.0) | 42 (8.6) | 0.67 | 0.45 – 1.00 | ||
| Sexual partners in prior 6 mo. | ||||||
| None | 1698 (48.3) | 261 (53.7) | Reference | 0.509 | −0.00175 | |
| 1 | 1282 (36.5) | 164 (33.7) | 0.83 | 0.68 – 1.03 | ||
| 2 or more | 536 (15.2) | 61 (12.6) | 0.74 | 0.55 – 0.99 | ||
| No sexual partners in prior 6 mo. | 1698 (48.3) | 261 (53.7) | 1.24 | 1.03 – 1.50 | 0.506 | -- |
| Unprotected sex in prior 6 mo. | ||||||
| No | 439 (12.5) | 56 (11.5) | Reference | 0.500 | −0.00019 | |
| Yes | 1379 (39.2) | 169 (34.8) | 0.96 | 0.70 – 1.32 | ||
| No sexual partners | 1698 (48.3) | 261 (53.7) | 1.21 | 0.89 – 1.64 | ||
| Substance use risk behaviors | ||||||
| Alcohol use (AUDIT) | ||||||
| Low/moderate use | 1990 (56.6) | 288 (59.3) | Reference | 0.493 | −0.00148 | |
| Harmful/hazardous use | 612 (17.4) | 94 (19.3) | 1.06 | 0.83 – 1.36 | ||
| Alcohol dependence | 914 (26.0) | 104 (21.4) | 0.79 | 0.62 – 1.00 | ||
| Drugs ever injected | ||||||
| Heroin only | 253 (7.2) | 17 (3.5) | Reference | 1.41 – 3.88 | 0.513 | −0.00149 |
| Buprenorphine/other pharmaceuticals only | 2049 (58.3) | 322 (66.3) | 2.34 | |||
| Combination | 1208 (34.4) | 147 (30.3) | 1.81 | 1.08 – 3.05 | ||
| Injection drug use frequency in prior 6 mo. | ||||||
| None | 443 (12.6) | 55 (11.3) | Reference | 0.485 | −0.00031 | |
| Less than daily | 1243 (35.4) | 167 (34.4) | 1.08 | 0.78 – 1.50 | ||
| Daily | 1830 (52.1) | 264 (54.3) | 1.16 | 0.85 – 1.58 | ||
| Shared needle/syringe in prior 6 mo. | 992 (28.2) | 137 (28.2) | 1.00 | 0.81 – 1.23 | 0.449 | −0.00067 |
| Drugs injected in prior 6 mo.: | ||||||
| Heroin | 835 (23.8) | 91 (18.7) | 0.74 | 0.58 – 0.94 | 0.489 | −0.00054 |
| Buprenorphine | 2420 (68.8) | 371 (76.3) | 1.46 | 1.17 – 1.82 | 0.510 | −0.00120 |
| Stimulants | 15 (0.4) | 3 (0.6) | 1.45 | 0.42 – 5.03 | * | 0.00013 |
| Sedatives | 431 (12.3) | 68 (14.0) | 1.16 | 0.88 – 1.53 | 0.473 | 0.00064 |
| Place injected in prior 6 mo.: | ||||||
| Home | 752 (21.4) | 95 (19.6) | 0.89 | 0.70 – 1.13 | 0.478 | −0.00031 |
| Friend’s house | 752 (21.4) | 94 (19.3) | 0.88 | 0.69 – 1.12 | 0.482 | 0.00013 |
| Public park/playground | 1809 (51.5) | 238 (49.0) | 0.91 | 0.75 – 1.09 | 0.486 | −0.00041 |
| Public toilet | 822 (23.4) | 107 (22.0) | 0.93 | 0.74 – 1.16 | 0.471 | 0.00004 |
| Shooting gallery | 973 (27.7) | 166 (34.2) | 1.36 | 1.11 – 1.66 | 0.504 | 0.00086 |
| Graveyard, cemetery, burial ground | 749 (21.3) | 88 (18.1) | 0.82 | 0.64 – 1.04 | 0.476 | −0.00190 |
| Other place | 956 (27.2) | 107 (22.0) | 0.76 | 0.60 – 0.95 | 0.487 | 0.00008 |
| Injected with in prior 6 mo.: | ||||||
| Alone | 1735 (49.4) | 254 (52.3) | 1.12 | 0.93 – 1.36 | 0.483 | −0.00048 |
| Spouse/sexual partner | 39 (1.1) | 13 (2.7) | 2.45 | 1.30 – 4.62 | 0.468 | 0.00018 |
| One other person | 1503 (42.8) | 203 (41.8) | 0.96 | 0.79 – 1.16 | 0.474 | −0.00048 |
| Multiple other persons | 1272 (36.2) | 186 (38.3) | 1.09 | 0.90 – 1.33 | 0.463 | 0.00045 |
| Number of persons injected with in prior 30 days | ||||||
| None | 1049 (29.8) | 137 (28.2) | Reference | 0.481 | −0.00262 | |
| 1 to 5 | 1688 (48.0) | 249 (51.2) | 1.13 | 0.90 – 1.41 | ||
| 6 to 10 | 429 (12.2) | 51 (10.5) | 0.91 | 0.65 – 1.28 | ||
| 11 or more | 297 (8.5) | 41 (8.4) | 1.06 | 0.73 – 1.53 | ||
| Needle/syringe exchange program use in prior 6 mo. | 1464 (41.6) | 255 (52.5) | 1.55 | 1.28 – 1.87 | 0.522 | 0.00225 |
| Opioid agonist therapy in past 6 mo. | 838 (23.8) | 113 (23.3) | 0.97 | 0.77 – 1.21 | 0.456 | −0.00125 |
| Incarcerated in prior 6 mo. | 286 (8.1) | 41 (8.4) | 1.04 | 0.74 – 1.46 | 0.454 | 0.00013 |
| Network size | ||||||
| PWID network size† (model by one ln) | 15 (6 – 40) | 20 (8 – 50) | 1.10 | 1.03 – 1.18 | 0.534 | −0.00465 |
| PWID network size† | ||||||
| 10 or less | 1367 (38.9) | 152 (31.3) | Reference | 0.516 | -- | |
| 11 to 20 | 773 (22.0) | 113 (23.3) | 1.31 | 1.01 – 1.70 | ||
| 21 to 50 | 812 (23.1) | 129 (26.5) | 1.43 | 1.11 – 1.83 | ||
| 50 or more | 564 (16.0) | 92 (18.9) | 1.47 | 1.11 – 1.93 | ||
PWID: person who injects drugs; CI: confidence interval; AUROC: area under the receiver operator curve from univariable logistic model; VIMP: variable importance from random forest; HCV: Hepatitis C virus; ln: natural log
AUROC not calculable due to small number of observations in some cells;
Number of PWID they personally know in their city;
--Characteristic not included in random forest.
The multivariable model including only characteristics with an AUROC>0.5 resulted in an AUROC of 0.573 (see Table, Supplemental Digital Content 1, multivariable models and predictive accuracy); adding characteristics identified by the random forest with a VIMP>0 increased the AUROC to 0.575 (i.e., the final algorithm used for the pRDS approach). A probability cut-off of 0.11 results in a sensitivity of 0.65 and specificity of 0.50 and thus was chosen as the cut-off to be used in Morinda. This cut-off results in a positive predictive value of 0.16 and a negative predictive value of 0.92.
Evaluating the precision RDS approach
From December 15, 2017 to December 15, 2018, 1631 PWID recruits enrolled and completed study procedures in Morinda. Median age was 26 (IQR: 22 – 33), all were men, 20.7% were injecting daily and among those injecting in the prior six months, the most commonly used drug was buprenorphine (72.1%). HIV prevalence was 10.2%, and 69.9% of those HIV-infected were previously unaware of their infection. HCV prevalence was 41.9% and HIV/HCV co-infection was 9.1%.
Among recruits, 815 were randomized to the standard coupon approach, and 816 were randomized to the pRDS coupon approach. Characteristics were similar across the two approaches (Table 2). Of those in the pRDS, 414 (50.7%) had a predicted probability<0.11 and received two recruitment coupons; 402 (49.3%) had a predicted probability≥0.11 and received 5 coupons. Applying the prediction algorithm, the AUROC was 0.615 (95% CI: 0.566 – 0.664).
Table 2.
Characteristics by RDS coupon approach
| Characteristic n (col %)/ median (IQR) |
Randomized to standard approach (N=815) |
Randomized to pRDS (N=816) |
Recruits of standard approach (N=615) |
Recruits of pRDS (N=1012) | Recruits of pRDS with low predicted probability (N=309) | Recruits of pRDS with high predicted probability (N=703) |
|---|---|---|---|---|---|---|
| Age (years) | 26 (22 – 32) | 26 (22 – 33) | 26 (22 – 32) | 26 (22 – 33) | 25 (21 – 33) | 26 (22 – 33) |
| Currently married | 361 (38.8) | 294 (36.0) | 224 (36.4) | 386 (38.2) | 111 (36.0) | 275 (39.1) |
| Education | ||||||
| No/primary school | 131 (16.1) | 123 (15.1) | 88 (14.3) | 166 (16.4) | 48 (15.5) | 118 (16.8) |
| Secondary school | 476 (58.4) | 476 (58.3) | 371 (60.3) | 578 (57.1) | 179 (57.9) | 399 (56.8) |
| At least high school graduate | 208 (25.5) | 217 (26.6) | 156 (25.4) | 268 (26.5) | 82 (26.5) | 186 (26.5) |
| Tested for HIV in prior year | 238 (29.2) | 261 (32.0) | 191 (31.1) | 307 (30.3) | 61 (19.7) | 246 (35.0) |
| HIV/HCV status | ||||||
| HIV and HCV negative | 464 (56.9) | 467 (57.2) | 365 (59.4) | 566 (55.9) | 184 (59.6) | 382 (54.3) |
| HIV positive/HCV negative | 7 (0.9) | 10 (1.3) | 8 (1.3) | 9 (0.9) | 0 (0) | 9 (1.3) |
| HIV negative/HCV positive | 268 (32.9) | 266 (32.6) | 196 (31.9) | 336 (33.2) | 102 (33.0) | 234 (33.3) |
| HIV and HCV positive | 76 (9.3) | 73 (9.0) | 46 (7.5) | 101 (10.0) | 23 (7.4) | 78 (11.1) |
| Undiagnosed HIV infection (among all) | 60 (7.4) | 56 (6.9) | 39 (6.3) | 77 (7.6) | 18 (5.8) | 59 (8.4) |
| Undiagnosed HIV infection (among HIV positives) | 60 (73.3) | 56 (67.5) | 39 (72.2) | 77 (70.0) | 18 (78.3) | 59 (67.8) |
| HIV viremic1 (among all) | 72 (8.8) | 67 (8.2) | 46 (7.5) | 92 (9.1) | 18 (5.8) | 74 (10.5) |
| HIV viremic1 (among HIV positives) | 72 (86.8) | 67 (80.7) | 46 (85.2) | 92 (83.6) | 18 (78.3) | 74 (85.1) |
| Undiagnosed HCV infection (among HCV positives) | 311 (90.4) | 304 (89.7) | 220 (90.9) | 392 (89.7) | 113 (90.4) | 279 (89.4) |
| Injection drug use frequency in prior 6 mo. | ||||||
| None | 173 (21.2) | 172 (21.1) | 124 (20.2) | 221 (21.8) | 77 (24.9) | 144 (20.5) |
| Less than daily | 469 (57.6) | 480 (58.8) | 348 (56.6) | 598 (59.1) | 174 (56.3) | 424 (60.3) |
| Daily | 173 (21.2) | 164 (20.1) | 143 (23.3) | 193 (19.1) | 58 (18.8) | 135 (19.2) |
| Drugs injected in prior 6 mo. (among active injectors) | ||||||
| Buprenorphine only | 39 (6.1) | 53 (8.2) | 33 (6.7) | 59 (7.5) | 13 (5.6) | 46 (8.2) |
| Heroin only | 177 (27.6) | 163 (25.3) | 146 (29.7) | 194 (24.5) | 71 (30.6) | 123 (22.0) |
| Cocaine only | 3 (0.5) | 2 (0.3) | 1 (0.2) | 4 (0.5) | 0 (0) | 4 (0.7) |
| Pharmaceuticals only | 5 (0.8) | 4 (0.6) | 2 (0.4) | 7 (0.9) | 2 (0.9) | 5 (0.9) |
| Combination use | 418 (65.1) | 422 (65.5) | 309 (62.9) | 527 (66.6) | 146 (62.9) | 381 (68.2) |
| Shared needle/syringe in prior 6 mo. (among active injectors) | 165 (25.7) | 178 (27.6) | 138 (28.1) | 204 (25.8) | 57 (24.6) | 147 (26.3) |
| Needle/syringe exchange program use in prior 6 mo. | 239 (29.3) | 229 (28.1) | 173 (28.1) | 291 (28.8) | 68 (22.0) | 223 (31.7) |
| Opioid agonist therapy in past 6 mo. | 181 (22.2) | 211 (25.9) | 150 (24.4) | 240 (23.7) | 49 (15.9) | 191 (27.2) |
| Sexual partners in prior 6 mo. | ||||||
| None | 400 (49.1) | 407 (49.9) | 320 (52.0) | 487 (48.1) | 158 (51.1) | 329 (46.8) |
| 1 | 371 (45.5) | 367 (45.0) | 262 (42.6) | 475 (46.9) | 131 (42.4) | 344 (48.9) |
| 2 or more | 44 (5.4) | 42 (5.2) | 33 (5.4) | 50 (4.9) | 20 (6.5) | 30 (4.3) |
| Incarcerated in prior 6 mo. | 11 (1.4) | 19 (2.3) | 12 (2.0) | 17 (1.7) | 4 (1.3) | 13 (1.9) |
| PWID network size2 | ||||||
| 10 or less | 337 (41.4) | 350 (42.9) | 271 (44.1) | 416 (41.1) | 120 (38.8) | 296 (42.1) |
| 11 to 20 | 339 (41.6) | 330 (40.4) | 249 (40.5) | 420 (41.5) | 139 (45.0) | 281 (40.0) |
| 21 to 50 | 126 (15.5) | 123 (15.1) | 85 (13.8) | 163 (16.1) | 47 (15.2) | 116 (16.5) |
| 50 or more | 13 (1.6) | 13 (1.6) | 10 (1.6) | 13 (1.3) | 3 (1.0) | 10 (1.4) |
PWID: people who inject drugs; RDS: respondent-driven sampling
: Viremia defined as HIV viral load ≥ 150 copies/mL;
: Number of PWID they personally know in their city
Recruitment progressed to 20 waves in Morinda. Most participants were generated from one of the seeds (98.1%). The overall coupon return rate was 36.4% and did not significantly differ across the two approaches or number of coupons provided (standard=37.7%, pRDS=35.7%, pRDS-two coupon=37.3%, pRDS-five coupon=35.0%). On average, those that received two coupons, recruited 0.75 participants. Those in pRDS who received 5 coupons recruited 1.75 participants on average.
From the standard coupon approach, 615 PWID were recruited and from pRDS, 1012 were recruited. There were no significant differences between the recruits of the two approaches (Table 2). Within pRDS, there were several significant differences between recruits of those with high vs. low predicted probability. Recruits of those with high probability were more likely to have been tested for HIV in the prior year (35.0% vs. 19.7%, p<0.001), be HIV/HCV co-infected (11.1% vs. 7.4%, p=0.049), have an undiagnosed HIV infection (8.4% vs. 5.8%, p=0.047), be viremic (5.8% vs. 10.5%, p=0.017), and recently use a needle/syringe exchange program (31.7% vs. 22.0%, p=0.002) or opioid agonist therapy (27.2% vs. 15.9%, p=0.002). When compared to recruits of those randomized to the standard approach that had a high predicted probability (i.e. would have received more recruitment coupons had they been in pRDS), recruits of those in pRDS with a high predicted probability were similar across all characteristics explored with the exception of number of sexual partners in the prior six months (see Table, Supplemental Digital Content 2, characteristics by recruiter’s approach of those with predicted high probability).
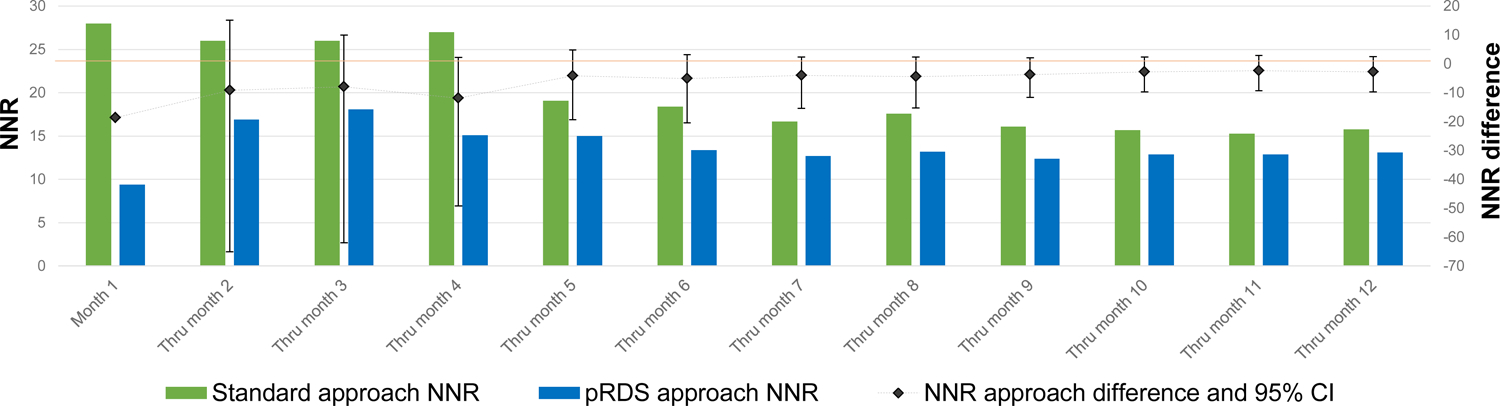
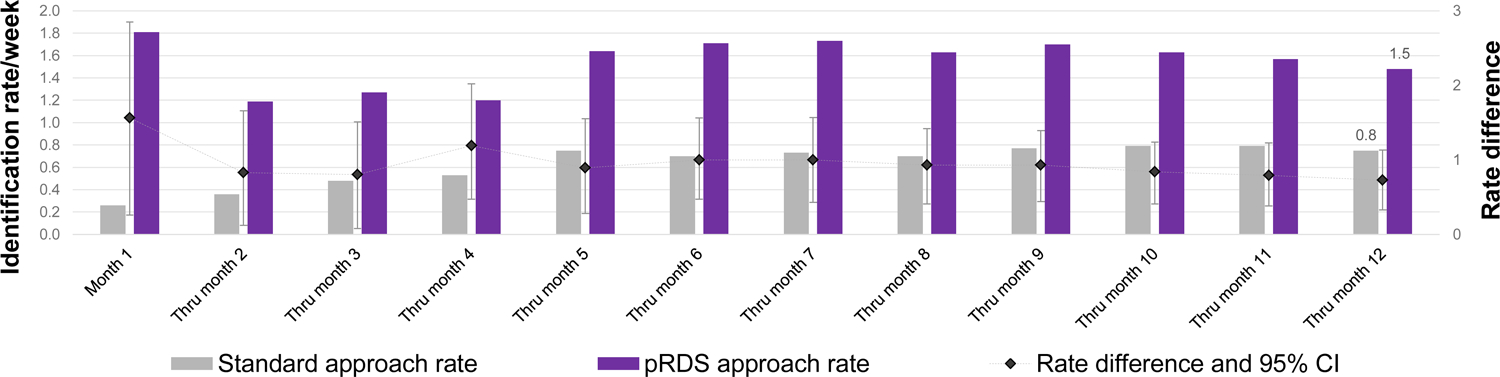
A total of 39 undiagnosed HIV-infected PWID were recruited from the standard approach, resulting in an NNR of 15.8. A total of 77 undiagnosed PWID were recruited from pRDS, resulting in an NNR of 13.1. The difference in NNR was −2.7, but this difference was not statistically significant (95% CI: −9.6 – 2.6). Plotting the NNR over recruitment months shows that the standard approach NNR generally decreased (test for trend p-value = 0.002) over time while the pRDS NNR appeared more stable (test for trend p-value = 0.214) (Figure 2a). At no time point was the difference in NNR between the two approaches statistically significant (i.e. difference confidence intervals overlapped zero). The identification rate of undiagnosed HIV-infected PWID for pRDS was higher (1.5/week) than the standard approach (0.8/week) (difference: 0.7, 95% CI: 0.3 – 1.1). Plotting the identification rate over recruitment months shows that the rate increased slightly over time in the standard approach while it was more variable for pRDS. At all time points, the identification rate for pRDS was significantly higher than the standard approach (Figure 2b). For viremic PWID, 46 were recruited from the standard approach, for an NNR of 13.4 and 92 were recruited from pRDS, for an NNR of 11.0; the difference was not statistically significant (difference: −2.4, 95% CI: −7.7 – 1.6). The viremic identification rate for pRDS (1.8/week) was significantly higher than the standard approach (0.9/week) (difference: 0.9, 95% CI: 0.4 – 1.3).
Figure 2a.
NNR over months of recruitment by RDS approach
Figure 2b.
Identification rate over months of recruitment by RDS approach
DISCUSSION
A precision RDS approach that preferentially allocated recruitment coupons to individuals identified as being more likely to recruit undiagnosed HIV-infected PWID significantly improved the rate of identification of undiagnosed as well as viremic PWID over the standard approach. Moreover, pRDS participants predicted to have higher probability of recruiting undiagnosed PWID were significantly more likely to recruit those who were co-infected with HIV and HCV, had an undiagnosed HIV-infection, and were viremic. While these differences suggest a benefit with respect to the amount of time an RDS needs to operate to identify undiagnosed PWID, there was no significant benefit with respect to the number that needed to be tested as evidenced by the NNR. However, pRDS cost approximately $10 less per undiagnosed PWID over the standard approach. This could add up to a substantial difference when trying to reach large numbers in a community (e.g. $10,000 less to identify 1000 undiagnosed people).
Characteristics such as HIV and HCV infection, PWID network size, utilization of needle/syringe exchange programs, and the injection environment - where PWID and with whom they inject - predicted who was most likely to recruit undiagnosed PWID. However, the predictive ability of these characteristics was overall low, suggesting network patterns or composition among our target population may not have been strong enough to substantially influence recruitment patterns. One could imagine with a stronger predictive model, pRDS would be even more efficient at recruiting undiagnosed individuals.
The pRDS approach found more than one additional undiagnosed and viremic person every two weeks over the standard approach and twice as many in total over one year. This was a consequence of more coupons given and PWID identified from pRDS - nearly twice as many as the standard approach - since half of those in pRDS received 5 coupons while all participants in the standard RDS received 2 coupons. Increasing the number of recruitment coupons more rapidly identified PWID overall, which often results in RDS recruitment trees that grow wide, rather than deep. RDS theory suggests that samples such as this might fail to sufficiently penetrate networks and identify, in particular, those who are more peripheral and have different risk profiles from earlier waves, which would have consequences for providing unbiased population estimates15. However, recruits of the two approaches did not differ on behaviors or other characteristics and, importantly, the goal of pRDS was to increase the efficiency of identifying undiagnosed HIV-infected PWID, not estimate population characteristics.
There is little prior research on differential coupon distribution in order to steer an RDS sample to preferentially recruit specific sub-groups. Among PWID in Tijuana, Mexico, researchers provided more coupons to women in order to recruit more women but were not successful16; notably, this strategy assumes women who inject drugs are connected to other women, which may not be the case. Prior data on who are connected to/recruit women could have been informative when attempting to recruit more women. Similar to differential coupons, researchers have increased participant compensation for recruiting more of a particular sub-group such as younger PWID15 or individuals at high risk for HIV17 in the United States, with the former but not the latter being successful. In Tajikistan, Kan and colleagues compared a traditional RDS design in which recruitment of PWID continued indefinitely to a system in which recruitment ceased after two waves with no HIV-infected PWID (i.e. restricted RDS); the restricted RDS approach yielded more new diagnoses18. For future research, it would be worthwhile to investigate whether recruitment can be steered to those with characteristics associated with high HIV risk such as those who share needles/syringes or have unprotected sex.
Morinda is a smaller community compared to sites in our prior RDS studies, likely with a smaller population of PWID. There were approximately 400 PWID registered at the local OAT center (personal communication). So, with over 1600 total PWID recruited, we may have sampled a large fraction of PWID in Morinda and its surrounding communities. This may have impacted our ability to see a meaningful or statistically significant difference between the two approaches.
There are limitations to this work. First, the evaluation was conducted in one city in India among PWID. Replicating this or a similar approach in additional populations with different HIV epidemics would provide more robust evidence on the efficiency of pRDS. Awareness of HIV infection was self-reported using an interviewer-administered questionnaire, which is subject to recall or reporting bias, though well-trained interviewers were used to mitigate bias. Validating self-reported diagnosis status with local testing centers was not be feasible. However, viral load testing found that only 6% of those self-reporting no prior diagnosis had suppressed viral load. Lastly, the pRDS prediction algorithm required prior RDS data from a similar population. A prediction algorithm developed using data from the same population (i.e., same person, place, and time) as to whom it will be applied, if available, would likely perform best. For some, these data already exist and could be leveraged. Programmatic data available via strategies such as enhanced peer outreach approach and social network sampling under PEPFAR could be utilized. In settings where prior data is unavailable, one could use HIV/HCV status only, providing more recruitment coupons to those with HIV (and HCV for PWID), given these were strong predictors and can be objectively and quickly assessed using rapid tests.
In summary, getting to the UNAIDS 95-95-95 target will require novel strategies to reach the more hidden or difficult-to-reach PLWH that are not engaging in HIV testing and care services. Leveraging RDS or similar network-based strategies, already employed in HIV research and surveillance, should be considered alongside other strategies to ensure the UNAIDS first 95 target is reached for all populations living with HIV.
Supplementary Material
ACKNOWLEDGEMENTS
Principle contributions of co-authors:
Study Design: AMM, BL, CL, SHM, SSS
Data acquisition: AKK, SA, CKV
Data analysis/interpretation: AMM, BL, CL, SHM, SSS
Sources of support:
National Institutes of Health, US Grants# DP2DA040244, R01DA032059, T32AI102623, F31DA044046. Facilitated by the Johns Hopkins Center for AIDS Research (1P30AI094189).
Footnotes
Presented at: CROI March 2020 (virtual), poster #890
REFERENCES
- 1.Gardner EM, McLees MP, Steiner JF, et al. The Spectrum of Engagement in HIV Care and its Relevance to Test-and-Treat Strategies for Prevention of HIV Infection. Clinical Infectious Diseases. 2011;52(6):793–800. [DOI] [PMC free article] [PubMed] [Google Scholar]
- 2.UNAIDS. Fast Track: Ending the AIDS epidemic by 2030. 2014; http://www.unaids.org/en/resources/documents/2014/JC2686_WAD2014report. Accessed October 14, 2019.
- 3.Hakim AJ, MacDonald V, Hladik W, et al. Gaps and opportunities: measuring the key population cascade through surveys and services to guide the HIV response. Journal of the International AIDS Society. 2018;21:e25119. [DOI] [PMC free article] [PubMed] [Google Scholar]
- 4.Mehta SH, Lucas GM, Solomon S, et al. HIV Care Continuum Among Men Who Have Sex With Men and Persons Who Inject Drugs in India: Barriers to Successful Engagement. Clinical Infectious Diseases. 2015:civ669. [DOI] [PMC free article] [PubMed]
- 5.Heckathorn DD. Respondent-driven sampling: a new approach to the study of hidden populations. Social Problems. 1997;44(2):174–199. [Google Scholar]
- 6.Baral SD, Ketende S, Schwartz S, et al. Evaluating respondent-driven sampling as an implementation tool for universal coverage of antiretroviral studies among men who have sex with men living with HIV. Journal of Acquired Immune Deficiency Syndromes. 2015;68:S107–S113. [DOI] [PMC free article] [PubMed] [Google Scholar]
- 7.Fuqua V, Chen Y-H, Packer T, et al. Using Social Networks to Reach Black MSM for HIV Testing and Linkage to Care. AIDS Behav. 2011;16(2):256–265. [DOI] [PubMed] [Google Scholar]
- 8.Sypsa V, Psichogiou M, Paraskevis D, et al. Rapid decline in HIV incidence among persons who inject drugs during a fast-track combination prevention program after an HIV outbreak in Athens. The Journal of Infectious Diseases. 2017;215(10):1496–1505. [DOI] [PMC free article] [PubMed] [Google Scholar]
- 9.Des Jarlais D, Thi Huong D, Khuê Pham M, et al. Integrated respondent driven sampling and peer support for persons who inject drugs in Haiphong, Vietnam: A case study with implications for interventions. AIDS Care. 05/13 2016;28(10):1312–1315. [DOI] [PMC free article] [PubMed] [Google Scholar]
- 10.Solomon SS, McFall AM, Lucas GM, et al. Respondent-driven sampling for identification of HIV- and HCV-infected people who inject drugs and men who have sex with men in India: A cross-sectional, community-based analysis. PLOS Medicine. 2017;14(11):e1002460. [DOI] [PMC free article] [PubMed] [Google Scholar]
- 11.Solomon SS, Lucas GM, Celentano DD, et al. Design of the Indian NCA study (Indian national collaboration on AIDS): a cluster randomized trial to evaluate the effectiveness of integrated care centers to improve HIV outcomes among men who have sex with men and persons who inject drugs in India. BMC Health Services Research. 2016;16(1):652. [DOI] [PMC free article] [PubMed] [Google Scholar]
- 12.Lucas GM, Solomon SS, Srikrishnan AK, et al. High HIV burden among people who inject drugs in 15 Indian cities. AIDS 2015; 29(5):619–628. [DOI] [PMC free article] [PubMed] [Google Scholar]
- 13.Hastie T, Tibshirani R, Friedman J. The Elements of Statistical Learning: Data mining, inference, and prediction. 2nd ed: Springer; 2009. [Google Scholar]
- 14.Breiman L Random forests. Machine learning. 2001;45(1):5–32. [Google Scholar]
- 15.Heckathorn DD, Semaan S, Broadhead RS, et al. Extensions of respondent-driven sampling: a new approach to the study of injection drug users aged 18–25. AIDS Behav. 2002;6(1):55–67. [Google Scholar]
- 16.Abramovitz D, Volz EM, Strathdee SA, et al. Using Respondent Driven Sampling in a Hidden Population at Risk of HIV Infection: Who do HIV-positive recruiters recruit? Sexually Transmitted Diseases. 2009;36(12):750–756. [DOI] [PMC free article] [PubMed] [Google Scholar]
- 17.McCoy SI, Shiu K, Martz TE, et al. Improving the Efficiency of HIV Testing With Peer Recruitment, Financial Incentives, and the Involvement of Persons Living With HIV Infection. Journal of Acquired Immune Deficiency Syndromes. June 2013;63(2):E56–E63. [DOI] [PubMed] [Google Scholar]
- 18.Kan M, Garfinkel DB, Samoylova O, et al. Social network methods for HIV case‐finding among people who inject drugs in Tajikistan. Journal of the International AIDS Society. 2018;21:e25139. [DOI] [PMC free article] [PubMed] [Google Scholar]
Associated Data
This section collects any data citations, data availability statements, or supplementary materials included in this article.