Abstract
Cell-based functional assays are an important part of compound screening and drug lead optimization, and they can also play a crucial role in the determination of the residues involved in ligand binding and signaling for a particular G-protein-coupled receptor. Conventional methods used for Gαq/15-coupled receptors rely on the use of fluorescent probes for Ca++ sensing (such as Fura-2 and Fluo-4) or on the incorporation of [3H]-inositol into inositol 1,4,5- triphosphate (IP3). However, these methods are not suitable for screening large libraries of compounds or for screening several mutants of the same receptor. In contrast, the IP-One assay by Cisbio is a TR-FRET assay suitable for large compound library screening when using stable cell lines that express a specific 7TMR. However, when using transiently transfected mutants of a 7TMR, this assay is not ideal, as it requires a two-step protocol of cell culture. Therefore, we have optimized the IP-One assay protocol using the reverse transfection method in 384-well plates. This offers a time- and resource-efficient alternative to the two-step protocol previously used for the screening of several mutants of Gαq/15-coupled 7TMRs.
Keywords: G-protein-coupled receptor, Seven-transmembrane receptor, Gαq signaling , Gα15/16 signaling Inositol phosphate , IP-One, Signal transduction.
Background
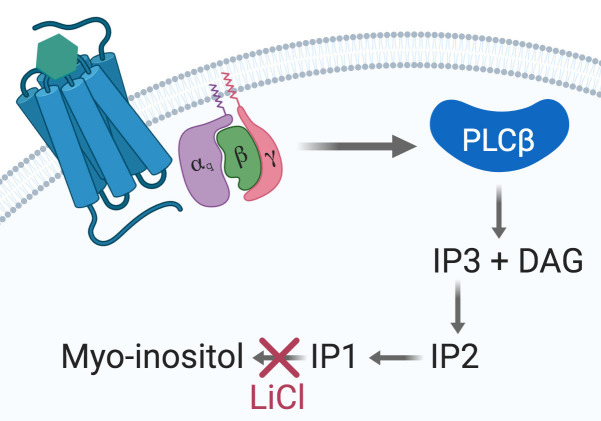
Seven-transmembrane receptors (7TMR), also known as G-protein-coupled receptors, are the most important transmembrane protein superfamily involved in signal transduction. They are the target of 30 to 50% of clinically approved drugs ( Overington et al., 2006 ). Gαq/15-coupled 7TMRs activate phospholipase C β (PLCβ) and produce D-myo-inositol 1,4,5-triphosphate (IP3) and diacylglycerol (DAG). IP3 trigger a release of intracellular Ca++ storages and is later degraded into IP2, IP1 and ultimately D-myo-inositol (Figure 1).
Figure 1. The Gαq signaling pathway.
Upon agonist binding at a given Gαq-coupled 7TMR, the α subunit dissociates from the βγ dimer and activates the PLCβ, thus initiating the cleavage of PIP2 into IP3 and DAG. IP3 is then degraded into IP2, IP1, and myo-inositol. Accumulation of IP1 is achieved by using a stimulation buffer containing LiCl to inhibit IP1 degradation into myo-inositol and further recycling.
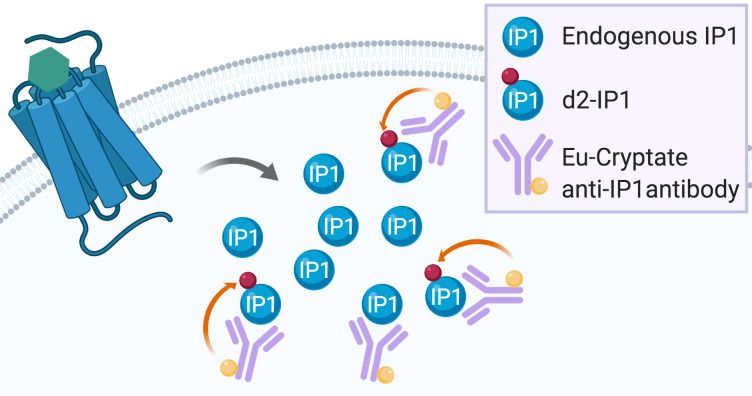
Gαq/15 activation is commonly measured by dectecting Ca++ flux using fluorescent calcium dye indicators. However, these indicators require either the use of an Atto-Fluor microscope with very low throughput, or investment in an expensive fluorescent imaging plate reader (FLIPR, Arkin et al., 2004 ). Another Gαq/15 activity quantification method relies on the detection of [3H]-inositol-phosphates ([3H]-IPs) following incubation of cells with [3H]-inositol. This highly reliable assay is based on the accumulation of [3H]-IPs after stimulation with a 7TMR agonist (Thomsen and Behan, 2007). However, both the FLIPR calcium flux assay and the [3H]-IPs detection method have important drawbacks. On the one hand, the Ca++ flux is transient and rapid, the assay does not permit the detection of constitutive activity (and thus, inverse agonism), and the readout can be interfered with by fluorescent compounds ( Garbison et al., 2004 ). On the other hand, [3H]-IPs detection assays are time-consuming, very expensive, and generate radioactive waste that needs to be disposed of properly. A non-radioactive assay based on the detection of accumulated IP1 using a homogenous time-resolved fluorescence assay has been developed by Cisbio ( Trinquet et al., 2011 ). This assay is based on a competition between endogenous IP1 and d2-labeled IP1 binding to an Eu cryptate-conjugated IP1 antibody (Figure 2, Liu et al., 2008 ).
Figure 2. IP-One assay principle.
Endogenous IP1 produced after 7TMR activation enter into competition with the exogenous d2-labeled IP1 for binding to the exogenous Eu-cryptate anti-IP1 antibody. When d2-IP1 is bound to the Eu-cryptate anti-IP1 antibody, the close proximity of the two fluorescent dyes allows for energy transfer during the readout (represented by the orange arrow). The more IP1 is produced by 7TMR activation, the less d2-IP1 is bound to the Eu-cryptate anti-IP1 antibody and the less energy transfer can be recorded during readout.
Several protocols have been developed for the quantification of IP1 using Cisbio’s IP-One assay, but they only apply for the screening of different compounds at a single receptor. Traditional protocols for IP-One assay using transient or stable receptor expression are designed in a 2-step protocol. First, cells are plated into petri-dishes and transfected for 24 to 48 h to achieve a suitable cell-surface receptor expression (if transient expression is preferred). Next, cells are detached using trypsin and re-suspended in stimulation buffer before being distributed and stimulated into the assay 384-well plate ( Shehata et al., 2016 ; St- Pierre et al., 2018 ). Other variations of this protocol using stable cell lines are reported and involve a plating step into the assay plate 24 h before stimulation ( Cassutt et al., 2007 ; Zhang et al., 2010 ).
In order to avoid the transfection of receptors and mutants into petri dishes and then the transfer of cells into the assay plates, and to avoid unnecessary exposition to trypsin that can lead to non-functional surface receptors, we have developed a single step transfection and assay protocol. This protocol uses reverse transfection of the receptor’s DNA and direct plating of cells in a cell culture-treated and assay-suitable 384-well plate. After 48-h incubation, adherent cells are then washed and used in the IP-One assay ( Gusach et al., 2019 ; Luginina et al., 2019 ). This protocol can also be used for receptors that are not coupled to Gαq by co-transfection of the Gα15/16 G protein-coding plasmid along with the receptor’s plasmid as Gα15/16 are promiscuous G proteins able to couple to non-Gαq-coupled 7TMRs (New and Wong, 2004; Robas and Fidock, 2005).
Materials and Reagents
10-cm cell culture-treated petri dishes (Corning, Falcon, catalog number: 353003)
Cell culture treated white opaque 384-well plate small volume (Greiner Bio One, catalog number: 784080)
Non-treated 96-well V-bottom plate 360 µl (BrandTech Scientific, catalog number: 781601)
Sterile 10- and 25-ml serological pipettes (Fisherbrand, catalog numbers: 14955234 [10 ml], 14955235 [25 ml])
Sterile 1.5-ml microcentrifuge (Fisherbrand, Basix, catalog number: 509GRDSERV)
Sterile 15-ml conical centrifuge tubes (Corning, Falcon, catalog number: C352096)
Sterile 50-ml conical centrifuge tubes (Corning, Falcon, catalog number: C352070)
Sterile 25-ml pipet basin (Fisherbrand, catalog number: 13681509)
Sterile 60-ml syringe with luer lock (Fisherbrand, catalog number: 14955461)
Sterile Uniflo Syringe Filters 0.22 µm PVDF (GE Healthcare, Whatman, catalog number: 99132502)
HEK293 cells (ATCC, catalog number: CRL-1573)
DMEM (Wisent Bioproducts, catalog number: 319-005-CL)
Fetal bovine serum (FBS, Wisent Bioproducts, catalog number: 080-150)
1 M HEPES solution (Wisent Bioproducts, catalog number: 330-050-EL)
200 mM L-Glutamine solution (Wisent Bioproducts, catalog number: 609-065-EL)
100x Penicilin-Streptomicyn solution (Wisent Bioproducts, catalog number: 450-200-EL)
1x PBS (Wisent Bioproducts, catalog number: 311-010-CL)
Trypsin 0.25%-EDTA 2.21 mM (Wisent Bioproducts, catalog number: 325-043-CL)
Opti-MEM (Gibco, catalog number: 31985062)
Lipofectamine 3000 (Invitrogen, catalog number: L3000001)
P3000 reagent (Invitrogen, includeed with Lipofectamine 3000)
Poly-L-Lysine Hydrobromide, 25 mg (Sigma-Aldrich, catalog number: P1274-25MG)
Moxi Z cell count cassettes Type M (Orflo, catalog number: MXC001)
IP-One–Gq kit 20,000 points (PerkinElmer, Cisbio, catalog number: 62IPAPEC)
Poly-L-Lysine 0.1 mg/ml solution (see Recipes)
Complete DMEM (media for HEK293 cells) (see Recipes)
Equipment
Moxi Z mini automated cell counter (Orflo, catalog number: MXZ001)
8-channel 10-100 µl multipipette (Eppendorf, Research plus, catalog number: 3125000036)
Single channel repeater pipette (Eppendorf, Repeater M4, catalog number: 4982000322)
HTRF filter set (λex. 320 nm, λem.1 620 nm, λem.2 665 nm)
HTRF compatible multi-mode plate reader (Tecan, GENios Pro)
Software
XFluor4 Excel Macro (Tecan Application to control the GENios Pro plate reader, Tecan)
Excel 2016 (Microsoft Office, https://products.office.com)
Prism8 (GraphPad, https://www.graphpad.com)
Procedure
-
384-well plate coating (under a biosafety cabinet)
Pour Poly-L-Lysine solution at 0.1 mg/ml into a 25-ml sterile pipet basin.
Pipet 25 µl of 0.1 mg/ml Poly-L-Lysine solution (using standard sterile tips) and fill up each well of a cell culture treated white opaque small volume 384-well plate.
Incubate at room temperature for 15 min with the lid on the 384-well plate (not light sensitive).
Remove Poly-L-Lysine from the cell culture plate using the multichannel pipet set to 50 µl.
Rinse the 384-well plate twice by pipetting 25 µl of sterile water in each well, remove liquid by inversion.
Allow the plate to dry under the biosafety cabinet without the lid on for at least 30 min or until the wells appears to be completely dry (maximum 2 h).
Store Poly-L-Lysine-coated plates with the lid on to keep them sterile at room temperature until use (not light sensitive, see Note 1).
-
Cell preparation for transfection (under a biosafety cabinet)
Rinse HEK293 cells with 10 ml of 1x PBS by gently pipetting down the PBS on the side of the dish to avoid detaching cells. Remove PBS by aspiration or inversion.
Add 1 ml of trypsin 0.25%-EDTA 2.21 mM in each petri dish and ensure that all the area of the dish is covered by trypsin solution.
Incubate for 1 min at 37 °C.
Add 10 ml of complete DMEM to each petri dish and detach cells by doing up-and-down movements with a 10-ml pipet.
Pipet 75 µl of cell suspension to use for counting with the Moxi Z cell counter.
Prepare two 10-cm petri dishes containing 3 x 10⁶ cells in 10 ml of complete DMEM per complete 384-well plate to be transfected.
Incubate cells at 37 °C in a humidified chamber under 5% CO2 for 48 h.
-
Cell transfection and plating into 384-well plate (under a biosafety cabinet)
-
Prepare transfections, for each transfection (1.5 µg of DNA for 32 wells):
Add 150 µl of Opti-MEM into a sterile 1.5 ml micro-centrifuge tube.
Add 1.5 µg of plasmidic DNA coding for the desired 7TMR (either wild-type or mutant).
Add 3 µl of P3000 reagent.
Mix by flicking the tube with your finger to ensure an even distribution of the DNA and P3000 reagent.
Add 3 µl of Lipofectamine 3000 reagent and mix by flicking the tube with your finger.
Incubate at room temperature for 15 to 30 min to allow formation of the transfection complexes (not light sensitive).
-
Prepare cell suspension for plating using cells prepared in Procedure B (see Notes 2 and 3):
Rinse HEK293 cells with 10 ml of 1x PBS as described in Step B1.
Add 1 ml of trypsin 0.25%-EDTA 2.21 mM in each petri dish and ensure that all the area of the dish is covered by trypsin solution.
Incubate for 1 min at 37 °C.
Add 5 ml of complete DMEM to each petri dish and detach cells by doing up-and-down movements with a 10-ml pipet.
Pipet 75 µl of cell suspension to use for counting with the Moxi Z cell counter.
Prepare 9 ml of cell suspension at 1.5 x 10⁶ cells/ml in complete DMEM for each complete 384-well plate to be transfected into a sterile 50-ml conical tube.
Mix the cell suspension gently to ensure an eve distribution of the cells.
-
Transfection and plating of cells:
Transfer 700 µl of cell suspension prepared at Step C2 into a 1.5 ml micro-centrifuge tube prepared at Step C1.
Mix by flicking the tube with your finger.
Transfer the content of the tube into a sterile 25-ml pipet basin.
Transfer 20 µl of the cell suspension from the pipet basin to the 384-well plate using a 10-100 µl 8 channel multi-pipette.
Repeat step d. until two columns of the plate are filled with cells
Ensure that there is no air bubble trapped at the bottom of the well that could prevent cell adhesion.
Repeat the operation from steps a. to f. with other transfections.
Incubate cells at 37 °C in a humidified chamber under 5% CO2 for 48 h.
-
-
IP-One assay
-
Reagent preparation (in case of a new IP-One kit):
Reconstitute the IP1 Tb Cryptate Antibody with 3 ml of ddH2O, mix by vortexing gently, and prepare aliquots of 50 µl into 1.5 ml micro-centrifuge tubes.
Reconstitute the IP1 d2 Reagent with 3 ml of ddH2O, mix by vortexing gently, and prepare aliquots of 50 µl into 1.5 ml micro-centrifuge tubes.
Reconstitute the IP-One–Gq standard with ddH2O according to the tube label, mix by vortexing gently, and prepare aliquots of 25 µl into 1.5 ml micro-centrifuge tubes.
Store the aliquots of IP1 Tb Cryptate Antibody, IP1 d2 Reagent, and IP-One - Gq standard at -20 °C until use (see Note 4).
-
Agonist preparation (see Note 5):
Prepare 7 ml of 1x stimulation buffer by diluting 1.4 ml of 5x stimulation buffer (supplied with the kit) with 5.6 ml of ddH2O into a 15-ml conical tube.
Prepare serial dilution of the 7TMR agonist ranging from 10-5 to 10-11 M in 1x stimulation buffer using the first seven rows (A to G) of a V-bottom 96-well plate (dilutions in multiple columns are required to have enough volume to fill the entire 384-well plate).
Fill the last row with 1x stimulation buffer (non-stimulated control).
-
Cell stimulation:
Remove the cell culture media by inversion of the 384-well plate over a waste receptacle.
Wash cells using 25 µl of room temperature 1x PBS in each well using a 10-100 µl 8 channel multi-pipette.
Remove 1x PBS by inversion of the 384-well plate over a waste receptacle.
Ensure that all wells are free of remaining liquid (if so, invert and shake gently the plate again until all wells are free of liquid).
Add 14 µl of ligand dilution into each well of the 384-well plate using a 10-100 µl 8 channel multi-pipette.
Put the lid on the 384-well plate and incubate for 30 min at 37 °C.
-
Preparation of the IP1 standard curve:
Prepare the Std 7 solution by adding 425 µl of 1x stimulation buffer into a 25 µl aliquot tube of IP-One–Gq standard and mix by vortexing.
Prepare Std 6 by diluting 50 µl of Std 7 into 150 µl of 1x stimulation buffer into a 1.5 ml micro-centrifuge tube and mix by vortexing.
Prepare Std 5, 4, 3, 2, and 1 by repeating the same dilution process as described in b.
Std 0 is a positive control and is not a dilution of Std 1 but only 1x stimulation buffer.
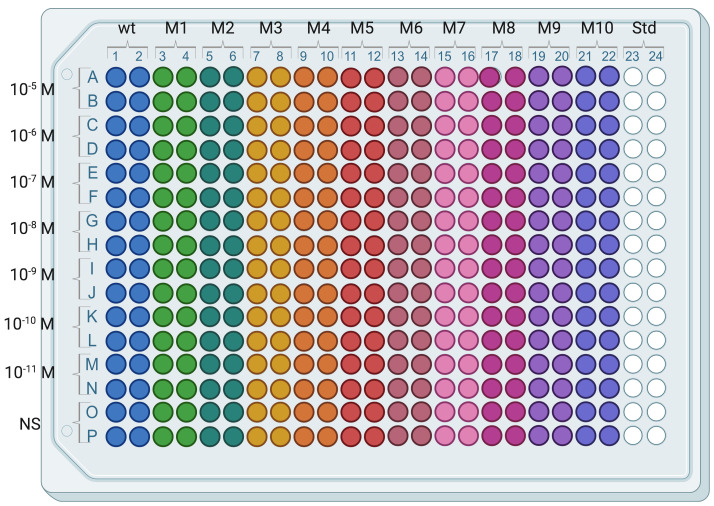
Dispense 14 µl of each Std solution (from Std 0 to Std 7) in duplicate in a 384-well plate (Figure 3).
-
Cell lysis and detection reaction:
Prepare diluted IP1 Tb Cryptate Antibody and diluted IP1 d2 Reagent by adding 1 ml of lysis & detection buffer 6 (supplied in the kit) to a 50 µl aliquot prepared at Step D1 (1.3 ml of each diluted reagent are necessary for an entire 384-well plate).
Dispense 3 µl of diluted IP1 d2 Reagent into each well (including the standard curve wells) of the 384-well plate using a single channel repeater pipette mounted with a new 100-µl combitip.
Dispense 3 µl of diluted IP1 Tb Cryptate Antibody into each well (including the standard curve wells) of the 384-well plate using a single channel repeater pipette mounted with a new 100-µl combitip.
Incubate the plate on a nutating mixer for 1 to 18 h at room temperature (see Note 6).
-
HTRF Readout:
Read the fluorescence emission from the donor and the energy transfer to the acceptor using a HTRF compatible multi-mode plate reader.
Setup the reader using the settings from Cisbio for HTRF Terbium cryptate donor/Red acceptor readout. Settings for the Tecan GENios Pro plate reader and the link to retrieve setup instructions for HTRF compatible reader are available in the note section (see Note 7).
-
Figure 3. Typical arrangement of an assay plate.
Wild type receptor-expressing cells (wt) are in columns 1 and 2 and mutant receptor-expressing cells (M1, M2, …, M10) are distributed in subsequent columns pairs except columns 23 and 24 used for IP-One standard curve.
Data analysis
Calculate the HTRF ratio each condition (wild type and mutants) by dividing the signal at 665 nm (acceptor) by the signal at 620 nm (donor) into Microsoft Excel.
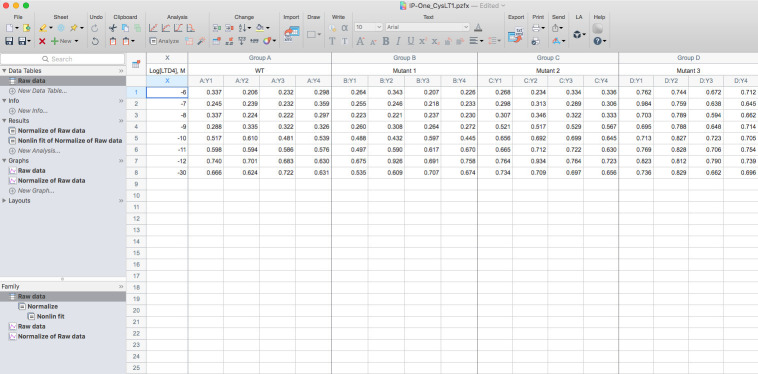
Copy the calculated HTRF ratio into a new XY data table using Y: Enter 4 replicate values in side-by-side sub columns into Prism8 (Figure 4).
Use the Normalize function of Prism 8 to normalize all datasets, enter the mean HTRF ratio of the wild type receptor stimulated with the highest concentration of agonist to define the 100% of activation and the mean HTRF ratio of the wild type receptor corresponding to the non-stimulated (stimulation buffer only) to define the 0% of activation.
Analyze the normalized response by fitting a non-linear regression: in the Dose-response–Stimulation menu, choose the log(agonist) vs. response (three parameters) fit (Figure 5).
Retrieve the potency values (EC50) of the agonist for each condition in the Results–Nonlin fit tab.
Calculate the maximal efficacy values (Emax) of the agonist for each condition by analyzing the normalized values table with the Row means with SD or SEM and choosing the Row mean with SEM option.
EC50 and Emax values (and their corresponding SEM) of each independent experiment can be combined in a new Prism8 XY table in which the Y: Enter and plot error values already calculated elsewhere (Enter: Mean with SEM). Analyze this table by using the Descriptive statistics and ticking only Mean, SD, SEM.
Figure 4. Screenshot example of the raw data of IP1 production for the wild type and mutants of the human CysLT1 receptor.
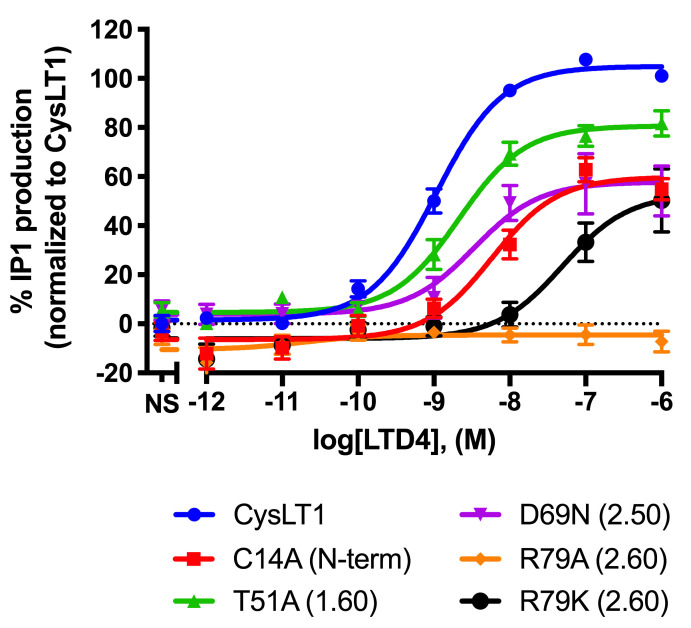
Figure 5. Effect of LTD4 on IP1 production for the wild type and 5 mutants of the human CysLT1 receptor.
IP1 production following stimulation of the wt and 5 mutants of the hCysLT1 receptor transfected using the protocol detailed in this manuscript and published in Luginina (2019). Results were normalized to the wt receptor as described and represent the mean % IP1 production ± SEM of three independent experiments each done in quadruplicate.
Notes
Poly-L-Lysine solution can be discarded or reused to coat another plate (we do not recommend coating more than 4 plates with the same Poly-L-Lysine solution). Poly-L-Lysine-coated plates can be stored at room temperature for up to 2 months or a 4 °C for up to 6 months.
We recommend having cells that are in an exponential growth phase for best transfection results. We observed a high transfection efficacy when cells’ diameter was 14 µm or higher as determined by the Moxi Z automated cell counter.
Preparation of cells for transfection and plating (Step C2) can be done during the incubation time for formation of transfection complexes (Step C1f).
IP1 Tb Cryptate Antibody, IP1 d2 Reagent, and IP-One–Gq standard stored at -20 °C are stable for 3 months according to the manufacturer however, we obtained similar results with aliquots stored for up to 1 year.
For stimulation, if the use of 1x stimulation buffer is not suitable, it could be replaced by cell culture media without FBS or antibiotics, or Hank’s Balanced Salt Solution. However, to inhibit the degradation of IP1 it is mandatory to add lithium chloride at a final concentration of 50 mM.
The HTRF can be read after an incubation of 1 h, however the signal is stable for 18 h when the plate is kept at room temperature. In case of multimode reader fail or malfunction after the first read, the plate can be read again without loss in HTRF intensity. In the rare event of HTRF reader break or inoperability, the plate can be sealed with a plastic seal and frozen at -20 °C for up to 2 months (a slight loss of signal can occur after thawing).
-
Setup used for HTRF readout with Tecan GENios Pro multi-mode plate reader:
-
First measurement:
Excitation: 320 ± 25 nm
Emission: 620 ± 10 nm
-
Second measurement:
Excitation: 320 ± 25 nm
Emission: 665 ± 10 nm
Gain: Optimal
Read mode: Top
Filter switch mode: per Plate
Mirror selection: Dichroic 3 (e.g., FI)
Integration:
Lag time: 150 µs
Integration time: 500 µs
Read:
Number of reads: 10
Time between move and read: 0 ms
-
A list of HTRF compatible plate reader and readout setup instructions is available at http://www.cisbio.com/compatible-readers.
Recipes
-
Poly-L-Lysine 0.1 mg/ml solution
Dissolve 5 mg of Poly-L-Lysine Hydrobromide into 50 ml of ddH2O and vortex
Filter sterilize the solution into a 50-ml conical tube using a sterile 60-ml syringe and a sterile 0.22 µm filter under a biosafety cabinet
-
Complete DMEM (media for HEK293 cells)
DMEM supplemented with 10% fetal bovine serum, 2 mM L-Glutamine, 100 U/ml of penicillin-streptomycin, and 20 mM HEPES
Acknowledgments
This work has been funded by the Canadian Institutes of Health Research (CIHR, grant FDN-148413). ÉBO is the recipient of research fellowships from the Fond de recherche du Québec–Santé (FRQ-S, grant 255989) and from the CIHR (grant MFE-164740). RLB is the recipient of Ph.D. Scholarships from the FRQ-S and the Faculty of Medicine and Health Sciences of the Université de Sherbrooke. PS is the recipient of a Tier 1 Canada Research Chair in Neurophysiopharmacology of Chronic Pain and a member of the FRQ-S-funded Québec Pain Research Network (QPRN). Figures 1 and 2 were created with BioRender.com. This protocol is a detailed version of the protocol that has been successfully applied in the following original articles: Luginina et al. (2019) and Gusach et al. (2019).
Competing interests
The authors declare that they have no known competing financial interests or personal relationships which have, or could be perceived to have, influenced the work reported in this article.
Citation
Readers should cite both the Bio-protocol article and the original research article where this protocol was used.
References
- 1. Arkin M. R., Connor P. R., Emkey R., Garbison K. E., Heinz B. A., Wiernicki T. R., Johnston P. A., Kandasamy R. A., Rankl N. B. and Sittampalam S.(2004). FLIPR Assays for GPCR and Ion Channel Targets. In: Assay Guidance Manual. Sittampalam, G. S., Grossman, A., Brimacombe, K. et al. (Eds.). Bethesda(MD), Eli Lilly& Company and the National Center for Advancing Translational Sciences. [Google Scholar]
- 2. Cassutt K. J., Orsini M. J., Abousleiman M., Colone D. and Tang W.(2007). Identifying nonselective hits from a homogeneous calcium assay screen. J Biomol Screen 12(2): 285-287. [DOI] [PubMed] [Google Scholar]
- 3. Garbison K. E., Heinz B. A. and Lajiness M. E.(2004). IP-3/IP-1 Assays. In: Assay Guidance Manual. Sittampalam, G. S., Grossman, A., Brimacombe, K. et al. (Eds.). Bethesda(MD), Eli Lilly& Company and the National Center for Advancing Translational Sciences. [Google Scholar]
- 4. Gusach A., Luginina A., Marin E., Brouillette R. L., Besserer-Offroy E., Longpre J. M., Ishchenko A., Popov P., Patel N., Fujimoto T., Maruyama T., Stauch B., Ergasheva M., Romanovskaia D., Stepko A., Kovalev K., Shevtsov M., Gordeliy V., Han G. W., Katritch V., Borshchevskiy V., Sarret P., Mishin A. and Cherezov V.(2019). Structural basis of ligand selectivity and disease mutations in cysteinyl leukotriene receptors. Nat Commun 10(1): 5573. [DOI] [PMC free article] [PubMed] [Google Scholar]
- 5. Liu K., Titus S., Southall N., Zhu P., Inglese J., Austin C. P. and Zheng W.(2008). Comparison on functional assays for Gq-coupled GPCRs by measuring inositol monophospate-1 and intracellular calcium in 1536-well plate format. Curr Chem Genomics 1: 70-78. [DOI] [PMC free article] [PubMed] [Google Scholar]
- 6. Luginina A., Gusach A., Marin E., Mishin A., Brouillette R., Popov P., Shiriaeva A., Besserer-Offroy E., Longpre J. M., Lyapina E., Ishchenko A., Patel N., Polovinkin V., Safronova N., Bogorodskiy A., Edelweiss E., Hu H., Weierstall U., Liu W., Batyuk A., Gordeliy V., Han G. W., Sarret P., Katritch V., Borshchevskiy V. and Cherezov V.(2019). Structure-based mechanism of cysteinyl leukotriene receptor inhibition by antiasthmatic drugs. Sci Adv 5(10): eaax2518. [DOI] [PMC free article] [PubMed] [Google Scholar]
- 7. New D. C. and Wong Y. H.(2004). Characterization of CHO cells stably expressing a G alpha 16/z chimera for high throughput screening of GPCRs. Assay Drug Dev Technol 2(3): 269-280. [DOI] [PubMed] [Google Scholar]
- 8. Overington J. P., Al-Lazikani B. and Hopkins A. L.(2006). How many drug targets are there? Nat Rev Drug Discov 5(12): 993-996. [DOI] [PubMed] [Google Scholar]
- 9. Robas N. M. and Fidock M. D.(2005). Identification of orphan G protein-coupled receptor ligands using FLIPR assays. Methods Mol Biol 306: 17-26. [DOI] [PubMed] [Google Scholar]
- 10. Shehata M. A., Nohr A. C., Lissa D., Bisig C., Isberg V., Andersen K. B., Harpsoe K., Bjorkling F., Brauner-Osborne H. and Gloriam D. E.(2016). Novel agonist bioisosteres and common structure-activity relationships for the orphan g protein-coupled receptor GPR139. Sci Rep 6: 36681. [DOI] [PMC free article] [PubMed] [Google Scholar]
- 11. St-Pierre D., Cabana J., Holleran B. J., Besserer-Offroy E., Escher E., Guillemette G., Lavigne P. and Leduc R.(2018). Angiotensin II cyclic analogs as tools to investigate AT1R biased signaling mechanisms. Biochem Pharmacol 154: 104-117. [DOI] [PubMed] [Google Scholar]
- 12. Thomsen W. J. and Behan D. P.(2007). G Protein-Coupled Receptors. Taylor, J. B. and Triggle, D. J.(Eds.). In: Comprehensive Medicinal Chemistry II. Elsevier, Oxford, pp. 771-826. [Google Scholar]
- 13. Trinquet E., Bouhelal R. and Dietz M.(2011). Monitoring Gq-coupled receptor response through inositol phosphate quantification with the IP-One assay. Expert Opin Drug Discov 6(10): 981-994. [DOI] [PubMed] [Google Scholar]
- 14. Zhang J. Y., Kowal D. M., Nawoschik S. P., Dunlop J., Pausch M. H. and Peri R.(2010). Development of an improved IP1 assay for the characterization of 5-HT2C receptor ligands . Assay Drug Dev Technol 8(1): 106-113. [DOI] [PubMed] [Google Scholar]


