

Abstract
Huntington disease (HD) is a neurodegenerative disease caused by a CAG trinucleotide repeat expansion in the huntingtin (HTT) gene. Therapeutics that lower HTT have shown preclinical promise and are being evaluated in clinical trials. However, clinical assessment of brain HTT lowering presents challenges. We have reported that mutant HTT (mHTT) in the CSF of HD patients correlates with clinical measures, including disease burden as well as motor and cognitive performance. We have also shown that lowering HTT in the brains of HD mice results in correlative reduction of mHTT in the CSF, prompting the use of this measure as an exploratory marker of target engagement in clinical trials. In this study, we investigate the mechanisms of mHTT clearance from the brain in adult mice of both sexes to elucidate the significance of therapy-induced CSF mHTT changes. We demonstrate that, although neurodegeneration increases CSF mHTT concentrations, mHTT is also present in the CSF of mice in the absence of neurodegeneration. Importantly, we show that secretion of mHTT from cells in the CNS followed by glymphatic clearance from the extracellular space contributes to mHTT in the CSF. Furthermore, we observe secretion of wild type HTT from healthy control neurons, suggesting that HTT secretion is a normal process occurring in the absence of pathogenesis. Overall, our data support both passive release and active clearance of mHTT into CSF, suggesting that its treatment-induced changes may represent a combination of target engagement and preservation of neurons.
SIGNIFICANCE STATEMENT: Changes in CSF mutant huntingtin (mHTT) are being used as an exploratory endpoint in HTT lowering clinical trials for the treatment of Huntington disease (HD). Recently, it was demonstrated that intrathecal administration of a HTT lowering agent leads to dose-dependent reduction of CSF mHTT in HD patients. However, little is known about how HTT, an intracellular protein, reaches the extracellular space and ultimately the CSF. Our findings that HTT enters CSF by both passive release and active secretion followed by glymphatic clearance may have significant implications for interpretation of treatment-induced changes of CSF mHTT in clinical trials for HD.
Keywords: biomarker, cerebrospinal fluid, glymphatic system, Huntington disease, neurodegeneration, protein secretion
Introduction
Huntington disease (HD) is a fatal neurodegenerative disease caused by a polyglutamine encoding CAG repeat expansion in the HTT gene (1993). The resulting mutant huntingtin (mHTT) protein disrupts many cellular processes, ultimately leading to neurodegeneration (for review, see Caron et al., 2018). Numerous preclinical studies have demonstrated that lowering HTT in the brain can prevent or even reverse HD-like behavioral and neuropathological phenotypes in rodent models of HD (Harper et al., 2005; Rodriguez-Lebron et al., 2005; Wang et al., 2005; Machida et al., 2006; DiFiglia et al., 2007; Franich et al., 2008; Kordasiewicz et al., 2012; Stanek et al., 2013, 2014; Southwell et al., 2018; Caron et al., 2020), leading to advancement of HTT lowering agents into clinical trials for the treatment of HD (NCT03761849, NCT03225833, NCT03225846, NCT04120493). Clinical translation of HTT lowering therapies has necessitated the identification of biomarkers to assess HTT target engagement in the CNS.
We have previously developed assays to measure mHTT in the CSF (Southwell et al., 2015; Wild et al., 2015) and demonstrated that lowering mHTT in the CNS of HD mice is reflected by a correlative decrease in CSF mHTT (Southwell et al., 2015). Consequently, a dose-dependent reduction of CSF mHTT following treatment with an antisense oligonucleotide (ASO) targeting HTT provided evidence for HTT target engagement in the first human trial of a HTT lowering therapy (Tabrizi et al., 2019). We have also demonstrated that CNS cells derived from nestin-expressing neural progenitors are a major source of mHTT in the CSF (Southwell et al., 2015). However, little is known about the mechanisms by which this purported intracellular protein enters the extracellular space and ultimately the CSF. Understanding this process will be necessary for accurate interpretation of therapy-induced changes in CSF mHTT and its application as a biomarker.
Inclusion bodies of aggregated mHTT are present both intracellularly (DiFiglia et al., 1997) and in the extracellular space of postmortem HD brain tissue (Cicchetti et al., 2014). One possible mechanism of extracellular mHTT deposition is passive release from degenerating and dying cells over disease progression. This is supported by the findings that CSF mHTT concentration increases with disease stage and correlates with motor and cognitive symptom severity (Southwell et al., 2015; Wild et al., 2015) as well as CSF concentrations of tau and neurofilament light chain (NfL), which are associated with neurodegeneration (Constantinescu et al., 2009, 2011; Wild et al., 2015; Rodrigues et al., 2016; Byrne et al., 2017, 2018). Furthermore, we have previously shown that inducing acute brain injury in mice with quinolinic acid (QA) causes a transient increase in CSF mHTT during the period of neuron injury or death (Southwell et al., 2015). Together, these data suggest that CSF mHTT originates from passive release from dying cells.
In addition to passive release, there is evidence that soluble and aggregated mHTT may be actively transferred from cells of origin through synaptic vesicle exocytosis (Pecho-Vrieseling et al., 2014; Babcock and Ganetzky, 2015), nanotubes (Costanzo et al., 2013), and extracellular vesicles/exosomes (Jeon et al., 2016; Zhang et al., 2016) into neighboring cells. However, these intercellular transfer mechanisms do not explain extracellular release. Recently, it was shown that HTT can be secreted from primary neurons and mouse striatal-like cells via a late endosomal/lysosomal (LE/Lys) unconventional secretory pathway (Trajkovic et al., 2017). Active secretion, therefore, provides an alternate mechanism for extracellular release of HTT. However, an additional mechanism would then be required to move interstitial HTT into the CSF.
The glymphatic system is a waste clearance mechanism that removes extracellular solutes from the brain (Iliff et al., 2012). This system relies on aquaporin-4 (AQP4) water channels localized at astrocyte perivascular endfeet to facilitate the bulk flow of CSF through the brain parenchyma allowing clearance of interstitial fluids and solutes (Iliff et al., 2012). Therefore, extracellular mHTT may exit the brain extracellular space through glymphatic clearance.
In this study, we have used multiple complementary in vitro and in vivo model systems in conjunction with inhibitors of LE/Lys-mediated secretion and glymphatic clearance to explore these active mechanisms in the clearance of HTT from the brain to the CSF. We show that, although neurodegeneration leads to increased mHTT in CSF, it is also released to the CSF in the absence of neurodegeneration. We demonstrate that HTT is secreted from healthy and HTT CAG expanded neurons in vitro, and that cellular secretion contributes to CSF mHTT in the CNS of HD model mice. Finally, we show that extracellular mHTT in the CNS is cleared to the CSF by the glymphatic system. These findings may be helpful for the interpretation of clinical CSF HTT lowering data and support a combinatorial biomarker strategy for accurate assessment of CNS HTT target engagement.
Materials and Methods
Animals
Experiments were performed using Hu97/18 (Southwell et al., 2013), YAC128 (Slow et al., 2003), YAC128 C6R (Graham et al., 2006), and control littermate mice of either sex. Animals were maintained under a 12 h light:12 h dark cycle in a clean barrier facility and given free access to food and water. Experiments were performed with the approval of the Animal Care Committee at the University of British Columbia (A16-0130, A20-0107) and Institute Animal Care and Use Committee at the University of Central Florida (17-35, 17-32, 18-13).
CSF collection
Mice were anesthetized with Avertin (2,2,2-tribromoethanol, Sigma Millipore, catalog #T48402) and secured in a stereotaxic frame (Stoelting). The ear bars were raised and the nose piece used to position the mice in a manner that would allow for a near 90° tilt of the head to access the cisterna magna. A 1 cm2 section of dorsal neck skin was removed, and muscle layers were completely dissected away to expose the cisterna magna, which was then cleaned and dried. A 50 ml Hamilton syringe with point style 2 with a 12° bevel was then lowered carefully into the cisterna magna ensuring the entire needle opening was inserted. CSF was slowly withdrawn at a rate of 10 µl/minute (min) using an UltraMicroPump with Micro4 controller (World Precision Instruments). CSF samples were collected in prechilled tubes, centrifuged, then flash frozen in liquid N2 before storage at −80°C.
Tissue collection and processing
Mice allotted for terminal molecular and biochemical analysis were anesthetized using Avertin, and CSF was collected into prechilled tubes as described above. Whole blood was then collected by cardiac puncture and placed into prechilled EDTA-coated tubes (Sarstedt, catalog #41.1395.105) on ice. Whole blood was then centrifuged at 4000 RCF for 10 min at 4°C, and plasma was removed, flash frozen in liquid N2, and stored at −80°C until use. Brains were removed and placed on ice for ∼1 min to increase tissue rigidity. Brains were then microdissected into different regions (striatum, cortex, hippocampus, cerebellum), flash frozen in liquid N2, and stored at −80°C until use. Peripheral tissues were also collected, flash frozen in liquid N2, and stored at −80°C until use.
Mice allotted for histology were perfused transcardially with PBS and 4% PFA. Brains were removed and postfixed in 4% PFA in PBS for 24 h at 4°C. The following day, brains were cryoprotected in 30% sucrose with 0.01% sodium azide. Once equilibrated, brains were divided into forebrain and cerebellum, and forebrains were frozen on dry ice, mounted in Tissue-TEK OCT embedding compound (Sakura), and cut via cryostat (Leica Microsystems, CM3050S) into a series of 25 μm coronal sections free-floating in PBS with 0.01% sodium azide.
Lentivirus study
Lentiviruses encoding either GFP or mHTT exon 1 with 103 glutamines (Qs) with 103 glutamines (Qs) and a C-terminal GFP tag (Southwell et al., 2009) were packaged at high titer by Applied Biological Materials. Intrastriatal (IS) lentivirus injections were performed as described previously (Southwell et al., 2009) with the following changes. Briefly, mice were anesthetized with isoflurane and secured into a stereotaxic frame. The scalp was shaved, sterilized with betaine and 70% ethanol, and an incision made along the midline. The skull was dried to enhance visibility of sutures and landmarks. A dental drill was used to make bilateral burr holes at 0.8 mm anterior and 1.8 mm lateral to bregma. A Hamilton syringe with a 30 gauge needle was loaded first with 3 μl of sterile saline and then with 2 μl of either virus diluted to 1E + 06 IU/µl titer in sterile saline. The needle was lowered to 3.5 mm below the surface through the burr hole and the virus injected at 0.5 μl/min using an UltraMicroPump with Micro4 controller. The needle was left in place for 5 min and then withdrawn slowly. This process was repeated for the other hemisphere. Biofluids and perfused brains were collected at different post-injection time points for immunoprecipitation followed by flow cytometry (IP-FCM) and immunohistochemical (IHC) analysis, respectively.
CAG repeat sizing
Genomic DNA was extracted and purified from mouse tail clippings using the DNeasy Blood & Tissue Kit (QIAGEN, catalog #69504). DNA was sent to Laragen for CAG trinucleotide repeat sizing of human HTT.
IS QA injection
IS QA injections were performed as previously described (Southwell et al., 2015). Briefly, mice were anesthetized with 150 mg/kg ketamine and 10 mg/kg xylazine and secured into a stereotaxic frame. Preparation of the scalp and incision were performed as above, and a unilateral burr hole was made at 0.8 mm anterior and 1.8 mm lateral to bregma. A Hamilton syringe with a 26 gauge needle loaded with 2 µl of QA at 25 nm was lowered to a depth of 3.5 mm through the burr hole, and the QA was injected at 0.5 µl/min using a micropump. The needle was left in place for 5 min and then withdrawn slowly.
Primary cell culture
Primary Hu97/18 and Hu18/18 forebrain neurons were established as previously described (Skotte et al., 2014). Briefly, embryonic brains were isolated at embryonic day 15.5-17.5 and placed into Hibernate-E medium (Invitrogen, catalog #A1247601) containing 0.5 mm GlutaMAX (Invitrogen, catalog #35050061) and 2% SM1 supplement (Stemcell Technologies, catalog #05711) at 4°C overnight to allow time for genotyping (Skotte et al., 2014). Hu97/18 or Hu18/18 combined cortical and striatal tissues were triturated to a single-cell suspension in Neurobasal Complete Medium (Neurobasal Medium, Invitrogen, catalog #21103049)) containing 100 U/ml penicillin-streptomycin (Invitrogen, catalog #15140163), 0.5 mm GlutaMAX, and 2% SM1 supplement and seeded in poly-D-lysine (Sigma Millipore, catalog #P7886) coated 24-well plates at a density of 2.5 × 10⁵ cells per well. Cells were fed 1/10th well volume of fresh Neurobasal Complete Medium every 3-4 d until day in vitro (DIV) 7.
Primary Hu97/18 and Hu18/18 forebrain astrocytes were cultured as previously described (Ehrnhoefer et al., 2018a). Briefly, postnatal day 0-1 pups were anesthetized by hypothermia, and brains were placed into Hibernate-E during genotyping as above. Hu97/18 or Hu18/18 combined cortical and striatal tissue was triturated to a single-cell suspension in DMEM high glucose (Invitrogen, catalog #11965092) containing 10% FBS, 100 U/ml penicillin-streptomycin, and 0.5 mm GlutaMax and seeded in a T75 flask. Media was changed 24 h later with remaining media exchanges occurring every 7 d. Once 90% confluence was reached, astrocyte cultures were purified by removing the loosely adherent top cell layers consisting mostly of oligodendrocytes and microglia. Cell morphology was observed to ensure that astrocytes were intact and free of contaminating cells before media aspiration and a wash with cold PBS. Astrocytes were then passaged and grown to 90%-95% confluence. Astrocytes were then triturated to a single-cell suspension in complete DMEM media and seeded in poly-D-lysine-coated 10 cm dishes at a density of 1 × 10⁶ cells per plate. Media was changed 24 h later with remaining media exchanges occurring every 7 d until 100% confluence was reached.
In vitro secretion studies
DIV 7 neurons and mature confluent astrocytes were used for secretion experiments. A full media change was performed to remove any proteins secreted during the culture period, and cells were treated with DMSO, 5 μm GW4869, or 100 μm phenyl(R)-(1-(3-(3,4-dimethoxyphenyl)-2,6-dimethylimidazo[1,2-b]pyridazin-8-yl)pyrrolidin-3-yl)-carbamate (PDDC; generous gift from Drs. Barbara Slusher and Camillo Rojas) in growth media. After 16 h of treatment, media was collected and centrifuged to eliminate cell debris, then concentrated through an ultracentrifugation column with a 10 kDa weight cutoff (Amicon Ultra-0.5 Centrifugal Filter Unit, Millipore, catalog #UFC501096) for 20 min at 14,000 RCF. Additionally, for astrocyte cultures, HTT was immunoprecipitated from culture media using HDB4E10 anti-HTT antibody (Bio-Rad, catalog #MCA2050) bound to magnetic protein G Dynabeads (Invitrogen, catalog #10004D). Cells were collected by scraping in cold PBS and pelleted by centrifugation for 5 min at 650 RCF. Cell pellets and concentrated or immunoprecipitated media were then analyzed by Western blotting as described below.
In vivo secretion studies
Mice received daily intraperitoneal injections of 10 mg/kg PDDC dissolved 5% w/v in DMSO (Sigma Millipore, catalog #D2650) and diluted in saline for 5 consecutive days. For the study of secretion in neurotoxic conditions, animals received instrastriatal QA or PBS injections as described above after 2 d of treatment. CSF, plasma, and forebrain hemispheres were collected as above 6 h post-injection on the final treatment day.
Purification of recombinant HTT proteins
Full-length (FL) HTT cDNAs were cloned into pFastBac1 vector (Invitrogen, catalog #10360014) containing an N-terminal FLAG tag followed by a TEV protease site and His tag. Recombinant FL HTT proteins (Q2, Q23, Q43, Q67, and Q78) were expressed in Sf9 cells using a Baculovirus protein expression system (Invitrogen). Cell pellets were resuspended in Buffer A (50 mm Tris-HCl, pH 8.0, 100 mm NaCl, protease inhibitor cocktail, Roche Diagnostics, catalog #11697498001, 5% glycerol) and lysed by repeated freeze-thaw cycles. The cell lysate was cleared by centrifugation at 39,000 × g for 2 h. The supernatant was incubated with M2 anti-FLAG beads (Sigma Millipore), and nonspecifically bound proteins were removed by washing with Buffer A. HTT proteins were then eluted with Buffer A containing 0.4 mg/ml FLAG peptide. The N-terminal FLAG tag was then removed with TEV protease in Buffer B (150 mm NaCl, 50 mm Tris-HCl, pH 8.0, 5% glycerol, 20 mm imidazole, 1 mm DTT, and 0.5 mm EDTA) for 16 h at 4°C. HTT proteins were further purified by Superdex200 26/60 columns (GE Healthcare) in a running buffer (150 mm NaCl, 20 mm HEPES-HCl, pH 7.5). Protein integrity and Q-length were validated by PAGE separation and Coomassie staining before use.
Recombinant huntingtin injections
For IS injections, mice were anesthetized with isoflurane and secured into a stereotaxic frame. Preparation of the scalp and incision were performed as above, and a unilateral burr hole was made at 0.8 mm anterior and 1.8 mm lateral to bregma. A Hamilton syringe with a 30 gauge needle was loaded with 500 ng of recombinant FL mHTT Q67 (Seong et al., 2010) diluted to a total volume of 1 µl in sterile PBS. The needle was lowered to 3.5 mm below the surface through the burr hole, and the protein was injected at 0.2 μl/min. The needle was left in place for 5 min post-injection and then withdrawn slowly. For intracerebroventricular (ICV) injections, 500 ng of recombinant FL mHTT Q67 (Seong et al., 2010) was diluted to a total volume of 10 μl in sterile PBS and administered as in Southwell et al. (2014). Briefly, mice were anesthetized with isoflurane and secured into a stereotaxic frame. Preparation of the scalp and incision were performed as above. A Hamilton syringe with 26 gauge needle loaded with mHTT was used to punch through the skull at 0.3 mm anterior and 1 mm lateral to bregma and lowered to 3 mm below the surface. The FL mHTT Q67 was injected over 10 s and the needle left in place for 2 min before slow withdrawal. For intravenous injections, animals were restrained in a mouse tail illuminator (Bioseb, catalog #MTI). The tail was sterilized with 70% ethanol and allowed to warm for 2 min on the illuminator to highlight the tail vein. An insulin syringe with a 31 gauge needle (BD Biosciences, catalog #320440) was loaded with 500 ng of recombinant FL mHTT Q67 diluted to a total volume of 100 µl in sterile PBS and injected into the tail vein as a bolus.
IHC
For evaluation of lentivirus distribution and neuron loss, a series of sections spaced 200 µm apart and spanning the striatum were costained with rabbit anti-GFP antibody (1:1000, Invitrogen, catalog #A-11122) and mouse anti-NeuN (1:1000. Millipore, catalog #MAB377). Primary antibodies were detected with goat anti-rabbit AlexaFluor-488 (1:500, Invitrogen, catalog #A-11008) and goat anti-mouse AlexaFluor-568 (1:500, Invitrogen, catalog #A-11004) secondary antibodies. Sections were then mounted using ProLong Gold Antifade mountant with DAPI (Thermo Fisher Scientific, catalog #P36931) and imaged with either 5× or 40× objectives (Carl Zeiss) using a Carl Zeiss Axioplan 2 microscope, Coolsnap HQ Digital CCD camera (Photometrics) and MetaMorph software (Molecular Devices).
For detection of degenerating neurons after QA treatment, Fluoro-Jade C (Biosensis, catalog #TR-100-FJ) staining was performed according to the manufacturer's protocol. Sections were mounted using ProLong Gold Antifade mountant with DAPI, and imaged with a 2.5× objective (Carl Zeiss) using a Carl Zeiss Axioplan 2 microscope as above.
For evaluation of recombinant HTT distribution in the striatum, a series of sections spaced 200 µm apart and spanning the striatum were stained sequentially with mouse anti-expanded mHTT primary antibody (MW1, deposited to the University of Iowa Developmental Studies Hybridoma Bank by Patterson, P.H., catalog #MW1) and detected with goat anti-mouse AlexaFluor-488 (1:500, Invitrogen, catalog #A32723) secondary antibody. Then sections were probed with mouse/rat anti-DARPP-32 (1:500, R&D Systems, catalog #MAB4230) and detected using goat anti-rat AlexaFluor-568 (1:500, Invitrogen, catalog #A-11077). Sections were mounted using ProLong Gold Antifade mountant with DAPI and imaged at 2.5× using a Carl Zeiss Axioplan 2 microscope as above.
Immunoblotting
Tissues and cell pellets were lysed through mechanical dissociation using a tissue homogenizer, sonicated for 3 s and triturated in lysis buffer (50 mm Tris, pH 8.0, 150 mm NaCl, 1% Igepal/NP40, 40 mm β-glycerophosphate, 10 mm NaF) containing protease inhibitors (1 mm Roche Complete mini EDTA free, 1 mm sodium orthovanadate, 1 mm PMSF, and 5 μm zVAD). Samples were then incubated on ice and vortexed every 5 min for 20 min. Lysates were then centrifuged for 15 min at 20,000 RCF, and protein concentrations were measured by DC assay. For HTT quantification, 40 μg of total protein from lysates or 500 µg of total protein from culture media was resolved on 10% low-BIS acrylamide gels (Carroll et al., 2011), transferred to 0.45 μm nitrocellulose, and probed with either mouse 1CU-4C8 anti-HTT (Thermo Fisher Scientific, catalog #MAB2166) or mouse HU-2E8 anti-HTT (Sigma Millipore, catalog #MAB2168) and rabbit anti-calnexin (Sigma Millipore, catalog #C4731) as a loading control. Primary antibodies were detected with IR dye 800CW goat anti-mouse (Rockland, catalog #610-131-007) and AlexaFluor 680 goat anti-rabbit (Invitrogen, catalog #A21076) labeled secondary antibodies. HTT band intensities from YAC128 and YAC128 C6R brain lysates were normalized to the calnexin loading control and then to the mean of the same allele in YAC128 samples on the same membrane. HTT band intensities from the media of secretion inhibitor-treated cells were normalized to the mean intensity from the same allele of HTT in the media of vehicle-treated cells on the same membrane. Recombinant FL HTT band intensities were normalized to the calnexin loading control and then to the mean of the 0.5 h time point signal on the same membrane. For AQP4 quantification, 100 μg of total protein was resolved on 12% BIS acrylamide gels and transferred to 0.2 μm nitrocellulose. Blots were then cut at 50 kDa, and the top portion was probed with rabbit anti-calnexin as a loading control and the bottom portion was probed with rabbit anti-AQP4 (Sigma Millipore, catalog #ABN411). Primary antibodies were detected with AlexaFluor-680 goat anti-rabbit labeled secondary antibody. For albumin, 10 μl of mouse CSF was resolved on 12% BIS acrylamide gels, transferred to 0.2 μm nitrocellulose, and probed with rabbit anti-albumin (Sigma Millipore, catalog #SAB2100099). Primary antibody was detected with IR dye 800CW goat anti-rabbit (Rockland, catalog #611-131-122) labeled secondary antibody. All blots were scanned using the LiCor Odyssey Infrared Imaging system. Densitometry on band intensities was performed using the LiCor Image Studio Lite software. HTT band intensities were normalized to calnexin loading control and then to the same allele for vehicle-treated cells or mice on the same membrane. AQP4 band intensities were normalized to the calnexin loading control and then to the mean of PBS-treated mice on the same membrane.
mHTTex1-GFP IP-FCM assay screen
An ultrasensitive mHTTex1-GFP IP-FCM assay for detection of mHTTex1-GFP was developed by screening mouse monoclonal MW1, rabbit polyclonal anti-GFP (Invitrogen, catalog #A-11122), and mouse monoclonal anti-GFP, GF28R (Invitrogen, catalog #MA5-15 256) in all 9 possible capture/probe combinations as previously described (Southwell et al., 2015) using lysates of HEK293 cells transfected with either mHTTex1-GFP or GFP. Strength of signal and specificity were assessed, and A11122/GF28R was selected as the best capture/probe pair for mHTTex1-GFP IP-FCM. However, compared with IP-FCM using only A-11 122 capture beads for IP followed by FCM for GFP intensity, it was determined that the native fluorescence of the GFP was sufficient for quantitation when samples were collected and prepared protected from light. Thus, this method was used for experimental quantitation of mHTTex1-GFP.
IP-FCM
Approximately 10,000 5 µm caboxylate-modified latex beads (Invitrogen, catalog #C37255) were coupled with capture antibodies; HDB4E10 anti-HTT (Invitrogen, catalog #MA5-16703) or A-11122 anti-GFP in 50 µl of NP40 lysis buffer (150 mm NaCl, 50 mm Tris, pH 7.4), Halt phosphatase (Thermo Fisher Scientific, catalog #78420), and Halt protease inhibitor cocktails (Thermo Fisher Scientific, catalog #78429, 2 mm sodium orthovanadate, 10 mm NaF, 10 mm iodoacetamide, and 1% NP40). Capture antibody coupled beads were then combined with 50 µg brain or cell lysates in triplicate, 10 µl of CSF, or 20 µl of plasma in triplicate in a 96-well V-bottom plate (Thermo Fisher Scientific, catalog #249944), brought to a total volume of 50 µl in NP40 lysis buffer, mixed well, and incubated overnight at 4°C. The next day, the plate was spun down for 1 min at 650 RCF and supernatant was removed. Beads were washed 3 times in 200 µl IP-FCM wash buffer (100 mm NaCl, 50 mm Tris, pH 7.4, 1% BSA, 0.01% NaN3). For measurement of mHTT, expanded polyQ antibody, MW1 was biotinylated using EZ-Link Sulfo-NHS-Biotin (Thermo Fisher Scientific, catalog #21217), and 50 µl of the diluted antibody was incubated with the HDB4E10 beads bound to mHTT for 2 h at 4°C. Beads were washed 3 times with 200 µl of IP-FCM wash buffer. Streptavidin-PE (BD Biosciences, catalog #554061) was prepared at 1:200 and 50 µl added to each well and incubated at room temperature protected from light for 30 min. Beads were washed 3 times with 200 µl of IP-FCM buffer, resuspended in 200 µl of IP-FCM wash buffer, and fluorescence intensity of ∼2000 beads per sample, either HDB4E10/MW1 mHTT bead complexes or A-11122 mHTTex1-GFP bead complexes were measured using an Acuri C6 flow cytometer (BD Biosciences). Median fluorescence intensity (MFI) of PE for mHTT or GFP for mHTTex1-GFP was measured for each sample to determine target protein levels. MFI of PE in biofluids, tissue lysates, and recombinant HTT was corrected for background signal and presented as either absolute MFI values or relative mHTT values. MFI of GFP was corrected for background auto-fluorescence using CSF from naive animals and presented as absolute MFI values.
Time-resolved Förster resonance energy transfer (TR-FRET)
Circulating mHTT protein in the plasma was measured by TR-FRET as previously described (Weiss et al., 2009) with adaptations as in Southwell et al. (2013). Briefly, 20 μl of plasma was mixed with 2 ng terbium cryptate (FRET donor)-labeled (Cisbio) BKP1 anti-HTT antibody and 20 ng of D2 dye (FRET acceptor)-labeled MW1 anti-expanded CAG antibody, in a white 384-well plate (Corning, catalog #CLS3706). After excitation at 340 nm, FRET was measured as the ratio of 665 nm (D2)/615 nm (terbium) emission. FRET signal was corrected for background signal using plasma from naive animals and presented as relative mHTT values.
NfL quantification
NfL was quantified in plasma samples using commercially available NF-Light kits on the ultrasensitive Simoa HD-1 analyzer (Quanterix). Plasma samples were diluted 40 times before loading into the HD-1 analyzer and then analyzed in duplicate as per the manufacturer's instructions. All samples were above the lower level of quantification (0.174 pg/ml).
ASO design and treatment
For the AQP4 ASO studies, a gapmer with a phosphorothioate-modified backbone and four locked nucleic acid modifications in each wing, complementary to the mouse Aqp4 transcript (5′-CAGTAACATCAGTTCGT-3′) was custom synthesized by QIAGEN (formerly Exiqon). For the HTT ASO studies, a gapmer with ay phosphorothioate-modified backbone and 5 locked nucleic acid modifications in each wing complementary to the human HTT transcript was used, as described by Southwell et al. (2015). For ASO treatments, molecules were diluted to the indicated concentration in sterile PBS in a total volume of 10 μl and administered by ICV injection as in Southwell et al. (2014).
Experimental design and statistical analyses
All statistical analyses were performed and graphs were generated using GraphPad Prism version 8 (GraphPad). All experiments involving animals included approximately the same number of male and female mice. The number of animals (biological replicates; N) used for each experiment is reported in the figure legends. All bar graphs (see Figs. 1–5, 7) are presented as scatter dot plots to demonstrate data complexity and variability. Group data from averages of either multiple independent trials (see Fig. 3) or animals (see Figs. 1–7) are represented as mean ± SEM. Alpha values of <0.05 were considered significant for all analyses. F or t statistics and degrees of freedom as well as exact p values for each statistical test are presented in the text and corresponding figure legends.
Figure 1.

Intracellular mHTT is cleared to the CSF during induced neuronal death. A, Graphical overview of experimental design where 2-month-old WT animals received bilateral IS injections with either GFP or mHTTex1-GFP lentiviruses, and CSF was collected at 1, 2, 3, 4, and 6 weeks post-injection for measurement of mHTT levels. B, IHC images showing that mHTTex1-GFP transgene expression is visible at 1 week post-injection, with expression dramatically increased at 4 weeks post-injection. B, Inset, High-magnification image at 4 weeks post-injection show both diffuse mHTTex1-GFP and mHTT inclusions as well as extensive staining for NeuN in the transduced striatum, demonstrating the presence of neurons. Arrowheads indicate mHTT inclusion bodies. B, Inset, In contrast, at 6 weeks post-injection, mHTTex1-GFP expression remains high and large mHTT inclusion bodies are apparent, whereas neurons are no longer present. C, IHC images of GFP control lentivirus show similar distribution and expression levels as mHTTex1-GFP lentivirus at 1 and 4 weeks post-injection. D, Quantification of GFP MFI in the CSF from GFP or mHTTex1-GFP injected animals at different intervals post-injection (N = 3-5 per time point). Two-way ANOVA: lentivirus treatment, p < 0.0001; time point, p = 0.0608; interaction, p = 0.0539. Sidak's multiple comparison test: **p = 0.0048; ***p = 0.0003. A.U., Arbitrary units of fluorescence; Weeks post-injection (W.P.I.).
Figure 5.
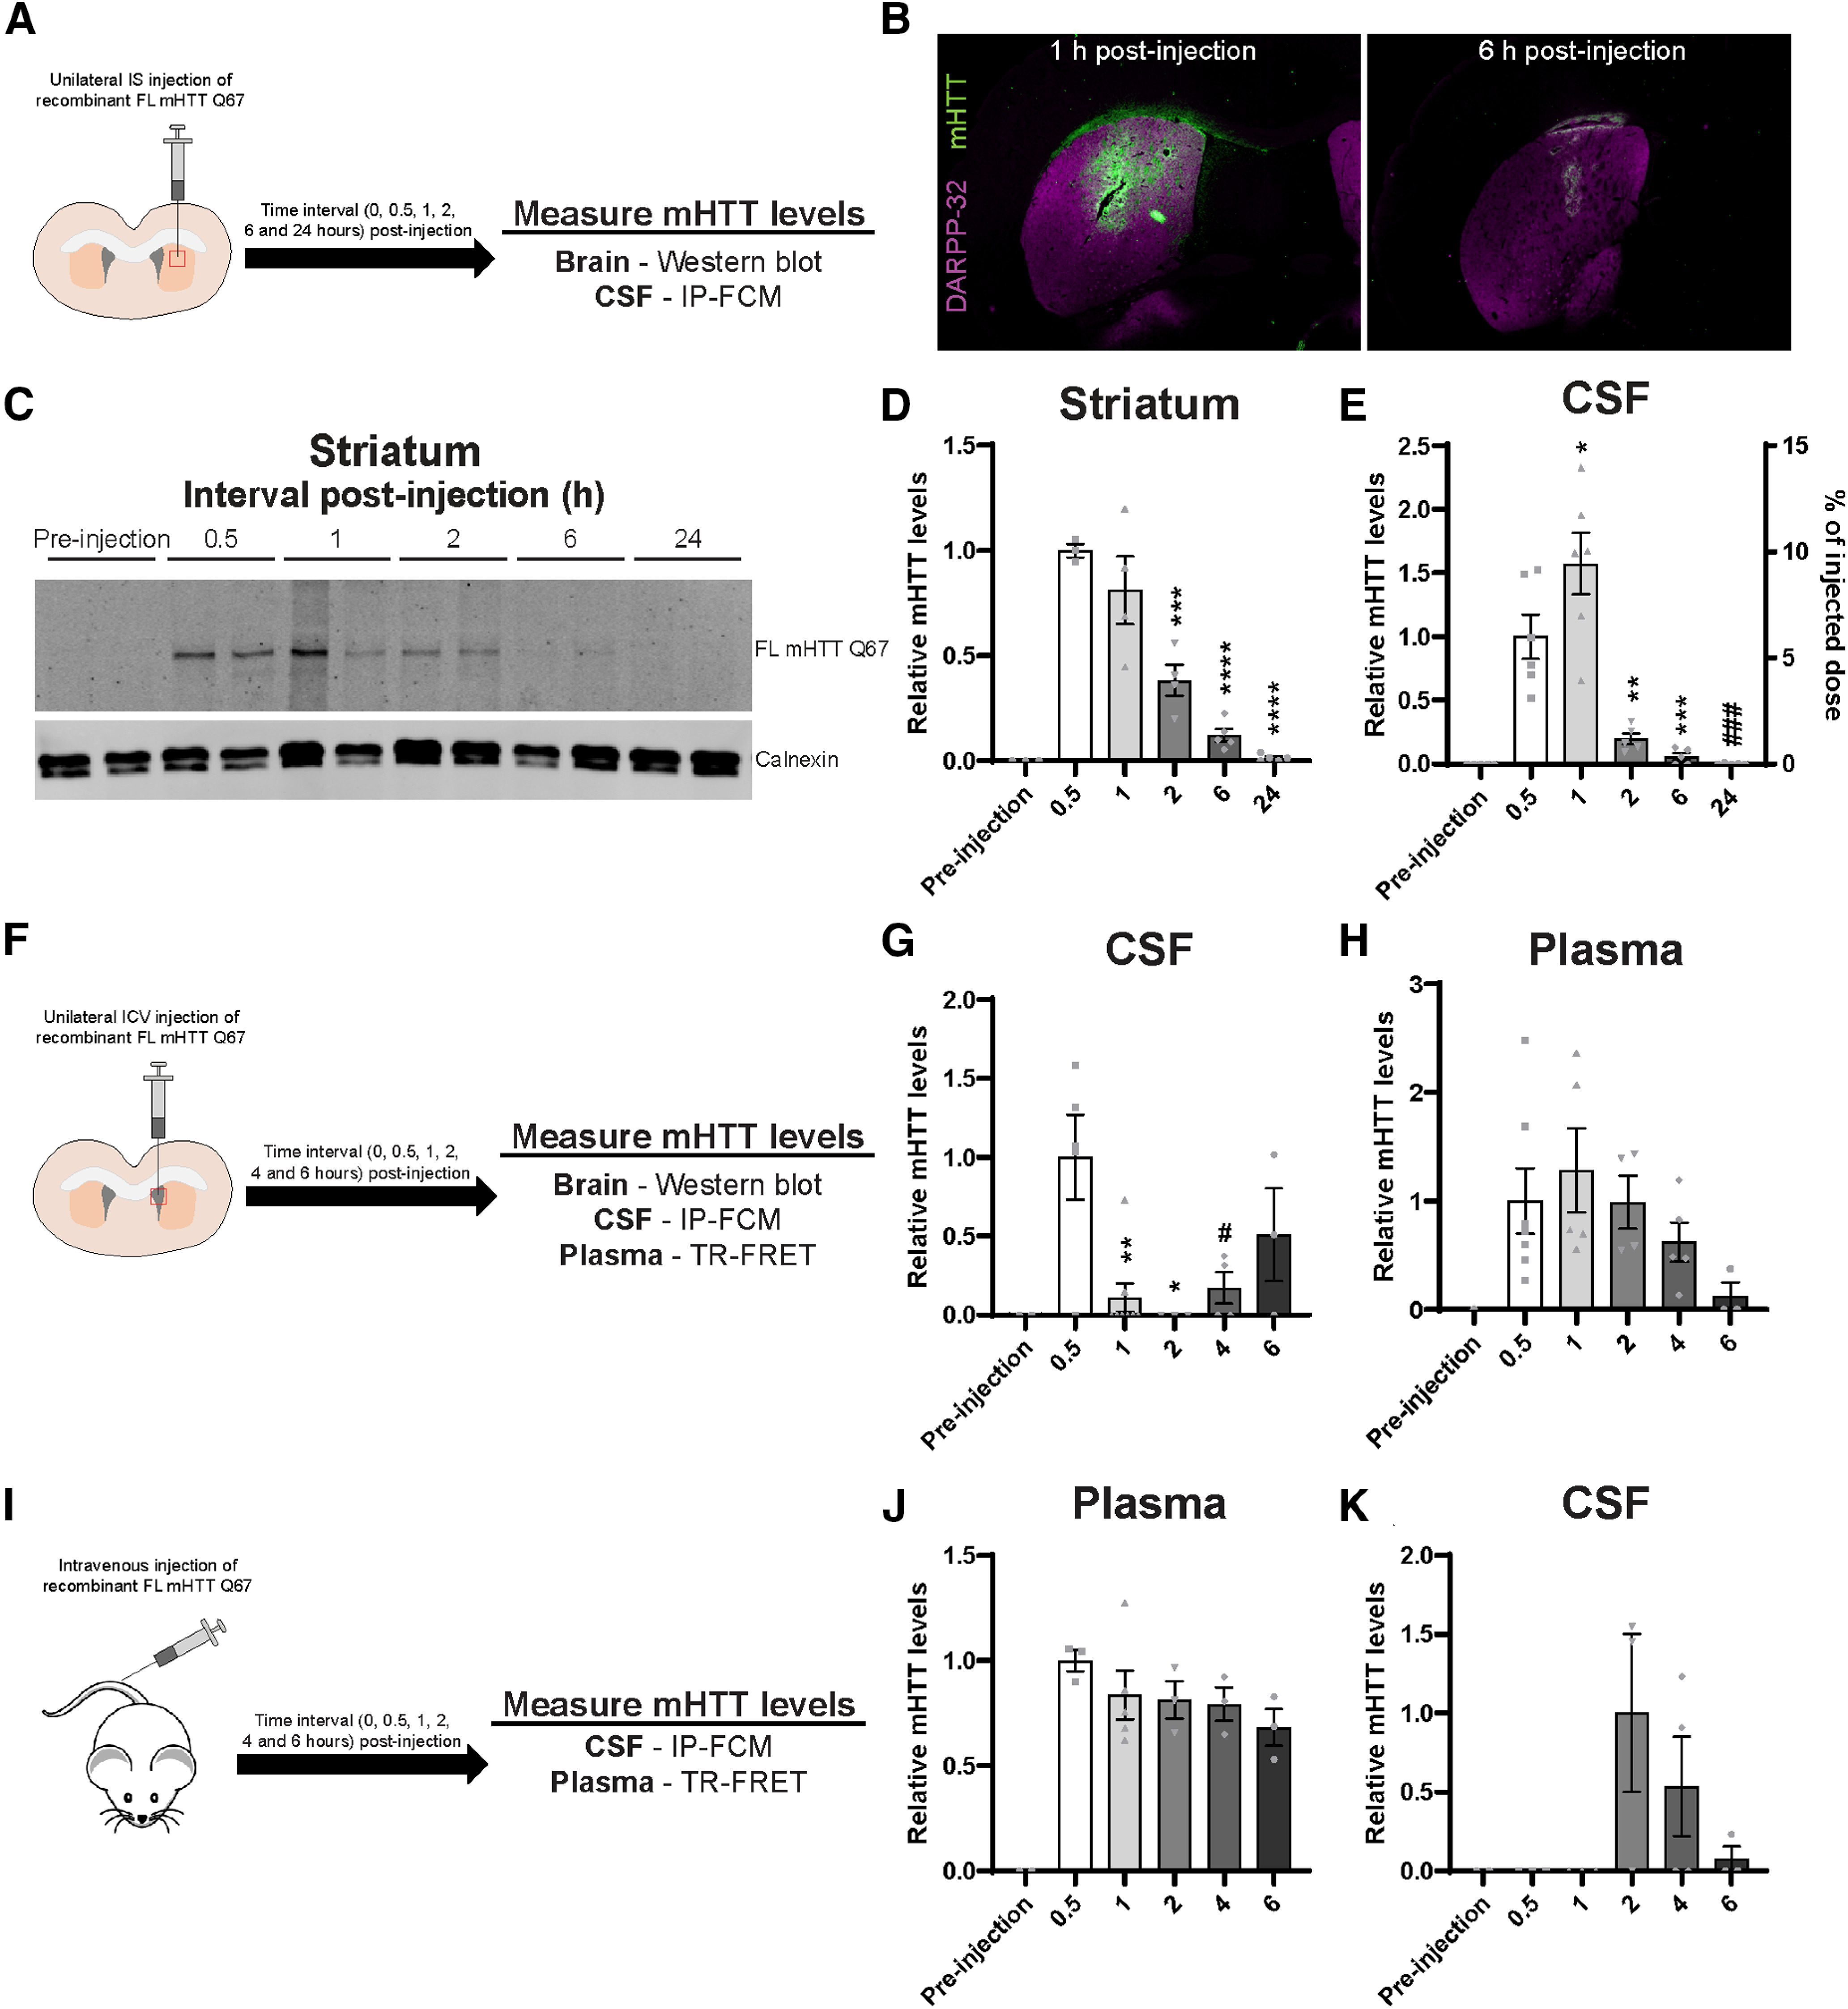
Exogenous extracellular FL mHTT Q67 is cleared from the brain to the CSF, then to the blood, and can reenter the CSF. A, Graphical overview of experimental design where 2-month-old WT animals received a unilateral IS injection with 500 ng of FL mHTT Q67; and brain and CSF were collected at different time points post-injection. B, IHC images of brains stained with MW1 antibody following IS injection (at 1 and 6 h) with FL mHTT Q67. DARPP-32 costaining was done to highlight the striatum. C, Representative Western blot probed with MAB2168 showing FL mHTT levels in the striatum at different intervals post-injection. D, E, Quantification of relative FL mHTT levels in the (D) striatum by immunoblot (N = 3–5 per time point; one-way ANOVA: p < 0.0001; Tukey's multiple comparison test of 0.5 h compared with other time points: ***p = 0.005; ****p < 0.0001), (E) CSF by IP-FCM (N = 5 or 6; one-way ANOVA: p < 0.0001; Tukey's multiple comparison test for relative mHTT levels at 0.5 h compared with other time points: *p = 0.0495; **p = 0.0041; ***p = 0.007; ###p = 0.0003). A second y axis showing the % injected dose that was cleared to the CSF (area under curve = 18.82 ± 4.319%) was added based on a standard curve generated using FL mHTT Q67 protein. F, Graphical overview of experimental design where WT animals received a unilateral ICV injection with 500 ng of FL mHTT Q67; and brain, CSF, and plasma were collected at different time points post-injection. G, H, Quantification of mHTT in the (G) CSF by IP-FCM (N = 4-8 per time point; one-way ANOVA: p = 0.0041; Tukey's multiple comparison test of 0.5 h compared with other time points: *p = 0.0146; **p = 0.0046; #p = 0.0319), and (H) plasma by TR-FRET (N = 4-8 per time point; one-way ANOVA: p = 0.1768) at different time points post-injection. I, Graphical overview of experimental design where WT animals received an intravenous bolus injection with 500 ng of FL mHTT Q67; and brain, plasma, and CSF were collected at different time points post-injection. J, K, Quantification of mHTT in the (J) plasma by TR-FRET (N = 3-5 per time point; one-way ANOVA: p = 0.0009) and (K) CSF by IP-FCM (N = 3 or 4 per time point; one-way ANOVA: p = 0.1167).
Figure 7.
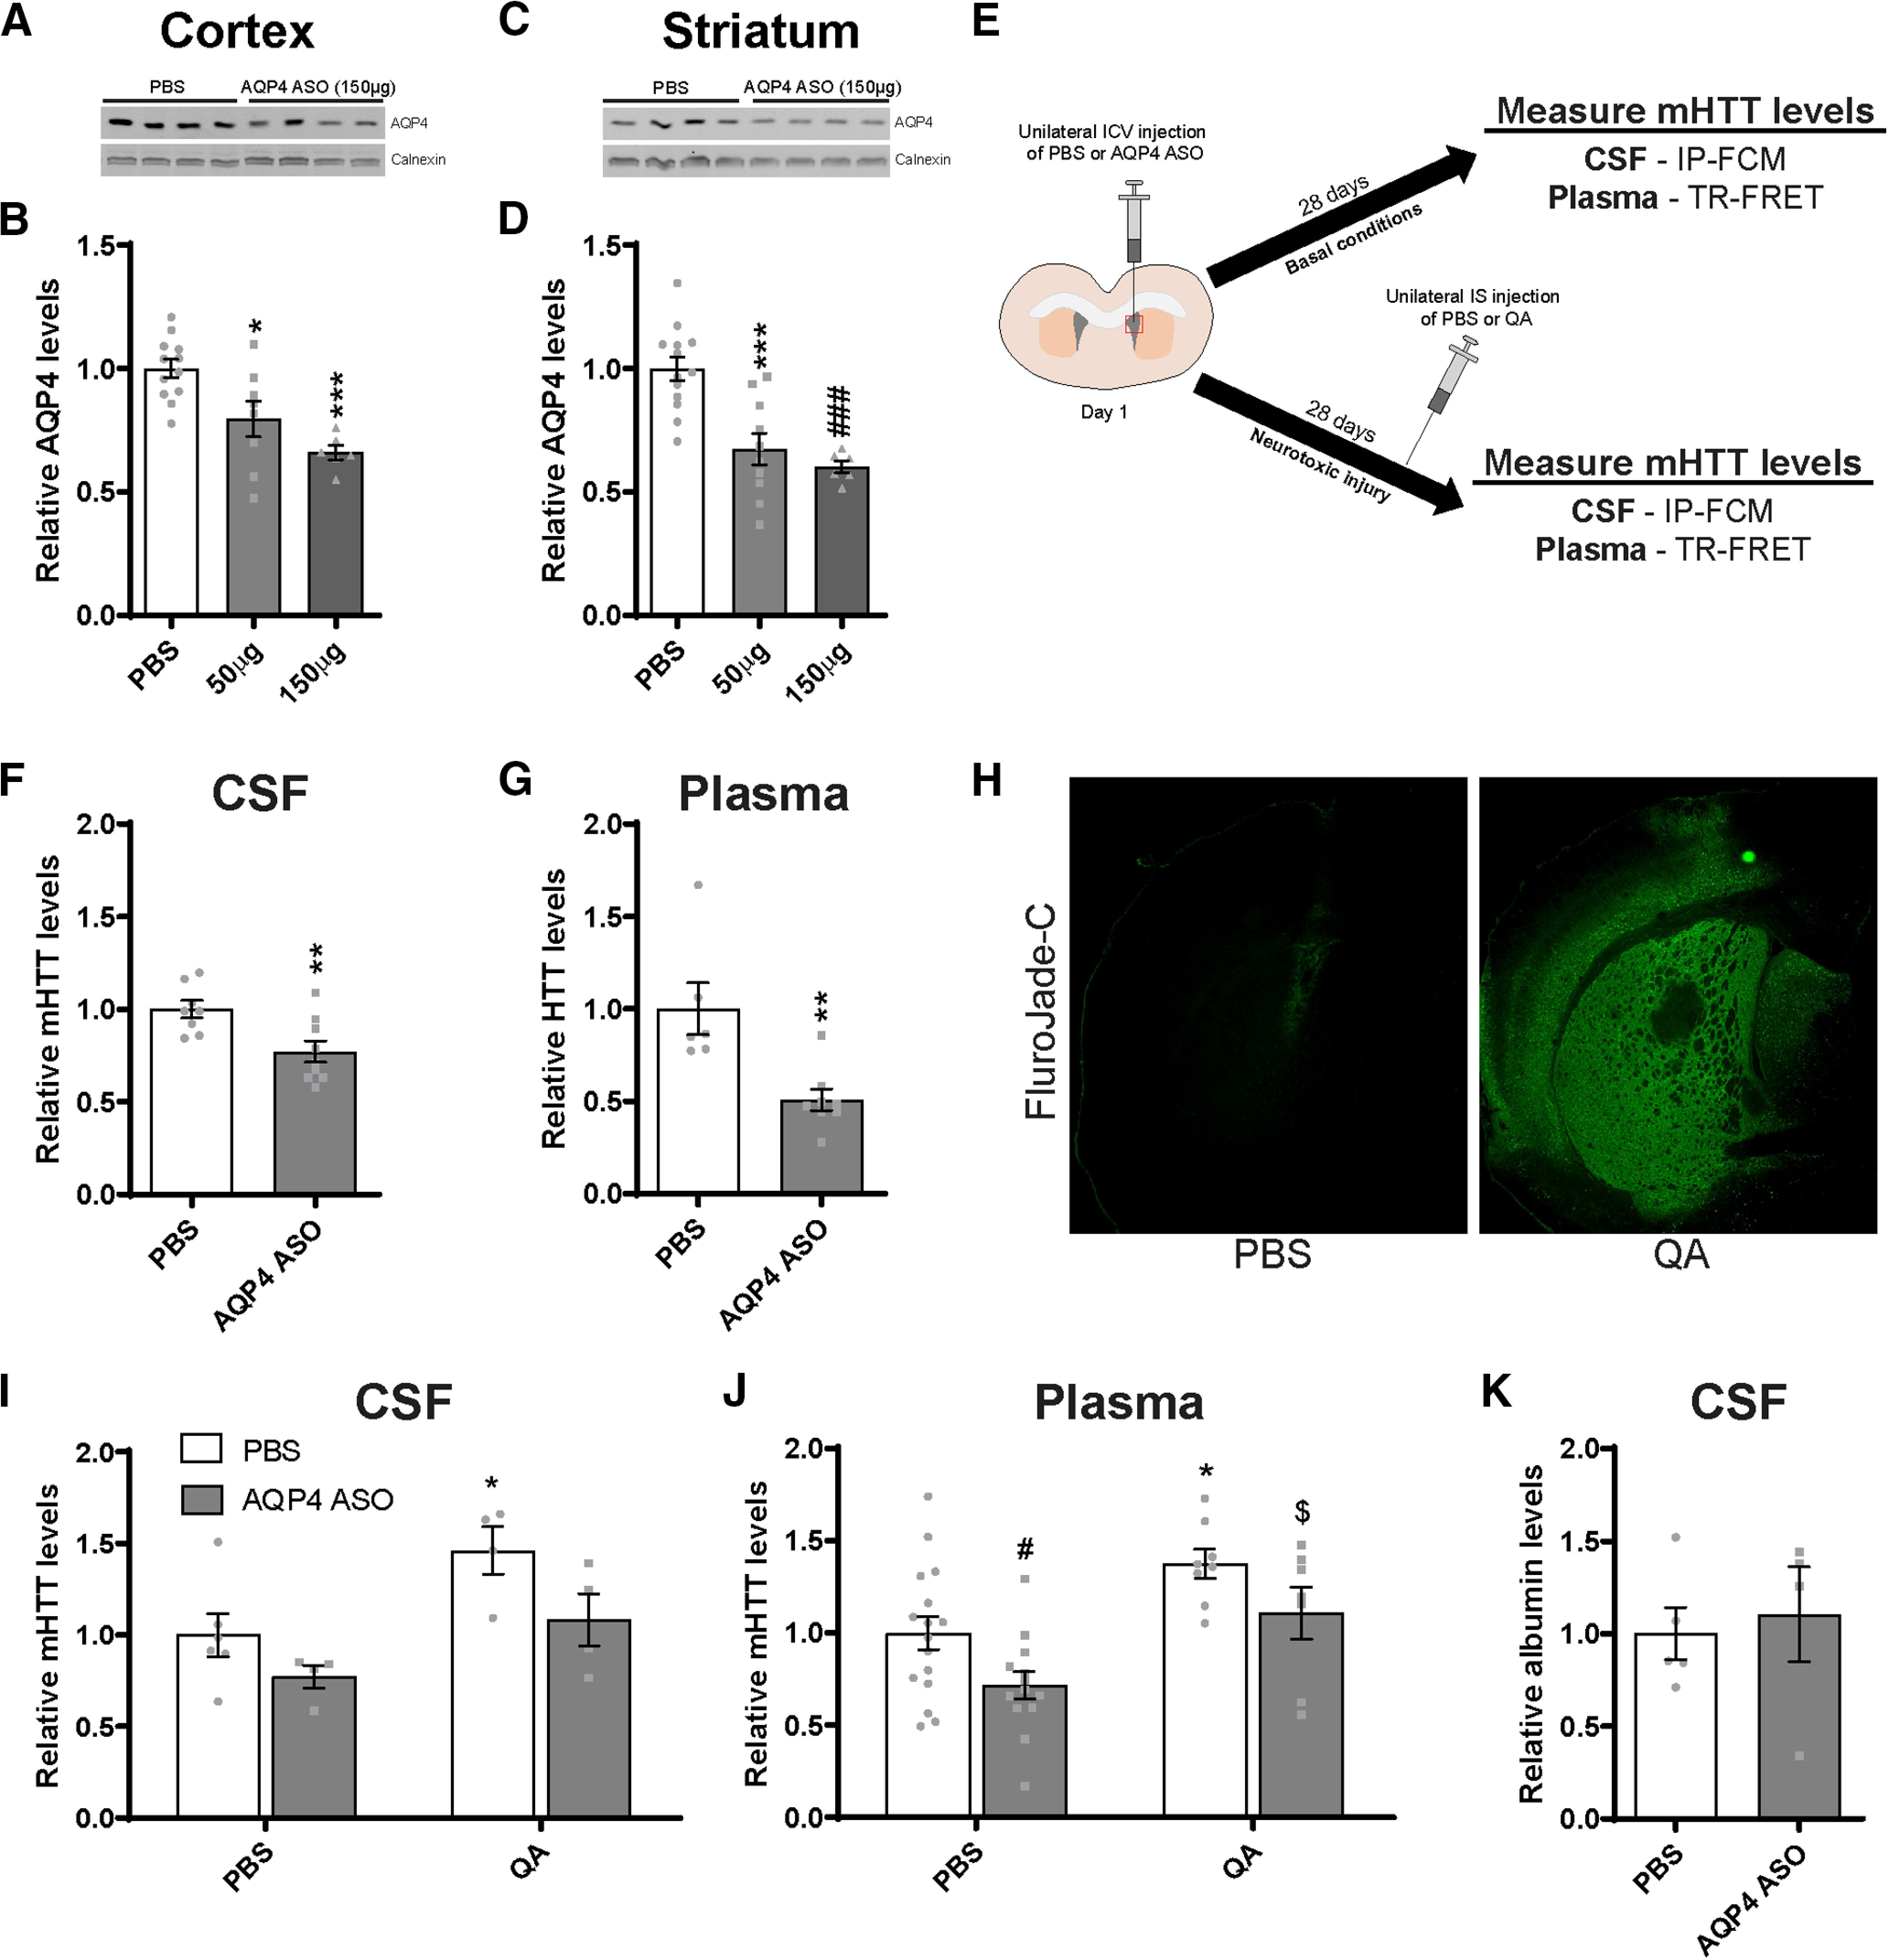
Suppression of the glymphatic system in the brain of Hu97/18 mice reduces clearance of mHTT to the CSF and plasma. A, Representative Western blot and (B) quantification of AQP4 protein levels in the cortex following a 28 d treatment with either PBS or an AQP4 ASO (N = 6-8; one-way ANOVA: p = 0.0003; Tukey's multiple comparison test: *p = 0.0161; ***p = 0.0004). C, Representative Western blot and (D) quantification of AQP4 protein levels in the striatum following a 28 d treatment with either PBS or an AQP4 ASO (N = 6-8; one-way ANOVA: p < 0.0001; Tukey's multiple comparison test compared with PBS: ***p = 0.0003; ###p = 0.0002). E, Graphical overview of experimental design to evaluate the contribution of glymphatic clearance to mHTT in biofluids under basal and neurotoxic conditions. Hu97/18 mice received a unilateral bolus injection of PBS or AQP4 ASO; and biofluids were collected 28 d later. Under neurotoxic conditions, Hu97/18 mice received either PBS or QA on day 25 of ASO treatment; and biofluids were collected 3 d later for mHTT measurement. Quantification of mHTT levels following AQP4 ASO treatment under basal conditions showed a (F) 23% reduction in CSF mHTT (N = 8 or 9, unpaired t test: **p = 0.0080) and (G) 49% reduction in the plasma mHTT (N = 6-8, unpaired t test: **p = 0.0038). H, IHC images of brains stained with Fluro-Jade C following IS injection of PBS or QA showing the formation of a lesion. I, J, In PBS-injected animals, treatment with AQP4 ASO resulted in a (I) 23% reduction in CSF mHTT (N = 4-6; two-way ANOVA: ASO treatment, p = 0.0263; QA treatment, p = 0.0070; interaction, p = 0.5458; Sidak's multiple comparison test: p = 0.3417, PBS/PBS compared with AQP4 ASO/PBS) and (J) 28% decrease in plasma mHTT signal (N = 13-16; two-way ANOVA: ASO treatment, p = 0.0090; QA treatment, p = 0.0005; Sidak's multiple comparison test: #p = 0.0403, PBS/PBS compared with AQP4 ASO/PBS), consistent with the effects of AQP4 ASO treatment under basal conditions. Similarly, in QA-injected animals, treatment with AQP4 ASO led to (I) a 38% reduction of CSF mHTT (N = 4; Sidak's multiple comparison test: p = 0.1057, PBS/QA compared with AQP4 ASO/QA) and (J) a 27% reduction in plasma mHTT signal (N = 7 or 8; Sidak's multiple comparison test: p = 0.2043, PBS/QA compared with AQP4 ASO/QA), suggesting that the glymphatic system contributes to mHTT clearance under neurotoxic injury. Under neurotoxic conditions, QA injection in PBS-treated animals resulted in a (I) 46% increase in CSF (N = 4-6; Sidak's multiple comparison test: *p = 0.0281, PBS/PBS compared with PBS/QA) and (J) a 38% increase in plasma mHTT signal (N = 8-16 per treatment condition; Sidak's multiple comparison test: *p = 0.0175, PBS/PBS compared with PBS/QA), demonstrating a similar effect of QA in both compartments. Finally, AQP4 ASO-treated animals injected with either PBS or QA resulted in (I) a 31% increase in CSF (N = 4; Sidak's multiple comparison test: p = 0.2036, AQP4 ASO/PBS compared with AQP4 ASO/QA) and (J) a 39% increase in plasma mHTT signal (N = 7-13; Sidak's multiple comparison test: $p = 0.0226, AQP4 ASO/PBS compared with AQP4 ASO/QA). K, Quantification of albumin levels in the CSF demonstrates that total protein levels are similar following treatment with either PBS or AQP4 ASO (N = 4-6, unpaired t test: p = 0.7181).
Figure 3.
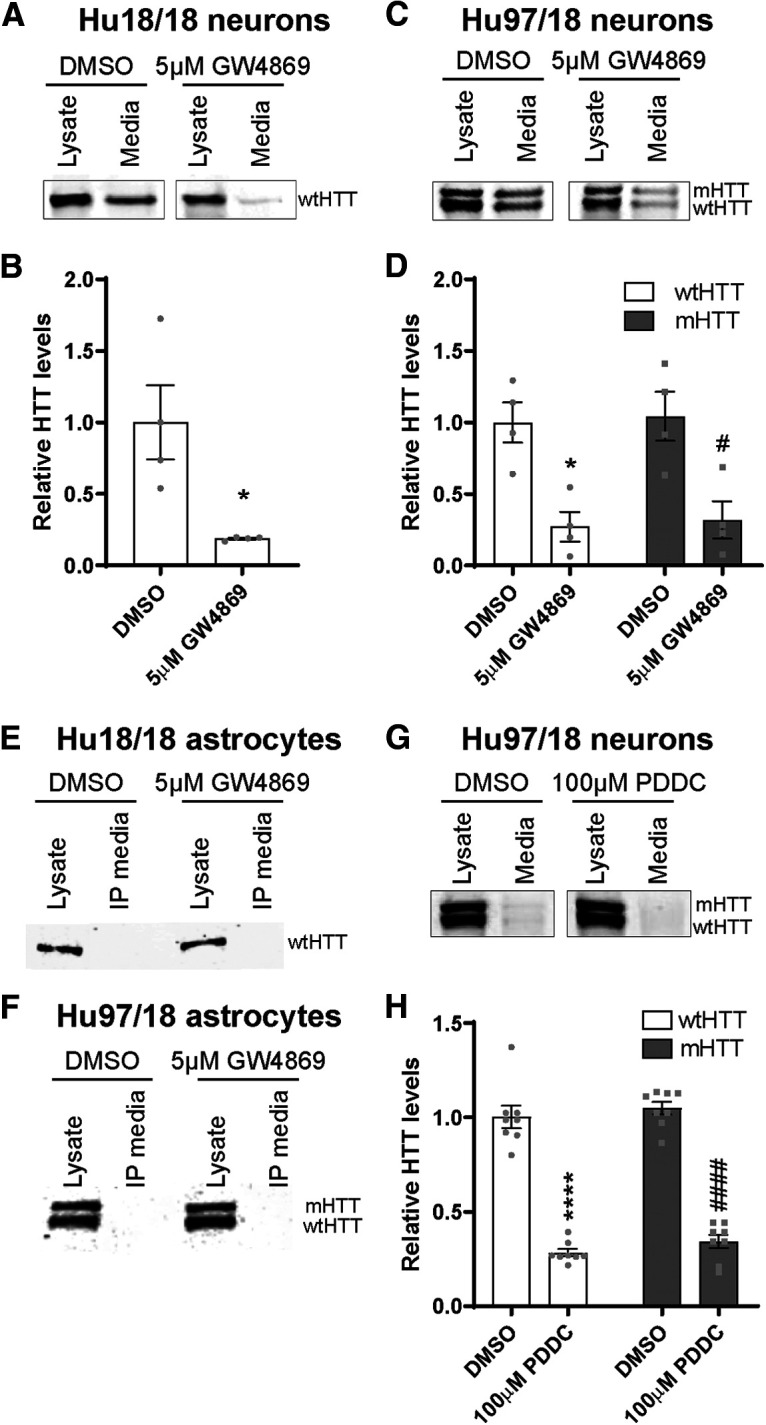
HTT is secreted from primary neurons but not astrocytes. A, Representative Western blot of neuron lysates and concentrated media from Hu18/18 neurons probed with MAB2166. B, Quantification of secreted extracellular wtHTT from Hu18/18 neurons showed an 81% reduction following treatment with GW4869 (N = 4 independent experiments per treatment condition, unpaired t test: *p = 0.0201). C, Representative Western blot of neuron lysates and concentrated media from Hu97/18 neurons. D, Quantification of secreted extracellular HTT from Hu97/18 neurons showed a 73% reduction of wtHTT and a 68% reduction of mHTT following treatment with GW4869 (N = 4 independent experiments per treatment condition; two-way ANOVA: GW4869 treatment, p = 0.0002; HTT allele, p = 0.7515; interaction, p = 0.9913; Sidak's multiple comparison test: *p = 0.0174, DMSO/wtHTT compared with GW4869/wtHTT; #p = 0.0180, DMSO/mHTT compared with GW4869/mHTT). E, F, Representative Western blots of astrocyte lysates and immunoprecipitated (IP) culture media demonstrating intracellular HTT and a lack of extracellular protein in either (E) Hu18/18 or (F) Hu97/18 primary astrocyte cultures, suggesting that HTT is not secreted from these cells. Brightness and contrast have been adjusted to highlight the absence of HTT signal from IP media. G, Representative Western blot of neuron lysates and concentrated media from Hu97/18 neurons. H, Quantification of secreted extracellular HTT from Hu97/18 neurons showed a 72% reduction of wtHTT and a 66% reduction of mHTT following treatment with PDDC (N = 8 independent experiments per treatment condition; two-way ANOVA: PDDC treatment, p < 0.0001; HTT allele, p = 0.1923; interaction, p = 0.8704; Sidak's multiple comparison test: ****p < 0.0001, DMSO/wtHTT compared with PDDC/wtHTT; ####p < 0.0001, DMSO/mHTT compared with PDDC/mHTT).
Groupwise comparisons were assessed using either the Student's t test (2 groups) or ANOVA (>2 groups). Post hoc analyses for ANOVA tests were performed using the Tukey test (one-way ANOVA) or the Sidak test (two-way ANOVA) to correct for multiple comparisons.
Statistical analysis comparing relative GFP signal at different time points post-injection (1, 2, 3, 4 and 6 weeks) following IS injections with either GFP or mHTTex1-GFP lentiviruses (see Fig. 1D) was performed by two-way ANOVA with post hoc analysis using Sidak's multiple comparison test.
Statistical analysis comparing plasma NfL levels in WT, YAC128, and YAC128 C6R genotypes (see Fig. 2A) was performed by one-way ANOVA with post hoc analysis using Tukey's multiple comparison test. Comparison of relative mHTT signal (see Fig. 2B,C) or relative brain levels (see Fig. 2E) between YAC128 and YAC128 C6R genotypes was performed by unpaired, two-tailed Student's t test. MFI signal from FL HTT proteins with increasing Q lengths (see Fig. 2H) was log-transformed and a nonlinear curve was fitted to the data.
Figure 2.

Neurodegeneration is not required for release of mHTT into the CSF. A, Levels of NfL in the plasma of YAC128, YAC128 C6R, and WT littermate controls at 12 months of age (N = 5-10 per genotype). One-way ANOVA: p = 0.0094. Tukey's multiple comparison test: **p = 0.0075, YAC128 compared with WT littermate control mice, not significant; p = 0.7792, WT compared with YAC128 C6R mice. B, Quantification of mHTT MFI in brain lysates from YAC128 and YAC128 C6R mice using IP-FCM demonstrates similar MFI in both genotypes (N = 4, unpaired t test: p = 0.7890). C, Quantification of mHTT MFI in the CSF from YAC128 and YAC128 C6R mice using IP-FCM demonstrates detectable CSF mHTT in both genotypes with higher signal observed in YAC128 C6R mice (N = 4, unpaired t test: p = 0.0641). D, Representative Western blot probed with MAB2166 showing HTT levels in brain lysates from WT, YAC128, and YAC128 C6R mice. E, Quantification of relative mHTT levels in brain lysates (same used in C) from YAC128 and YAC128 C6R mice shows a significant reduction in YAC128 C6R mice (N = 4, unpaired t test: **p = 0.0021). F, CAG length sequencing in YAC128 and YAC128 C6R mice (N = 3-6 animals per line) showed an ∼12 CAG (or 12 Q) increase in YAC128 C6R mice. Average CAG lengths for each line are listed above their corresponding bars. G, PAGE separation and Coomassie staining of FL HTT proteins demonstrating appropriate size, including Q-length-dependent increase, and lack of degradation products. H, IP-FCM was performed using a 10× dilution series from 0.002 to 200 pm of recombinant FL HTT proteins with polyQ tracts ranging from Q2 to Q78. Nonexpanded HTT (Q2 and Q23) is not detected using this assay. For the same concentration of expanded mHTT proteins, MFI signal increases with increased polyQ length. x axis data were log-transformed, and a nonlinear fit was applied to the data.
Statistical analysis comparing HTT secretion in vitro following treatment with either DMSO vehicle or neutral sphingomyelinase inhibitors was performed by either unpaired, two-tailed Student's t test in Hu18/18 forebrain neurons (see Fig. 3B) or two-way ANOVA with post hoc analysis using Sidak's multiple comparison test in Hu97/18 forebrain neurons with treatment and HTT allele as independent variables (see Fig. 3D,H).
Statistical analysis comparing mHTT secretion in biofluids from Hu97/18 mice under basal conditions following treatment with either DMSO vehicle or PDDC was performed by unpaired, two-tailed Student's t test (see Fig. 4B,C). Comparison of mHTT secretion in biofluids from Hu97/18 mice under neurotoxic conditions following treatment with either DMSO vehicle or PDDC was performed by two-way ANOVA with post hoc analysis using Sidak's multiple comparison test with PBS/QA and vehicle/PDDC treatments as independent variables (see Fig. 4D,E).
Figure 4.
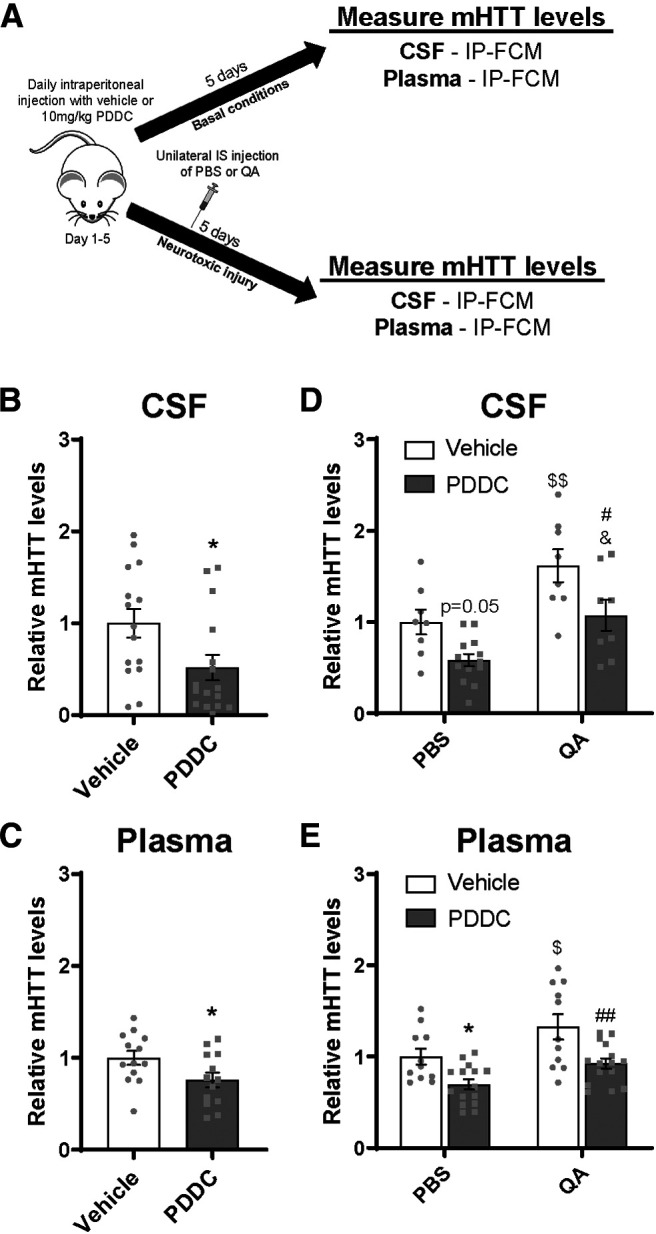
In vivo cellular secretion contributes to CSF and plasma mHTT. A, Graphical overview of experimental design to evaluate the contribution of secretion to mHTT in biofluids under basal and neurotoxic conditions. Hu97/18 mice received PDDC or DMSO vehicle control by daily intraperitoneal injections for 5 d. Biofluids were collected after the final injection. Under neurotoxic conditions, mice received either QA or PBS after the second PDDC injection. Quantification of mHTT levels following treatment with PDDC under basal conditions showed a (B) 48% reduction in CSF mHTT (N = 15 or 16, unpaired t test: *p = 0.0270) and (C) 24% reduction in plasma mHTT signal (N = 13, unpaired t test: *p = 0.0397), demonstrating that secretion contributes to mHTT in both biofluid compartments. D, E, In PBS-injected animals, PDDC treatment resulted in (D) a 42% reduction in CSF (N = 8-13; two-way ANOVA: QA treatment, p = 0.0002; PDDC treatment, p = 0.0011; interaction, p = 0.6422; Sidak's multiple comparison test: p = 0.0508, vehicle/PBS compared with PDDC/PBS) and (E) 30% decrease in plasma mHTT signal (N = 11-15; two-way ANOVA: QA treatment, p = 0.0017; PDDC treatment, p = 0.0001; interaction, p = 0.5564; Sidak's multiple comparison test: *p = 0.0259 vehicle/PBS compared with PDDC/PBS), consistent with the effects of PDDC treatment under basal conditions. Similarly, in QA-injected animals, treatment with PDDC resulted in (D) a 54% decrease in CSF mHTT (N = 8; Sidak's multiple comparison test: #p = 0.0201, vehicle/QA compared with PDDC/QA) and (E) a 40% reduction in plasma mHTT signal (N = 11-15; Sidak's multiple comparison test: ##p = 0.0026, vehicle/QA compared with PDDC/QA), suggesting that secretion contributes to mHTT clearance following neurotoxic injury. In vehicle-treated animals, QA injection resulted in (D) a 62% increase in CSF mHTT signal (N = 8; Sidak's multiple comparison test: $$p = 0.0078, vehicle/PBS compared with vehicle/QA) and (E) a 33% increase in plasma mHTT signal (N = 11; Sidak's multiple comparison test: $p = 0.0256 vehicle/PBS compared with vehicle/QA), demonstrating a similar effect in the two compartments. In PDDC-treated animals injected with either PBS or QA, there was (D) a 49% increase in CSF mHTT signal (N = 8-13; Sidak's multiple comparison test: %p = 0.0190, PDDC/PBS compared with PDDC/QA), and (E) a 23% increase in plasma mHTT (N = 15; Sidak's multiple comparison test: p = 0.0793, PDDC/PBS compared with PDDC/QA). Thus, inhibition of HTT secretion does not alter acute neurotoxic increases in CSF or plasma mHTT.
Statistical analyses comparing mHTT clearance from the brain following IS (see Fig. 5D,E) or ICV injection (see Fig. 5G,H) of FL mHTT Q67 at different time points post-injection was performed by one-way ANOVA with post hoc analysis using Tukey's multiple comparison test. Comparison of mHTT levels in the plasma (see Fig. 5J) or CSF (see Fig. 5K) following intravenous injection of FL mHTT Q67 at different time points post-injection was performed by one-way ANOVA with post hoc analysis using Tukey's multiple comparison test.
Statistical analyses comparing relative mHTT signal in the brain (see Fig. 6A), plasma (see Fig. 6B), and liver (see Fig. 6C) following treatment of Hu97/18 mice with ascending doses of an HTT-targeted ASO was performed by log transforming ASO concentration (x axis) data and followed by linear regression. A nonlinear curve was fitted to the data presented in the figures. Linear regression was performed to compare MFI signal in the brain with that in the plasma (see Fig. 6D). Fitting was done to individual mHTT signal values (y axis).
Figure 6.

Correlative reduction of plasma mHTT following ASO-mediated mHTT suppression in the CNS. Hu97/18 mice received a unilateral ICV bolus injection of either PBS vehicle or ascending doses (15, 25, 75, or 150 µg) of an ASO against human HTT; and 4 weeks later, tissues and plasma were collected for mHTT quantification by IP-FCM. A, B, Quantification of mHTT protein from (A) brain lysates (N = 8 per dose; log-transformed linear regression, R2 = 0.3773, p < 0.001) and (B) plasma (N = 5-7 per dose; log-transformed linear regression, R2 = 0.2977, p < 0.01) after ASO treatment demonstrates dose-dependent reduction of mHTT. C, Quantification of mHTT protein from liver lysates shows no reduction following CNS ASO treatment (N = 3-8 per dose; log-transformed linear regression, R2 = 0.0020, p = 0.8416). D, Comparison of mHTT IP-FCM MFI signal in brain and plasma following ASO-induced CNS HTT reduction shows a significant positive correlation (R2 = 0.5444. p < 0.0001), suggesting that the CNS contributes to circulating mHTT protein. A, Data from Southwell et al. (2015).
Statistical analysis comparing AQP4 levels in the cortex (see Fig. 7B) and striatum (see Fig. 7D) following treatment of Hu97/18 mice with 2 doses of an AQP4 targeted ASO was performed by one-way ANOVA with post hoc analysis using Tukey's multiple comparison test. Comparison of mHTT clearance to biofluids from Hu97/18 mice under basal conditions following treatment with either PBS vehicle or AQP4 was performed by unpaired, two-tailed Student's t test (see Fig. 7F,G). Comparison of mHTT clearance to biofluids from Hu97/18 mice under neurotoxic conditions following treatment with either PBS vehicle or AQP4 ASO was performed by two-way ANOVA with post hoc analysis using Sidak's multiple comparison test with PBS/QA and PBS/AQP4 ASO treatments as independent variables (see Fig. 7I,J).
Results
Intracellular mHTT is cleared to the CSF during induced neuronal death
We first wanted to investigate the mechanism and kinetics of the clearance of mHTT of intracellular origin to the CSF. To test this, lentiviruses encoding either GFP or mHTT exon 1 with 103 Qs fused to GFP (mHTTex1-GFP) (Southwell et al., 2009) were administered bilaterally into the striatum of WT mice and brains as well as CSF were collected at 1, 2, 3, 4, or 6 weeks post-injection (Fig. 1A). We have previously shown that IS administration of lentiviral mHTTex1-GFP results in peak transgene expression at 3–4 weeks post-injection and the formation of a lesion by 6 weeks post-injection with reactive astrocytes and dramatic neuron loss in the transduced area (Southwell et al., 2009). This is consistent with the expression time course observed by others using lentivirus-encoding mHTT fragments to model HD (de Almeida et al., 2002). Here we performed a time course of mHTTex1-GFP expression up to 6 weeks post-injection. We observed GFP expression at 1 week post-injection (Fig. 1B), which further increased with time at 2 and 3 weeks post-injection, and was accompanied by the formation of mHTT inclusion bodies (data not shown). At 4 weeks post-injection, diffuse mHTTex1-GFP and inclusion bodies were evident throughout the striatum, and there was extensive staining for NeuN+ cells, demonstrating the presence of neurons (Fig. 1B). At 6 weeks post-injection, there was a reduction in diffuse mHTT exon 1, with widespread inclusion bodies and an absence of NeuN staining in transduced areas, suggesting the complete loss of neurons (Fig. 1B). We observed a similar distribution and expression time course with the GFP control lentivirus (Fig. 1C). Using a novel GFP-specific ultrasensitive IP-FCM assay, we quantified GFP MFI in the CSF of GFP or mHTTex1-GFP-injected animals at 1, 2, 3, 4, and 6 weeks post-injection. In GFP-injected animals, GFP fluorescence signal was not detected in the CSF, suggesting that GFP is retained intracellularly and does not induce neurodegeneration in transduced cells (Fig. 1D). In mHTTex1-GFP-injected animals, GFP signal in the CSF was detected from 1 week post-injection, peaking 4 weeks post-injection when transgene expression is high and neurons are actively dying, and decreased to 33% of peak levels at 6 weeks post-injection, when transgene expression is still high, but neuron death is extensive (Fig. 1D; two-way ANOVA: lentivirus treatment, F(1,28) = 26.22, p < 0.0001; time point, F(4,28) = 2.555, p = 0.0608; interaction, F(4,28) = 2.653, p = 0.0539; Sidak's multiple comparison test: **p = 0.0048; ***p = 0.0003). These data suggest that intracellular mHTT is cleared to the CSF during the process of neurodegeneration, but levels in the CSF are reduced after neurons have been lost. Conversely, the reduced signal observed at 6 weeks could result from mHTT being in a more advanced state of aggregation, which may alter clearance of mHTT from the brain, or interfere with immunoassay quantitation of mHTT.
Neurodegeneration is not required for release of mHTT into the CSF
We next wanted to evaluate whether mHTT release into the CSF was abolished in the absence of neurodegeneration. To test this, we used the YAC128 C6R model of HD, which harbors a FL human mHTT YAC transgene that is resistant to caspase-6 cleavage at residue 586. These mice do not undergo progressive striatal neuron loss as is seen in the YAC128 model (Slow et al., 2003; Graham et al., 2006). We first validated the lack of neurodegeneration in YAC128 C6R mice by measuring levels of NfL in the plasma of YAC128, YAC128 C6R, and WT littermate controls at 12 months of age (Fig. 2A). We observed a significant increase in NfL levels in the YAC128 mice compared with littermate controls, suggesting that neurodegeneration is occurring, but no difference was observed between YAC128 C6R and littermate controls, affirming the lack of overt neurodegeneration in this line (Fig. 2A; one-way ANOVA: F(2,25) = 5.651 p = 0.0094; Tukey's multiple comparison test: **p = 0.0075, YAC128 compared with WT littermate control mice, not significant; p = 0.7792, WT compared with YAC128 C6R mice). In brain lysates from YAC128 and YAC128 C6R mice, we measured similar mHTT signal in both lines using IP-FCM (Fig. 2B; unpaired t test: t(6) = 0.2799, p = 0.7890). Notably, we observed an unexpected trend toward an increase in mHTT levels in the CSF of YAC128 C6R compared with YAC128 mice by IP-FCM (Fig. 2C; unpaired t test: t(6) = 2.265, p = 0.0641). Previous reports have shown that levels of mHTT measured by Western blot are reduced in brain lysates from YAC128 C6R compared with YAC128 mice (Graham et al., 2006; Ehrnhoefer et al., 2018b). Therefore, we quantified mHTT levels by Western blot in the same brain lysates that were analyzed by IP-FCM and found a significant reduction in mHTT levels in YAC128 C6R mice compared with YAC128 mice (Fig. 2D,E; unpaired t test: t(6) = 5.135, **p = 0.0021).
To help elucidate this difference between the observed IP-FCM mHTT signal and Western blot mHTT levels, we CAG sized the transgenes in both lines and found that YAC128 C6R mice have a longer CAG tract (Fig. 2F; 138 CAG repeats = 138 Qs) than the YAC128 parent line (126 CAGs = 126 Qs). Considering the observed increase in CSF mHTT IP-FCM signal noted in the YAC128 C6R mice, we wanted to determine whether our assay quantifies FL mHTT with different Q lengths in a comparable way. To investigate this, we used an allelic series of recombinant FL HTT proteins with polyQ tracts ranging from Q2 to Q78 (Fig. 2G) to compare the relationship between polyQ tract length and HDB4E10/MW1 IP-FCM MFI signal at a variety of known protein concentrations. We observed that MFI increased with longer Q tracts (Fig. 2H). This demonstrates that HDB4E10/MW1 MFI is a measure of signal rather than absolute protein concentration and suggests that the increased MFI observed in the CSF from YAC128 C6R line was because of the longer polyQ tract in this line (138 Qs) compared with the YAC128 mice (126 Qs), rather than increased mHTT concentration. Despite this caveat that prohibits direct comparison of mHTT concentrations in the brain and CSF of these lines using IP-FCM, ample mHTT was detected in the CSF of YAC128 C6R mice, demonstrating that it is released to CSF in the absence of neurodegeneration and must reach this compartment by other mechanisms.
HTT is secreted from primary neurons but not astrocytes
We next investigated whether HTT is secreted from primary forebrain neurons and astrocytes derived from Hu18/18 and Hu97/18 humanized mice. Recently, it was shown that mHTT is secreted from neuronal cells via an LE/Lys secretory pathway and that its secretion could be inhibited using a neutral sphingomyelinase (nSMase) inhibitor, GW4869 (Trajkovic et al., 2017). In Hu18/18 primary neurons, we observed that wtHTT was secreted into the media and that this secretion was significantly reduced by 81% following treatment with GW4869 (Fig. 3A,B; unpaired t test: t(6) = 3.137, p = 0.0201). Moreover, we found that treatment of Hu97/18 primary neurons with GW4869 led to a significant reduction of wtHTT by 73% and mHTT by 68% in the media (Fig. 3C,D; two-way ANOVA: GW4869 treatment, F(1,12) = 27.55, p = 0.0002; HTT allele, F(1,12) = 0.1050, p = 0.7515; interaction, F(1,12) = 0.0001245, p = 0.9913; Sidak's multiple comparison test: *p = 0.0174, DMSO/wtHTT compared with GW4869/wtHTT; #p = 0.0180, DMSO/mHTT compared with GW4869/mHTT). Notably, both wtHTT and mHTT were secreted from Hu97/18 forebrain neurons at similar levels (Fig. 3D; Sidak's multiple comparison: p > 0.9999, DMSO/wtHTT compared with DMSO/mHTT), and treatment with GW4869 resulted in similar reductions of wtHTT and mHTT in the culture media (Fig. 3D; Sidak's multiple comparison: p > 0.9999 GW4869/wtHTT compared with GW4869/mHTT). These data demonstrate that there is no allelic bias in the secretion of HTT from Hu97/18 primary neurons (Fig. 3C,D), suggesting that this process may be a normal physiological function of HTT. We failed to detect HTT in the media of both Hu18/18 (Fig. 3E) and Hu97/18 (Fig. 3F) primary astrocytes, despite enrichment by immunoprecipitation with an antibody against HTT. This suggests that HTT is not secreted from primary astrocytes in vitro.
In vivo cellular secretion contributes to CSF and plasma mHTT
We next wanted to evaluate the relative contribution of mHTT secretion to mHTT in the CSF and plasma of animals. Since GW4869 is not brain penetrant, we used PDDC, a potent small-molecule nSMase inhibitor that enters the brain after systemic administration (Rojas et al., 2019). Treatment of Hu97/18 neurons with PDDC led to a significant reduction of both wtHTT and mHTT in the culture media (Fig. 3G,H; two-way ANOVA: PDDC treatment, F(1,28) = 323.12, p < 0.0001; HTT allele, F(1,28) = 1.785, p = 0.1923; interaction, F(1,28) = 0.02710, p = 0.8704; Sidak's multiple comparison test; ****p < 0.0001, DMSO/wtHTT compared with PDDC/wtHTT; ####p < 0.0001, DMSO/mHTT compared with PDDC/mHTT), similar to treatment with GW4869 (Fig. 3A–D), which further validates that inhibition of nSMase suppresses HTT secretion.
To investigate the contribution of secretion under basal conditions, Hu97/18 mice received daily intraperitoneal injections with either PDDC or vehicle for 5 d and mHTT in the CSF, and plasma was measured by IP-FCM ∼6 h after the final injection (Fig. 4A). We observed a treatment-induced reduction of mHTT of 48% in the CSF (Fig. 4B; unpaired t test: t(29) = 2.329, *p = 0.0270) and 24% in the plasma (Fig. 4C; unpaired t test: t(24) = 2.175, *p = 0.0397). These data suggest that cellular secretion of HTT in the brain contributes to mHTT protein in the CSF and blood.
To investigate the contribution of secretion to biofluid mHTT under neurotoxic conditions, Hu97/18 mice received a unilateral IS injection with either QA or PBS on the second day of PDDC treatment and biofluids were collected 3 d later, on the fifth day of PDDC treatment (Fig. 4A). In the PBS-injected group, we saw a similar trend of PDDC treatment as in basal conditions, with a 42% reduction in CSF mHTT IP-FCM signal (Fig. 4D; two-way ANOVA: QA treatment, F(1,33) = 17.21, p = 0.0002; PDDC treatment, F(1,33) = 12.90, p = 0.0011; interaction, F(1,33) = 0.2199, p = 0.6422; Sidak's multiple comparison test: p = 0.0508, vehicle/PBS compared with PDDC/PBS) and a significant 30% reduction in plasma (Fig. 4E; two-way ANOVA: QA treatment, F(1,48) = 11.10, p = 0.0017; PDDC treatment, F(1,48) = 17.98, p = 0.0001; interaction, F(1,48) = 0.3509, p = 0.5564; Sidak's multiple comparison test: *p = 0.0259, vehicle/PBS compared with PDDC/PBS). In QA-injected animals, this trend was maintained, with a 54% reduction in CSF mHTT signal following PDDC treatment (Fig. 4D; Sidak's multiple comparison test: #p = 0.0201, vehicle/QA compared with PDDC/QA), and a 40% reduction in observed in plasma (Fig. 4E; Sidak's multiple comparison test: ##p = 0.0026, vehicle/QA compared with PDDC/QA), suggesting that secretion continues to contribute to mHTT clearance following acute neurotoxic injury. In vehicle-treated animals, we observed the expected QA-induced increase in mHTT signal in both compartments, 62% in CSF (Fig. 4D; Sidak's multiple comparison test: $$p = 0.0078, vehicle/PBS compared with vehicle/QA) and 33% in plasma (Fig. 4E; Sidak's multiple comparison test: $p = 0.0256, vehicle/PBS compared with vehicle/QA). In PDDC-treated mice, we observed a QA-induced increase in mHTT CSF signal of 49% (Fig. 4D; Sidak's multiple comparison test: %p = 0.0190, PDDC/PBS compared with PDDC/QA), and a 23% increase in plasma mHTT signal (Fig. 4E; Sidak's multiple comparison test: p = 0.0793, PDDC/PBS compared with PDDC/QA). Thus, inhibition of HTT secretion does not alter acute neurotoxic increases in CSF or plasma mHTT.
Exogenous extracellular mHTT is cleared from the brain to the CSF
To investigate the mechanism and kinetics of the clearance of extracellular mHTT from the brain, WT mice received a unilateral IS injection of FL mHTT containing Q67 (FL mHTT Q67), and brains and CSF were collected at multiple time points post-injection for quantification of exogenous mHTT (Fig. 5A). We performed IHC to validate that FL mHTT Q67 was delivered into the striatum (Fig. 5B). Consistent with IS administration of FL mHTT Q67, we observed the highest levels in the striatum at the first time point assessed (0.5 h post-injection; Fig. 5C,D). Levels of FL mHTT Q67 in the striatum were significantly decreased after 2 h and were no longer detectable after 24 h (Fig. 5C,D; one-way ANOVA: F(5,18) = 29.88, p < 0.0001; Tukey's multiple comparison test of 0.5 h compared with other time points: ***p = 0.0005; ****p < 0.0001). Interestingly, levels of FL mHTT Q67 in the CSF peaked at 1 h post-injection and were nearly undetectable by 6 h post-injection (Fig. 5E; one-way ANOVA: F(5,26) = 23.73, p < 0.0001; Tukey's multiple comparison test of 0.5 h compared with other time points: *p = 0.0495; **p = 0.0041; ***p = 0.007; ###p = 0.0003). We estimated the percentage of the injected dose that was cleared from the brain to the CSF at each time point using a standard curve of FL mHTT Q67 protein (Fig. 5E). These data suggest that a portion (area under curve = 18.82 ± 4.319% over 24 h) of the extracellular protein injected in the striatum was cleared to the CSF. However, the accurate quantification of mHTT clearance from the brain to the CSF in this experiment is confounded by the rapid turnover of CSF in mice (Oshio et al., 2005) and potential degradation of mHTT over time, among other factors.
Exogenous mHTT delivered to the CSF is cleared to the plasma
CSF circulates within the ventricular system and subarachnoid spaces of the brain and is ultimately reabsorbed back into the bloodstream (Khasawneh et al., 2018). To evaluate whether mHTT from the CSF is cleared into the blood compartment, we injected FL mHTT Q67 into the lateral ventricle of WT mice and collected brain, CSF, and plasma at multiple time points post-injection (Fig. 5F). As expected from delivery of mHTT directly into the CSF, we observed the highest levels of CSF FL mHTT Q67 at the first evaluated time point post-injection (0.5 h; Fig. 5G; one-way ANOVA: F(5,19) = 5.065, p = 0.0041; Tukey's multiple comparison test of 0.5 h compared with other time points: *p = 0.0146; **p = 0.0046; #p = 0.0319). Levels of mHTT in the CSF were nearly undetectable at 1 h and absent at 2 h post-injection (Fig. 5G). This finding was not surprising considering that CSF is turned over at a rate of 12-13 times per day in mice (Oshio et al., 2005). Interestingly, levels of mHTT in the CSF started to rise again by 4 h and reached 49% of peak levels at 6 h post-injection. In plasma, levels of mHTT peaked at 1 h post-injection and returned to near baseline by 6 h post-injection (Fig. 5H; one-way ANOVA: F(5,20) = 2.144, p = 0.1018). We did not detect mHTT in any brain region at any time point evaluated following ICV injection of FL mHTT Q67 (data not shown). These data suggest that mHTT from the CSF can contribute to the pool of mHTT in the plasma.
Exogenous mHTT delivered to the blood can reenter the CSF
To evaluate whether mHTT delivered to the blood can reenter the CSF, and to get better resolution of the stability of mHTT in the blood, we administered FL mHTT Q67 by intravenous injection and collected the brain, plasma, and CSF at different time points post-injection (Fig. 5I). Consistent with a bolus intravenous injection, we detected the highest levels of FL mHTT Q67 in the plasma at the first time point evaluated (0.5 h; Fig. 5J; one-way ANOVA: F(5,13) = 8.634, p = 0.0009; Tukey's multiple comparison test of 0.5 h compared with other time points = not significant), with levels only decreasing to 68% after 6 h. This suggests that FL mHTT Q67 is relatively stable in the blood for up to 6 h, consistent with the slower rate of plasma turnover compared with CSF. We did not detect any FL mHTT Q67 in the CSF at 0.5 or 1 h post-injection, but mHTT signal was detectable at 2, 4, and 6 h post-injection (Fig. 5K; one-way ANOVA: F(5,12) = 2.244, p = 0.1167). This suggests that extracellular FL mHTT in the blood is able to enter the CSF. However, no mHTT was detected in the brain at any time point evaluated following intravenous administration of FL mHTT Q67 (data not shown).
Correlative reduction of plasma mHTT following ASO-mediated mHTT suppression in the CNS
We have previously shown that ASO-mediated lowering of mHTT in the CNS results in a correlative reduction of mHTT in the CSF (Southwell et al., 2015). Here we wanted to investigate whether plasma mHTT levels also change with HTT suppression in the CNS to further explore the potential contribution of CNS-derived mHTT to circulation. Hu97/18 mice received either PBS vehicle or an ASO targeting human HTT (Southwell et al., 2015) at doses ranging from 15 to 150 µg. Twenty-eight days after ICV injection, brain, plasma, and liver were collected for mHTT quantification by IP-FCM. We observed a dose-dependent reduction of mHTT in both the brain (Fig. 6A; log-transformed linear regression, R2 = 0.3773, p < 0.001) and plasma (Fig. 6B; log-transformed linear regression, R2 = 0.2977, p < 0.01). Conversely, we did not observe a reduction of mHTT in the liver (Fig. 6C; log-transformed linear regression, R2 = 0.0020, p = 0.8416). ASOs in systemic circulation preferentially accumulate in the liver (Koller et al., 2011; Ammala et al., 2018); therefore, the liver is expected to be the most sensitive tissue for assessing peripheral suppression of HTT. Notably, there was a strong positive correlation between the reduction of mHTT in the brain and that measured in the plasma (Fig. 6D; R2 = 0.5444, p < 0.0001). The lack of observed mHTT lowering in the liver indicates that the observed reduction in plasma mHTT levels is likely the result of CNS, rather than peripheral, mHTT lowering.
Suppression of the glymphatic system in the brain of Hu97/18 mice reduces clearance of mHTT to CSF and plasma
To investigate whether the glymphatic system contributes to the clearance of extracellular HTT from the brain to the CSF under basal and acute neurotoxic conditions, we suppressed levels of AQP4, the mediator of glymphatic clearance, in the CNS. To achieve this, we designed a gapmer ASO that would specifically target AQP4 mRNA (AQP4 ASO), without affecting other aquaporins, with the goal of suppressing the glymphatic system in the brain. To test the potency of this ASO in vivo, Hu97/18 received an ICV injection with either PBS or AQP4 ASO at one of two doses, and brains were harvested 28 d later for analysis of AQP4 protein levels by Western blot. We observed that this molecule induced significant reduction of AQP4 levels in both the cortex (Fig. 7A,B; one-way ANOVA: F(2,23) = 11.63, p = 0.0003; Tukey's multiple comparison test: *p = 0.0161; ***p = 0.0004, compared with PBS) and striatum (Fig. 7C,D; one-way ANOVA: F(2,26) = 15.99, p < 0.0001; Tukey's multiple comparison test: ***p = 0.0003; ###p = 0.0002 compared with PBS).
To investigate the contribution of the glymphatic system to HTT clearance under basal conditions, Hu97/18 received an ICV injection with either PBS or AQP4 ASO, and biofluids were collected 28 d post-injection (Fig. 7E). Following ∼30% ASO-mediated reduction of AQP4 in the brain, we observed a 23% reduction of mHTT in the CSF (Fig. 7F; unpaired t test: t(15) = 3.057, **p = 0.0080) and a 49% reduction in the plasma (Fig. 7G; unpaired t test: t(12) = 3.572, **p = 0.0038). These data suggest that glymphatic clearance of HTT in the brain contributes to mHTT protein in both the CSF and blood.
To evaluate whether the glymphatic system contributes to HTT clearance following neurotoxic injury, Hu97/18 HD mice received an ICV injection with either PBS or AQP4 ASO; then 25 d later, they received a unilateral IS injection with either PBS or QA, and biofluids were collected 3 d later (28 d after ASO injection) (Fig. 7E). Fluoro-Jade staining was performed to validate neurodegeneration in the striatum following QA injection (Fig. 7H). Consistent with AQP4 ASO treatment under basal conditions, AQP4 ASO treatment in PBS-injected mice led to a 23% reduction of mHTT in the CSF (Fig. 7I; two-way ANOVA: ASO treatment, F(1,14) = 6.163, p = 0.0263; QA treatment, F(1,14) = 9.978, p = 0.0070; interaction, F(1,14) = 0.3833, p = 0.5458. Sidak's multiple comparison test: p = 0.3417, PBS/PBS compared with AQP4 ASO/PBS), although this failed to reach post hoc significance, and a 28% decrease in plasma mHTT signal (Fig. 7J; two-way ANOVA: ASO treatment, F(1,40) = 7.543, p = 0.0090; QA treatment, F(1,40) = 14.58, p = 0.0005; interaction, F(1,40) = 0.006373, p = 0.9368; Sidak's multiple comparison test: #p = 0.0403, PBS/PBS compared with AQP4 ASO/PBS). These data further support the contribution of AQP4-dependent glymphatic flux to mHTT clearance from the brain to CSF under basal conditions. Furthermore, in QA-injected animals, treatment with AQP4 ASO led to a 38% reduction of CSF mHTT (Fig. 7I; Sidak's multiple comparison test: p = 0.1057, PBS/QA compared with AQP4 ASO/QA) and a 27% reduction in plasma mHTT signal (Fig. 7J; Sidak's multiple comparison test: p = 0.2043, PBS/QA compared with AQP4 ASO/QA), suggesting a contribution of the glymphatic system to mHTT clearance under neurotoxic injury. Notably, the proportional reduction of mHTT in the CSF and plasma under basal and neurotoxic conditions suggests that the contribution of glymphatic clearance is similar under both conditions, but that there is more mHTT in the extracellular space that is accessible for clearance under neurotoxic conditions. Consistent with QA-induced neurodegeneration (Fig. 4D,E), we observed an expected 46% increase in CSF mHTT signal (Fig. 7I; Sidak's multiple comparison test: *p = 0.0281, PBS/PBS compared with PBS/QA) and a 38% increase in plasma mHTT (Fig. 7J; Sidak's multiple comparison test: *p = 0.0175, PBS/PBS compared with PBS/QA). Finally, in AQP4 ASO-treated animals injected with QA, we observed a 31% increase in CSF mHTT (Fig. 7I; Sidak's multiple comparison test: p = 0.2036, AQP4 ASO/PBS compared with AQP4 ASO/QA) and a 39% increase in plasma mHTT signal (Fig. 7J; Sidak's multiple comparison test: $p = 0.0226, AQP4 ASO/PBS compared with AQP4 ASO/QA). These data further support the correlation of mHTT levels in the CNS and the blood. Finally, to validate that AQP4 ASO treatment did not alter total CSF protein concentrations, we quantified albumin levels in the same volume of CSF for each animal and found that they were not significantly altered following AQP4 ASO treatment (Fig. 7K; unpaired t test: t(7) = 0.3759, p = 0.7181).
Discussion
We sought to investigate the mechanism(s) by which mHTT, an intracellular protein, reaches the CSF compartment to enhance our understanding of treatment-induced CSF mHTT changes. We have demonstrated that CSF mHTT is transiently increased following acute neurotoxic injury (Southwell et al., 2015), suggesting that passive release during neuron injury and death may be the precipitating event in deposition of mHTT into CSF. This is supported by our current findings that lentiviral mHTTex1-GFP produced in the striatum is detected in the CSF during the neurodegenerative process. It is important to note that, by 6 weeks post-injection, mHTTex1-GFP was predominantly found in inclusions, which may alter clearance dynamics of mHTT from the brain or interfere with immunoassay detection. Independent of this potential confound, we have confirmed that striatal mHTTex1-GFP, which is neurotoxic, is released into the CSF of mice during the process of neurodegeneration. Conversely, lentiviral GFP, which is not neurotoxic, was not detected in CSF. These data provide strong evidence that mHTT is released from dying neurons into the extracellular space and the CSF.
Conversely, we demonstrate that neurodegeneration is not required for mHTT to be found in the CSF using the YAC128 C6R mouse model of HD, which lacks histologically detectable neurodegeneration (Graham et al., 2006). While YAC128 mice display elevated plasma NfL, indicative of the neurodegeneration observed in this line, YAC128 C6R mice have plasma NfL levels similar to WT mice, supporting a lack of neurodegeneration. Increased NfL has been reported in biofluids of the R6/2 mouse model of HD (Soylu-Kucharz et al., 2017), but this is the first report showing increased plasma NfL in a FL, adult-onset HD model.
Here we measured an unexpected increase in CSF mHTT in YAC128 C6R compared with YAC128 mice, whereas we detected roughly equivalent amounts of mHTT in the brain by IP-FCM. Conversely, immunoblotting using the same brain lysates showed the expected reduction in mHTT protein in YAC128 C6R brain, consistent with previous reports (Graham et al., 2006; Ehrnhoefer et al., 2018b), suggesting that there is a difference between how these assays quantify YAC128 C6R protein. The mHTT IP-FCM assay uses HDB4E10, a HTT antibody raised against amino acids 1844-2131, for immunoprecipitation of HTT, and MW1, an expanded polyglutamine binding antibody, for detection of mHTT (Southwell et al., 2015). The crystal structure of MW1 antigen binding fragment bound to mHTTex1 shows that the stoichiometry of MW1 increases with longer Q tracts (Bennett et al., 2002; Owens et al., 2015). This suggests that the increased IP-FCM signal observed in the YAC128 C6R line is because of a longer polyQ stretch in mHTT (∼138 Q) compared with the same concentration of YAC128 mHTT (∼126 Q) and that this assay overestimates the concentration of mHTT with longer polyQ tracts. This demonstrates the necessity of using standard proteins with the same polyQ length for absolute quantitation of HTT by immunoassays using MW1, and highlights the importance of considering CAG lengths in comparative immunoassays. Nonetheless, the presence of mHTT in the CSF of YAC128 C6R mice demonstrates that mHTT must exit cells through non-neurodegenerative processes.
Recently, it was shown that HTT is secreted to the extracellular environment via an nSMase-dependent LE/Lys unconventional secretory pathway (Trajkovic et al., 2017). The initial report describing HTT secretion showed that N-terminal amino acids 1-590 (N590) mHTT was preferentially secreted compared with N590 wtHTT from a mouse neuroblastoma cell line, Neuro2A. The authors postulated that preferential secretion of mHTT could represent a protective mechanism to mitigate mHTT-induced toxicity. In contrast, we did not observe an allelic preference in the secretion of HTT from Hu97/18 primary neurons and saw robust secretion of wtHTT from control Hu18/18 neurons, suggesting that HTT secretion may be a normal, nonpathologic process. This may be a nonfunctional consequence of the role of HTT as a scaffolding protein in secretory vesicle trafficking and cell membrane fusion (Velier et al., 1998; Strehlow et al., 2007; Brandstaetter et al., 2014) but could also indicate an extracellular function of HTT.
These conflicting findings could be because of our more physiologically relevant model system (primary neurons expressing endogenous levels of FL, human wt, and mHTT in the absence of mouse Htt) rather than neuron-like cells overexpressing N-terminal HTT as well as mouse Htt. The increased toxicity of overexpressing N-terminal mHTT compared with FL mHTT expressed at endogenous levels may induce a compensatory mechanism leading to enhanced secretion. Secretory pathways may also differ between neuroblastoma cells and primary forebrain neurons. Interestingly, we also found that, at least in vitro, primary forebrain astrocytes do not secrete HTT, suggesting that this active mechanism may be solely neuronal. However, additional studies are required to investigate secretion from other CNS cell types.
To assess the physiological relevance of HTT secretion in vivo, we used a brain-penetrable nSMase inhibitor, PDDC, to suppress mHTT secretion in mice. We demonstrate that this active release process contributes significantly to CSF and plasma mHTT in Hu97/18 mice under both basal and neurotoxic conditions. These findings demonstrate that mHTT is actively secreted from cells in the CNS; however, despite the vast majority of CSF mHTT originating from the CNS (Southwell et al., 2015), we cannot exclude the potential contribution of peripheral cell secretion to CSF mHTT.
The glymphatic system is required for the clearance of interstitial fluids and solutes from the brain. Soluble amyloid β is known to be cleared from the brain via the glymphatic system (Iliff et al., 2012). Here we report that exogenous extracellular FL mHTT is cleared from the brain parenchyma to the CSF following delivery into the striatum of WT mice. We detected FL mHTT in the CSF as early as 30 min post-injection, consistent with rapid clearance by glymphatic convective bulk flow. However, a recent study has shown that IS injections can suppress glymphatic function (Mestre et al., 2018), suggesting that the temporal dynamics of mHTT efflux from the brain to the CSF seen in our studies may underestimate the normal physiological clearance rate of HTT. Despite this potential caveat, our data demonstrate that parenchyma-derived mHTT can be cleared to the CSF. Additionally, we show that suppressing AQP4 in the CNS leads to decreased CSF and plasma mHTT under both steady-state and acute neurotoxic conditions. This demonstrates a role of AQP4-dependent glymphatic flux in the clearance of extracellular mHTT from the brain.
Intrathecal infusion is being used to deliver HTT-lowering ASOs to the CNS in clinical trials for HD. Results from the first HTT-lowering clinical trial showed treatment-induced reduction of CSF mHTT, suggesting HTT target engagement in the CNS (Tabrizi et al., 2019). However, the magnitude of HTT lowering in different brain regions remains unclear. Preclinical studies in nonhuman primates have shown that intrathecal infusion of ASOs results in a concentration gradient in the brain (Kordasiewicz et al., 2012; Southwell et al., 2018) because of a combination of rapid CSF turnover and limited diffusion into the brain parenchyma (Pardridge, 2011). This suggests that the ASO-induced reduction of mHTT in CSF may represent more target engagement in superficial regions of the brain in close proximity to CSF flow, such as the spinal cord, choroid plexus, and cortex, than in deeper regions of the brain, such as the basal ganglia. Current estimates of HTT lowering in the human basal ganglia, predicted by reduction in CSF mHTT in ASO-treated patients, are based on nonhuman primate studies of ASO-mediated suppression of monkey HTT in healthy monkeys. Given the contribution of passive release of brain mHTT to the CSF, we expect CSF HTT dynamics to be different in healthy and neurodegenerative conditions. As a result, it is unknown to what extent these studies of HTT suppression in healthy monkeys have predictive value for CSF mHTT assessments of target engagement in HD patients.
Many questions involving the cell type and brain region source of mHTT in the CSF remain unanswered. We have previously shown that CNS cells derived from neural progenitors are the major source for mHTT in the CSF (Southwell et al., 2015). However, additional studies are required to evaluate the relative contribution of specific cell types to the pool of mHTT in CSF. Moreover, we have shown that neurodegeneration contributes to mHTT in the CSF, suggesting that the striatum and cortex, the regions of the brain most affected in HD, may contribute to mHTT in the CSF. However, the relative contributions of different brain regions remain unknown, demonstrating a need for additional studies of the origins of CSF HTT protein.
Overall, our data support the contribution of both passive release and active clearance of mHTT to CSF. We propose a unified mechanism where, under steady-state conditions, HTT is secreted from neurons in the brain into the extracellular compartment via the LE/Lys pathway (Fig. 8A). CSF from the paravascular space enters the brain parenchyma facilitated by the dense expression of AQP4 at astrocytic endfeet, which establishes convective bulk flow of interstitial fluid clearing HTT (and other solutes) from the extracellular space to the CSF and blood (Fig. 8B, top). Under neurodegenerative conditions, HTT is both actively secreted from cells and passively released from dying neurons into the extracellular space, leading to increased interstitial HTT, and is cleared by the glymphatic system into the CSF and blood (Fig. 8B, bottom). This model suggests that therapy-induced changes in CSF mHTT may represent both target engagement and preservation of neurons and that, in therapeutic efficacy trials, mHTT should be used in combination with biomarkers of neurodegeneration, such as NfL, to provide a more accurate measure of target engagement.
Figure 8.
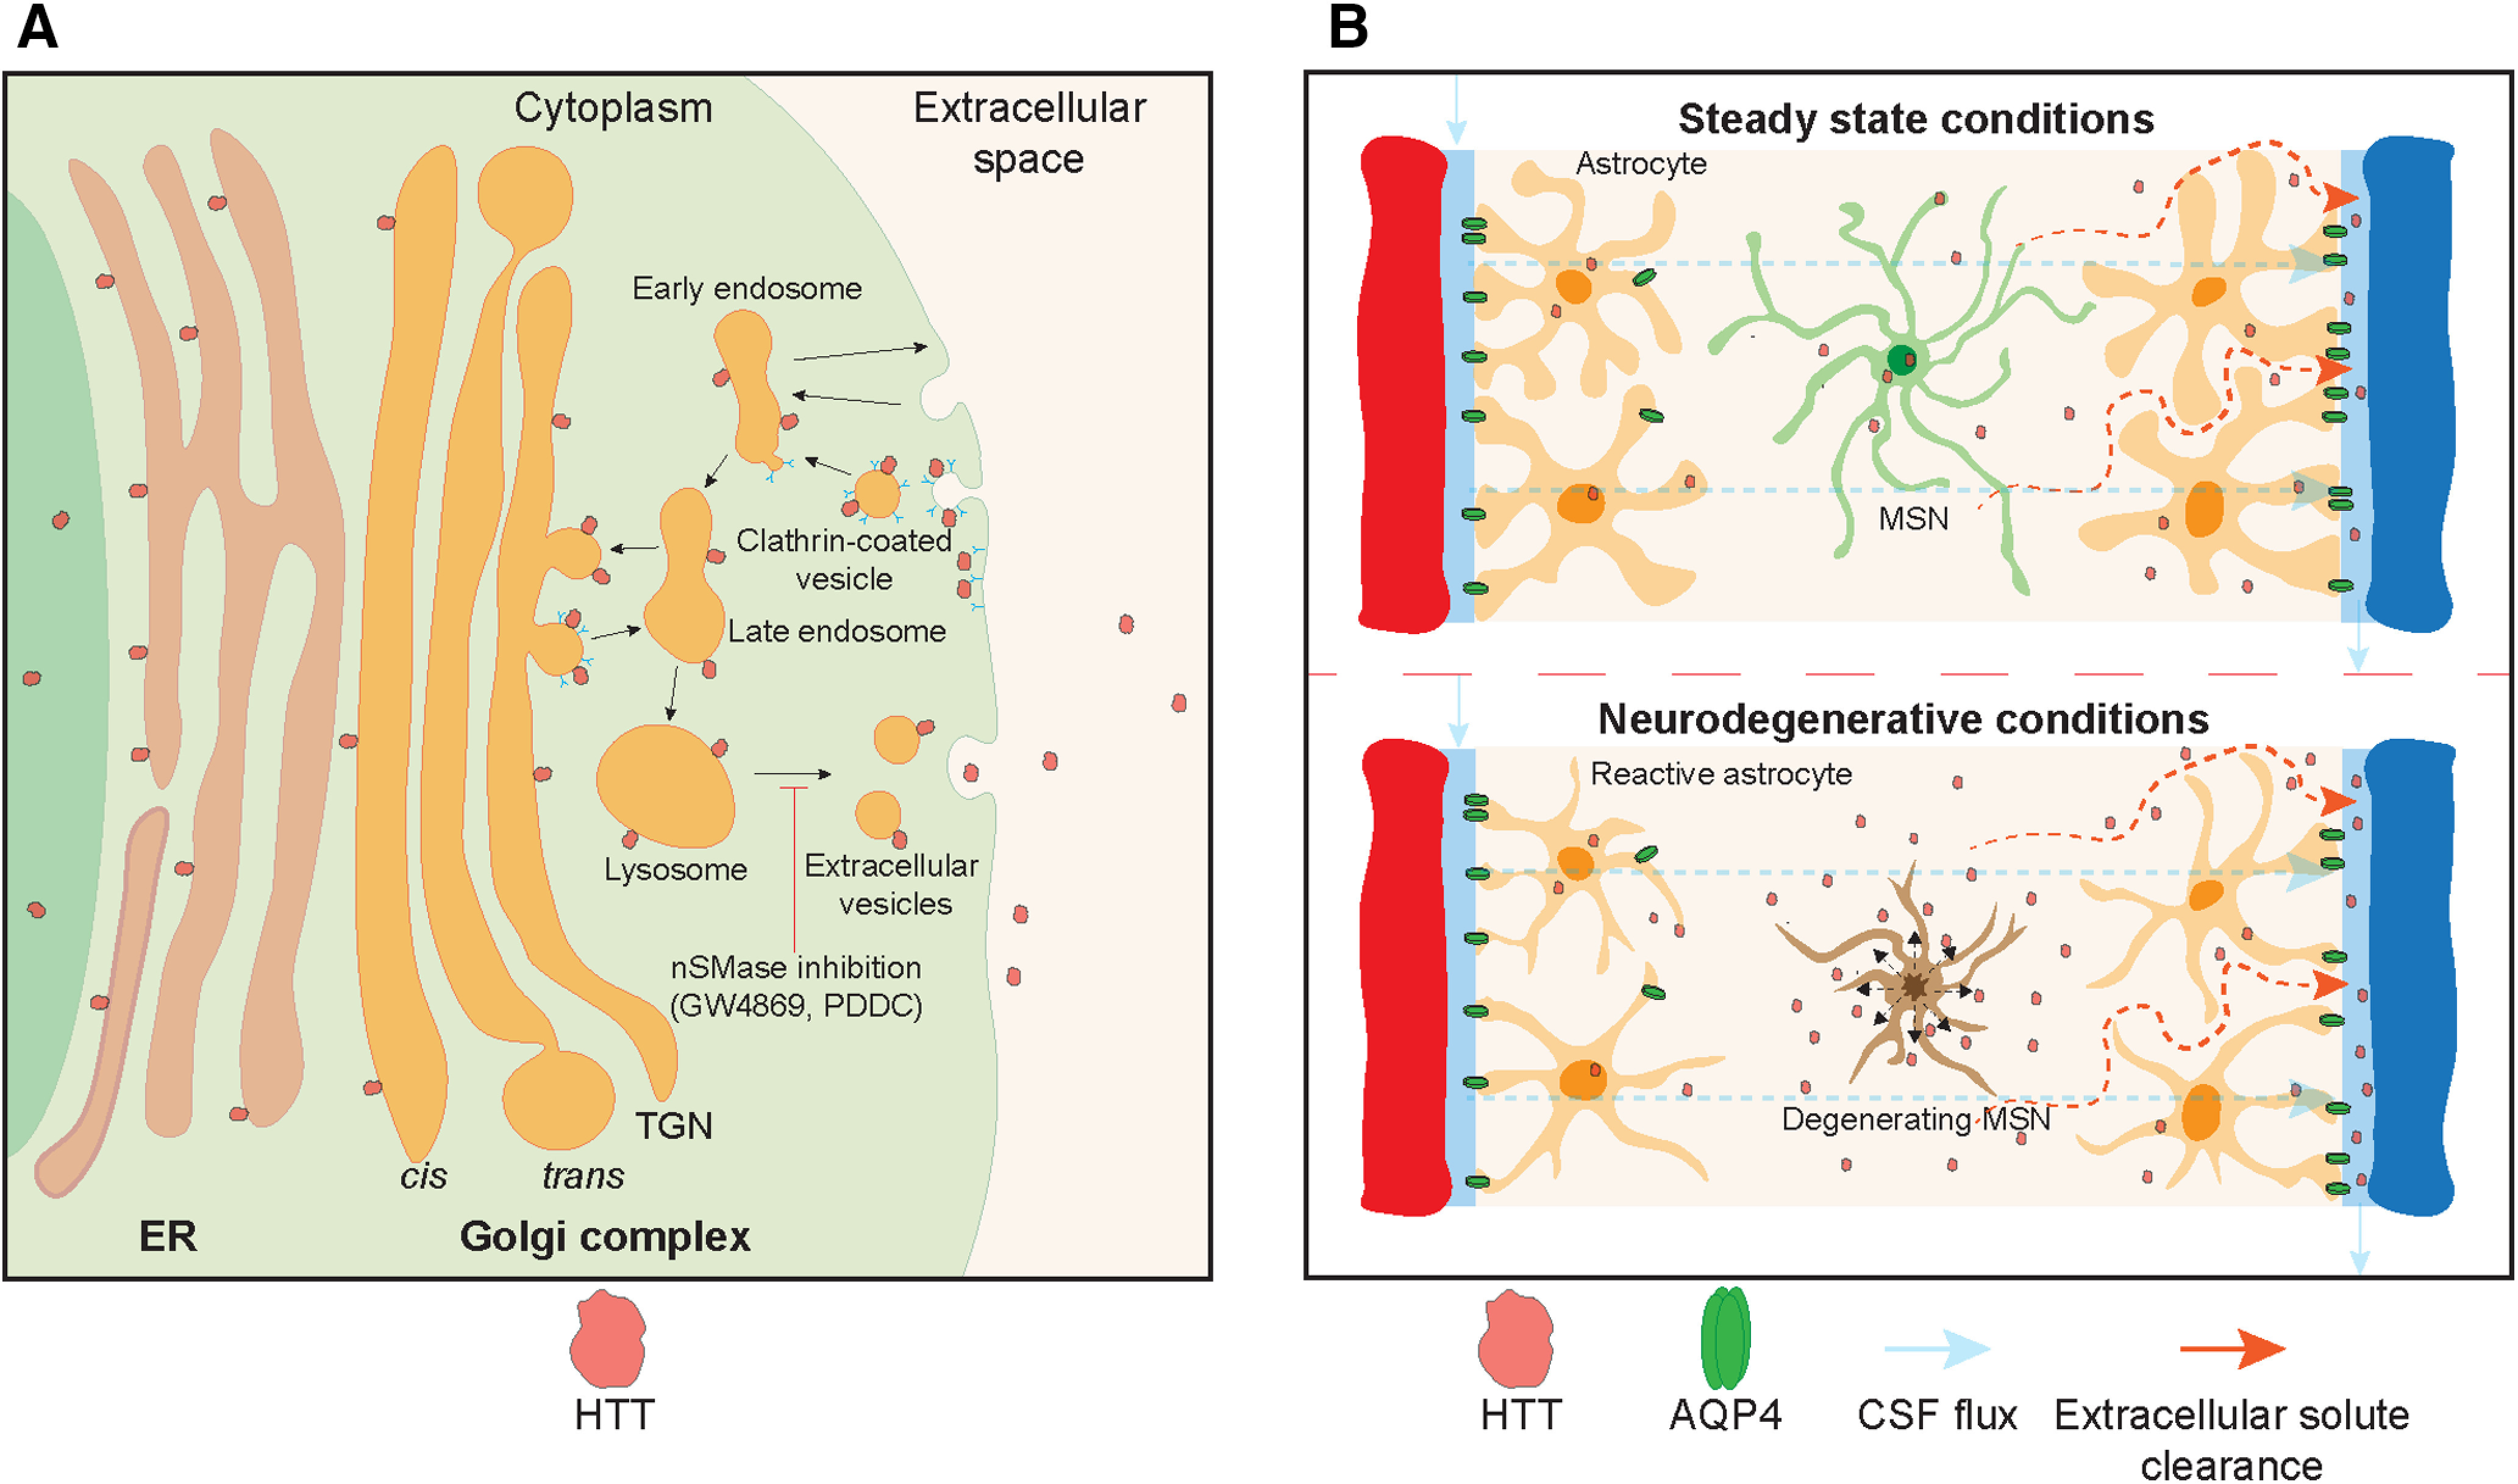
HTT is cleared from the brain to the CSF by active mechanisms. A, HTT is secreted from neurons in the CNS via a late endosomal/lysosomal secretory pathway. Pharmacological inhibition of nSMase using small-molecule inhibitors, GW4869 in vitro and PDDC in vitro or in vivo, can reduce secretion of HTT. B, Top, Once in the extracellular space, HTT is cleared from the parenchyma by convective bulk CSF flow facilitated by AQP4 water channels localized at astrocyte end-feet. Bottom, Under neurodegenerative conditions, HTT is released from dying neurons into the extracellular space and is cleared by the glymphatic system into the CSF and blood. Medium spiny neuron (MSN).
Footnotes
E.J.W. has participated in consultancy or advisory boards for Hoffman La Roche Ltd, Triplet Therapeutics, PTC Therapeutics, Shire Therapeutics, Wave Life Sciences, Mitoconix, Takeda, and Loqus23. All honoraria for these engagements were paid through the offices of UCL Consultants Ltd, a wholly owned subsidiary of University College, London. M.R.H. currently serves on the public boards of Ionis Pharmaceuticals, Xenon Pharmaceuticals, Aurinia Pharmaceuticals, and 89bio. The remaining authors declare no competing financial interests. M.R.H. currently serves on the public boards of Ionis Pharmaceuticals, Xenon Pharmaceuticals, Aurinia Pharmaceuticals, AbCellera and 89bio.
N.S.C. was supported by Canadian Institutes of Health Research (CIHR) Postdoctoral Fellowship, James Family Fellowship, and Huntington's Disease Society of America (HDSA) Berman/Topper HD Career Development Fellowship. A.E.A. was supported by British Columbia Children's Hospital Research Institute Mining for Miracles Postdoctoral Fellowship, and Michael Smith Foundation for Health Research Research Trainee Award. L.M.B. was supported by HDSA Berman/Topper HD Career Development Fellowship. H.F.B. was supported by CIHR CGS-M scholarship and British Columbia Children's Hospital Research Institute Graduate Scholarship. E.J.W. was supported by CHDI Foundation, Medical Research Council UK MR/M008592/1, and Hoffman La Roche academic research grant. J.-J.S. was supported by National Research Foundation of Korea 2016K1A1A2912057. Project operational support was provided by CIHR Foundation Grant FDN-154278 and Bev Hartig Huntington's Disease Foundation to M.R.H. Project operational support was provided by the HDSA and National Institute of Neurological Disorders and Stroke, National Institutes of Health R01NS116099 to A.L.S. We thank Anita Fazeli, Alicia Willenberg, Katlin Hencak, Casey Hart, Mark Wang, Qingwen Xia, and Benjamin Gordon for technical assistance and support; Katarina Trajkovic for discussion and support; Paul H. Patterson and the Developmental Studies Hybridoma Bank at the University of Iowa for the MW1 antibody; Barbara Slusher and Camillo Rojas for providing PDDC; Dagmar Ehrnhoefer for the adaptation of the TR-FRET assay with BKP1; and Ali Khoshnan for providing the lentiviral genome.
References
- Ammala C, Drury WJ 3rd, Knerr L, Ahlstedt I, Stillemark-Billton P, Wennberg-Huldt C, Andersson EM, Valeur E, Jansson-Lofmark R, Janzen D, Sundstrom L, Meuller J, Claesson J, Andersson P, Johansson C, Lee RG, Prakash TP, Seth PP, Monia BP, Andersson S (2018) Targeted delivery of antisense oligonucleotides to pancreatic beta-cells. Sci Adv 4:eaat3386. 10.1126/sciadv.aat3386 [DOI] [PMC free article] [PubMed] [Google Scholar]
- Babcock DT, Ganetzky B (2015) Transcellular spreading of huntingtin aggregates in the Drosophila brain. Proc Natl Acad Sci USA 112:E5427–E5433. 10.1073/pnas.1516217112 [DOI] [PMC free article] [PubMed] [Google Scholar]
- Bennett MJ, Huey-Tubman KE, Herr AB, West AP Jr, Ross SA, Bjorkman PJ (2002) A linear lattice model for polyglutamine in CAG-expansion diseases. Proc Natl Acad Sci USA 99:11634–11639. 10.1073/pnas.182393899 [DOI] [PMC free article] [PubMed] [Google Scholar]
- Brandstaetter H, Kruppa AJ, Buss F (2014) Huntingtin is required for ER-to-Golgi transport and for secretory vesicle fusion at the plasma membrane. Dis Model Mech 7:1335–1340. 10.1242/dmm.017368 [DOI] [PMC free article] [PubMed] [Google Scholar]
- Byrne LM, Rodrigues FB, Blennow K, Durr A, Leavitt BR, Roos RA, Scahill RI, Tabrizi SJ, Zetterberg H, Langbehn D, Wild EJ (2017) Neurofilament light protein in blood as a potential biomarker of neurodegeneration in Huntington's disease: a retrospective cohort analysis. Lancet Neurol 16:601–609. 10.1016/S1474-4422(17)30124-2 [DOI] [PMC free article] [PubMed] [Google Scholar]
- Byrne LM, Rodrigues FB, Johnson EB, Wijeratne PA, De Vita E, Alexander DC, Palermo G, Czech C, Schobel S, Scahill RI, Heslegrave A, Zetterberg H, Wild EJ (2018) Evaluation of mutant huntingtin and neurofilament proteins as potential markers in Huntington's disease. Sci Transl Med 10:eaat7108. [DOI] [PubMed] [Google Scholar]
- Caron NS, Dorsey ER, Hayden MR (2018) Therapeutic approaches to Huntington disease: from the bench to the clinic. Nat Rev Drug Discov 17:729–750. 10.1038/nrd.2018.133 [DOI] [PubMed] [Google Scholar]
- Caron NS, Southwell AL, Brouwers CC, Cengio LD, Xie Y, Black HF, Anderson LM, Ko S, Zhu X, van Deventer SJ, Evers MM, Konstantinova P, Hayden MR (2020) Potent and sustained huntingtin lowering via AAV5 encoding miRNA preserves striatal volume and cognitive function in a humanized mouse model of Huntington disease. Nucleic Acids Res 48:36–54. [DOI] [PMC free article] [PubMed] [Google Scholar]
- Carroll JB, Warby SC, Southwell AL, Doty CN, Greenlee S, Skotte N, Hung G, Bennett CF, Freier SM, Hayden MR (2011) Potent and selective antisense oligonucleotides targeting single-nucleotide polymorphisms in the Huntington disease gene/allele-specific silencing of mutant huntingtin. Mol Ther 19:2178–2185. 10.1038/mt.2011.201 [DOI] [PMC free article] [PubMed] [Google Scholar]
- Cicchetti F, Lacroix S, Cisbani G, Vallieres N, Saint-Pierre M, St-Amour I, Tolouei R, Skepper JN, Hauser RA, Mantovani D, Barker RA, Freeman TB (2014) Mutant huntingtin is present in neuronal grafts in Huntington disease patients. Ann Neurol 76:31–42. 10.1002/ana.24174 [DOI] [PubMed] [Google Scholar]
- Constantinescu R, Romer M, Oakes D, Rosengren L, Kieburtz K (2009) Levels of the light subunit of neurofilament triplet protein in cerebrospinal fluid in Huntington's disease. Parkinsonism Relat Disord 15:245–248. 10.1016/j.parkreldis.2008.05.012 [DOI] [PubMed] [Google Scholar]
- Constantinescu R, Romer M, Zetterberg H, Rosengren L, Kieburtz K (2011) Increased levels of total tau protein in the cerebrospinal fluid in Huntington's disease. Parkinsonism Relat Disord 17:714–715. 10.1016/j.parkreldis.2011.06.010 [DOI] [PubMed] [Google Scholar]
- Costanzo M, Abounit S, Marzo L, Danckaert A, Chamoun Z, Roux P, Zurzolo C (2013) Transfer of polyglutamine aggregates in neuronal cells occurs in tunneling nanotubes. J Cell Sci 126:3678–3685. 10.1242/jcs.126086 [DOI] [PubMed] [Google Scholar]
- de Almeida LP, Ross CA, Zala D, Aebischer P, Déglon N (2002) Lentiviral-mediated delivery of mutant huntingtin in the striatum of rats induces a selective neuropathology modulated by polyglutamine repeat size, huntingtin expression levels, and protein length. J Neurosci 22:3473–3483. [DOI] [PMC free article] [PubMed] [Google Scholar]
- DiFiglia M, Sapp E, Chase KO, Davies SW, Bates GP, Vonsattel JP, Aronin N (1997) Aggregation of huntingtin in neuronal intranuclear inclusions and dystrophic neurites in brain. Science 277:1990–1993. 10.1126/science.277.5334.1990 [DOI] [PubMed] [Google Scholar]
- DiFiglia M, Sena-Esteves M, Chase K, Sapp E, Pfister E, Sass M, Yoder J, Reeves P, Pandey RK, Rajeev KG, Manoharan M, Sah DW, Zamore PD, Aronin N (2007) Therapeutic silencing of mutant huntingtin with siRNA attenuates striatal and cortical neuropathology and behavioral deficits. Proc Natl Acad Sci USA 104:17204–17209. 10.1073/pnas.0708285104 [DOI] [PMC free article] [PubMed] [Google Scholar]
- Ehrnhoefer DE, Southwell AL, Sivasubramanian M, Qiu X, Villanueva EB, Xie Y, Waltl S, Anderson L, Fazeli A, Casal L, Felczak B, Tsang M, Hayden MR (2018a) HACE1 is essential for astrocyte mitochondrial function and influences Huntington disease phenotypes in vivo. Hum Mol Genet 27:239–253. 10.1093/hmg/ddx394 [DOI] [PMC free article] [PubMed] [Google Scholar]
- Ehrnhoefer DE, Martin DD, Schmidt ME, Qiu X, Ladha S, Caron NS, Skotte NH, Nguyen YTN, Vaid K, Southwell AL, Engemann S, Franciosi S, Hayden MR (2018b) Preventing mutant huntingtin proteolysis and intermittent fasting promote autophagy in models of Huntington disease. Acta Neuropathol Commun 6:16. 10.1186/s40478-018-0518-0 [DOI] [PMC free article] [PubMed] [Google Scholar]
- Franich NR, Fitzsimons HL, Fong DM, Klugmann M, During MJ, Young D (2008) AAV vector-mediated RNAi of mutant huntingtin expression is neuroprotective in a novel genetic rat model of Huntington's disease. Mol Ther 16:947–956. 10.1038/mt.2008.50 [DOI] [PMC free article] [PubMed] [Google Scholar]
- Graham RK, Deng Y, Slow EJ, Haigh B, Bissada N, Lu G, Pearson J, Shehadeh J, Bertram L, Murphy Z, Warby SC, Doty CN, Roy S, Wellington CL, Leavitt BR, Raymond LA, Nicholson DW, Hayden MR (2006) Cleavage at the caspase-6 site is required for neuronal dysfunction and degeneration due to mutant huntingtin. Cell 125:1179–1191. 10.1016/j.cell.2006.04.026 [DOI] [PubMed] [Google Scholar]
- Gray M, Shirasaki DI, Cepeda C, Andre VM, Wilburn B, Lu XH, Tao J, Yamazaki I, Li SH, Sun YE, Li XJ, Levine MS, Yang XW (2008) Full-length human mutant huntingtin with a stable polyglutamine repeat can elicit progressive and selective neuropathogenesis in BACHD mice. J Neurosci 28:6182–6195. 10.1523/JNEUROSCI.0857-08.2008 [DOI] [PMC free article] [PubMed] [Google Scholar]
- Harper SQ, Staber PD, He X, Eliason SL, Martins IH, Mao Q, Yang L, Kotin RM, Paulson HL, Davidson BL (2005) RNA interference improves motor and neuropathological abnormalities in a Huntington's disease mouse model. Proc Natl Acad Sci USA 102:5820–5825. 10.1073/pnas.0501507102 [DOI] [PMC free article] [PubMed] [Google Scholar]
- Huntington's Disease Collaborative Research Group (1993) A novel gene containing a trinucleotide repeat that is expanded and unstable on Huntington's disease chromosomes. Cell 72:971–983. [DOI] [PubMed] [Google Scholar]
- Iliff JJ, Wang M, Liao Y, Plogg BA, Peng W, Gundersen GA, Benveniste H, Vates GE, Deane R, Goldman SA, Nagelhus EA, Nedergaard M (2012) A paravascular pathway facilitates CSF flow through the brain parenchyma and the clearance of interstitial solutes, including amyloid beta. Sci Transl Med 4:147ra111. 10.1126/scitranslmed.3003748 [DOI] [PMC free article] [PubMed] [Google Scholar]
- Jeon I, Cicchetti F, Cisbani G, Lee S, Li E, Bae J, Lee N, Li L, Im W, Kim M, Kim HS, Oh SH, Kim TA, Ko JJ, Aube B, Oueslati A, Kim YJ, Song J (2016) Human-to-mouse prion-like propagation of mutant huntingtin protein. Acta Neuropathol 132:577–592. [DOI] [PMC free article] [PubMed] [Google Scholar]
- Khasawneh AH, Garling RJ, Harris CA (2018) Cerebrospinal fluid circulation: what do we know and how do we know it? Brain Circ 4:14–18. 10.4103/bc.bc_3_18 [DOI] [PMC free article] [PubMed] [Google Scholar]
- Koller E, Vincent TM, Chappell A, De S, Manoharan M, Bennett CF (2011) Mechanisms of single-stranded phosphorothioate modified antisense oligonucleotide accumulation in hepatocytes. Nucleic Acids Res 39:4795–4807. 10.1093/nar/gkr089 [DOI] [PMC free article] [PubMed] [Google Scholar]
- Kordasiewicz HB, Stanek LM, Wancewicz EV, Mazur C, McAlonis MM, Pytel KA, Artates JW, Weiss A, Cheng SH, Shihabuddin LS, Hung G, Bennett CF, Cleveland DW (2012) Sustained therapeutic reversal of Huntington's disease by transient repression of huntingtin synthesis. Neuron 74:1031–1044. 10.1016/j.neuron.2012.05.009 [DOI] [PMC free article] [PubMed] [Google Scholar]
- Machida Y, Okada T, Kurosawa M, Oyama F, Ozawa K, Nukina N (2006) rAAV-mediated shRNA ameliorated neuropathology in Huntington disease model mouse. Biochem Biophys Res Commun 343:190–197. 10.1016/j.bbrc.2006.02.141 [DOI] [PubMed] [Google Scholar]
- Mestre H, Hablitz LM, Xavier AL, Feng W, Zou W, Pu T, Monai H, Murlidharan G, Castellanos Rivera RM, Simon MJ, Pike MM, Plá V, Du T, Kress BT, Wang X, Plog BA, Thrane AS, Lundgaard I, Abe Y, Yasui M, et al. (2018) Aquaporin-4-dependent glymphatic solute transport in the rodent brain. Elife 7:e40070 10.7554/eLife.40070 [DOI] [PMC free article] [PubMed] [Google Scholar]
- Oshio K, Watanabe H, Song Y, Verkman AS, Manley GT (2005) Reduced cerebrospinal fluid production and intracranial pressure in mice lacking choroid plexus water channel Aquaporin-1. FASEB J 19:76–78. 10.1096/fj.04-1711fje [DOI] [PubMed] [Google Scholar]
- Owens GE, New DM, West AP Jr, Bjorkman PJ (2015) Anti-PolyQ antibodies recognize a short PolyQ stretch in both normal and mutant Huntingtin exon 1. J Mol Biol 427:2507–2519. 10.1016/j.jmb.2015.05.023 [DOI] [PMC free article] [PubMed] [Google Scholar]
- Pardridge WM. (2011) Drug transport in brain via the cerebrospinal fluid. Fluids Barriers CNS 8:7. 10.1186/2045-8118-8-7 [DOI] [PMC free article] [PubMed] [Google Scholar]
- Pecho-Vrieseling E, Rieker C, Fuchs S, Bleckmann D, Esposito MS, Botta P, Goldstein C, Bernhard M, Galimberti I, Muller M, Luthi A, Arber S, Bouwmeester T, van der Putten H, Di Giorgio FP (2014) Transneuronal propagation of mutant huntingtin contributes to non-cell autonomous pathology in neurons. Nat Neurosci 17:1064–1072. 10.1038/nn.3761 [DOI] [PubMed] [Google Scholar]
- Rodrigues FB, Byrne L, McColgan P, Robertson N, Tabrizi SJ, Leavitt BR, Zetterberg H, Wild EJ (2016) Cerebrospinal fluid total tau concentration predicts clinical phenotype in Huntington's disease. J Neurochem 139:22–25. 10.1111/jnc.13719 [DOI] [PMC free article] [PubMed] [Google Scholar]
- Rodriguez-Lebron E, Denovan-Wright EM, Nash K, Lewin AS, Mandel RJ (2005) Intrastriatal rAAV-mediated delivery of anti-huntingtin shRNAs induces partial reversal of disease progression in R6/1 Huntington's disease transgenic mice. Mol Ther 12:618–633. 10.1016/j.ymthe.2005.05.006 [DOI] [PMC free article] [PubMed] [Google Scholar]
- Rojas C, Sala M, Thomas AG, Datta Chaudhuri A, Yoo SW, Li Z, Dash RP, Rais R, Haughey NJ, Nencka R, Slusher B (2019) A novel and potent brain penetrant inhibitor of extracellular vesicle release. Br J Pharmacol 176:3857–3870. 10.1111/bph.14789 [DOI] [PMC free article] [PubMed] [Google Scholar]
- Seong IS, Woda JM, Song JJ, Lloret A, Abeyrathne PD, Woo CJ, Gregory G, Lee JM, Wheeler VC, Walz T, Kingston RE, Gusella JF, Conlon RA, MacDonald ME (2010) Huntingtin facilitates polycomb repressive complex 2. Hum Mol Genet 19:573–583. 10.1093/hmg/ddp524 [DOI] [PMC free article] [PubMed] [Google Scholar]
- Skotte NH, Southwell AL, Ostergaard ME, Carroll JB, Warby SC, Doty CN, Petoukhov E, Vaid K, Kordasiewicz H, Watt AT, Freier SM, Hung G, Seth PP, Bennett CF, Swayze EE, Hayden MR (2014) Allele-specific suppression of mutant huntingtin using antisense oligonucleotides: providing a therapeutic option for all Huntington disease patients. PLoS One 9:e107434. 10.1371/journal.pone.0107434 [DOI] [PMC free article] [PubMed] [Google Scholar]
- Slow EJ, van Raamsdonk J, Rogers D, Coleman SH, Graham RK, Deng Y, Oh R, Bissada N, Hossain SM, Yang YZ, Li XJ, Simpson EM, Gutekunst CA, Leavitt BR, Hayden MR (2003) Selective striatal neuronal loss in a YAC128 mouse model of Huntington disease. Hum Mol Genet 12:1555–1567. 10.1093/hmg/ddg169 [DOI] [PubMed] [Google Scholar]
- Southwell AL, Ko J, Patterson PH (2009) Intrabody gene therapy ameliorates motor, cognitive, and neuropathological symptoms in multiple mouse models of Huntington's disease. J Neurosci 29:13589–13602. 10.1523/JNEUROSCI.4286-09.2009 [DOI] [PMC free article] [PubMed] [Google Scholar]
- Southwell AL, Warby SC, Carroll JB, Doty CN, Skotte NH, Zhang W, Villanueva EB, Kovalik V, Xie Y, Pouladi MA, Collins JA, Yang XW, Franciosi S, Hayden MR (2013) A fully humanized transgenic mouse model of Huntington disease. Hum Mol Genet 22:18–34. 10.1093/hmg/dds397 [DOI] [PMC free article] [PubMed] [Google Scholar]
- Southwell AL, Skotte NH, Kordasiewicz HB, Ostergaard ME, Watt AT, Carroll JB, Doty CN, Villanueva EB, Petoukhov E, Vaid K, Xie Y, Freier SM, Swayze EE, Seth PP, Bennett CF, Hayden MR (2014) In vivo evaluation of candidate allele-specific mutant huntingtin gene silencing antisense oligonucleotides. Mol Ther 22:2093–2106. 10.1038/mt.2014.153 [DOI] [PMC free article] [PubMed] [Google Scholar]
- Southwell AL, Smith SE, Davis TR, Caron NS, Villanueva EB, Xie Y, Collins JA, Ye ML, Sturrock A, Leavitt BR, Schrum AG, Hayden MR (2015) Ultrasensitive measurement of huntingtin protein in cerebrospinal fluid demonstrates increase with Huntington disease stage and decrease following brain huntingtin suppression. Sci Rep 5:12166. 10.1038/srep12166 [DOI] [PMC free article] [PubMed] [Google Scholar]
- Southwell AL, Kordasiewicz HB, Langbehn D, Skotte NH, Parsons MP, Villanueva EB, Caron NS, Ostergaard ME, Anderson LM, Xie Y, Cengio LD, Findlay-Black H, Doty CN, Fitsimmons B, Swayze EE, Seth PP, Raymond LA, Bennett CF, Hayden MR (2018) Huntingtin suppression restores cognitive function in a mouse model of Huntington's disease. Sci Transl Med 10:eaar3959. [DOI] [PubMed] [Google Scholar]
- Soylu-Kucharz R, Sandelius Å, Sjögren M, Blennow K, Wild EJ, Zetterberg H, Björkqvist M (2017) Neurofilament light protein in CSF and blood is associated with neurodegeneration and disease severity in Huntington's disease R6/2 mice. Sci Rep 7:14114. 10.1038/s41598-017-14179-1 [DOI] [PMC free article] [PubMed] [Google Scholar]
- Stanek LM, Yang W, Angus S, Sardi PS, Hayden MR, Hung GH, Bennett CF, Cheng SH, Shihabuddin LS (2013) Antisense oligonucleotide-mediated correction of transcriptional dysregulation is correlated with behavioral benefits in the YAC128 mouse model of Huntington's disease. J Huntingtons Dis 2:217–228. 10.3233/JHD-130057 [DOI] [PubMed] [Google Scholar]
- Stanek LM, Sardi SP, Mastis B, Richards AR, Treleaven CM, Taksir T, Misra K, Cheng SH, Shihabuddin LS (2014) Silencing mutant huntingtin by adeno-associated virus-mediated RNA interference ameliorates disease manifestations in the YAC128 mouse model of Huntington's disease. Hum Gene Ther 25:461–474. 10.1089/hum.2013.200 [DOI] [PMC free article] [PubMed] [Google Scholar]
- Strehlow AN, Li JZ, Myers RM (2007) Wild-type huntingtin participates in protein trafficking between the Golgi and the extracellular space. Hum Mol Genet 16:391–409. 10.1093/hmg/ddl467 [DOI] [PubMed] [Google Scholar]
- Tabrizi SJ, Leavitt BR, Landwehrmeyer GB, Wild EJ, Saft C, Barker RA, Blair NF, Craufurd D, Priller J, Rickards H, Rosser A, Kordasiewicz HB, Czech C, Swayze EE, Norris DA, Baumann T, Gerlach I, Schobel SA, Paz E, Smith AV, et al. (2019) Targeting Huntingtin expression in patients with Huntington's disease. N Engl J Med 380:2307–2316. 10.1056/NEJMoa1900907 [DOI] [PubMed] [Google Scholar]
- Trajkovic K, Jeong H, Krainc D (2017) Mutant Huntingtin is secreted via a late endosomal/lysosomal unconventional secretory pathway. J Neurosci 37:9000–9012. 10.1523/JNEUROSCI.0118-17.2017 [DOI] [PMC free article] [PubMed] [Google Scholar]
- Velier J, Kim M, Schwarz C, Kim TW, Sapp E, Chase K, Aronin N, DiFiglia M (1998) Wild-type and mutant huntingtins function in vesicle trafficking in the secretory and endocytic pathways. Exp Neurol 152:34–40. 10.1006/exnr.1998.6832 [DOI] [PubMed] [Google Scholar]
- Wang YL, Liu W, Wada E, Murata M, Wada K, Kanazawa I (2005) Clinico-pathological rescue of a model mouse of Huntington's disease by siRNA. Neurosci Res 53:241–249. 10.1016/j.neures.2005.06.021 [DOI] [PubMed] [Google Scholar]
- Weiss A, Abramowski D, Bibel M, Bodner R, Chopra V, DiFiglia M, Fox J, Kegel K, Klein C, Grueninger S, Hersch S, Housman D, Regulier E, Rosas HD, Stefani M, Zeitlin S, Bilbe G, Paganetti P (2009) Single-step detection of mutant huntingtin in animal and human tissues: a bioassay for Huntington's disease. Anal Biochem 395:8–15. 10.1016/j.ab.2009.08.001 [DOI] [PubMed] [Google Scholar]
- Wild EJ, Boggio R, Langbehn D, Robertson N, Haider S, Miller JR, Zetterberg H, Leavitt BR, Kuhn R, Tabrizi SJ, Macdonald D, Weiss A (2015) Quantification of mutant huntingtin protein in cerebrospinal fluid from Huntington's disease patients. J Clin Invest 125:1979–1986. 10.1172/JCI80743 [DOI] [PMC free article] [PubMed] [Google Scholar]
- Zhang X, Abels ER, Redzic JS, Margulis J, Finkbeiner S, Breakefield XO (2016) Potential transfer of polyglutamine and CAG-repeat RNA in extracellular vesicles in Huntington's disease: background and evaluation in cell culture. Cell Mol Neurobiol 36:459–470. 10.1007/s10571-016-0350-7 [DOI] [PMC free article] [PubMed] [Google Scholar]