Abstract
Many questions in cell biology can be solved by state-of-the-art technology of live cell imaging. One good example is the mechanism of membrane traffic, in which small membrane carriers are rapidly moving around in the cytoplasm to deliver cargo proteins between organelles. For directly visualizing the events in membrane trafficking system, researchers have long awaited the technology that enables simultaneous multi-color and four-dimensional observation at high space and time resolution. Super-resolution microscopy methods, for example STED, PALM/STORM, and SIM, provide greater spatial resolution, however, these methods are not enough in temporal resolution. The super-resolution confocal live imaging microscopy (SCLIM) that we developed has now achieved the performance required. By using SCLIM, we have conducted high spatiotemporal visualization of secretory cargo together with early and late Golgi resident proteins tagged with three different fluorescence proteins. We have demonstrated that secretory cargo is indeed delivered within the Golgi by cisternal maturation. In addition, we have visualized details of secretory cargo trafficking in the Golgi, including formation of zones within a maturing cisterna, in which Golgi resident proteins are segregated, and movement of cargo between these zones. This protocol can be used for simultaneous three-color and four-dimensional observation of various phenomena in living cells, from yeast to higher plants and animals, at high spatiotemporal resolution.
Keywords: Live cell imaging, Simultaneous 3-color and 4-dimensional observation, Super-resolution and high-speed observation, Secretory cargo, Golgi
Background
Development of live cell imaging by state-of-the-art light microscopy has greatly contributed to address many problems remaining in cell biology. For example, to visualize the events in secretory pathway, in which small membrane carriers are rapidly moving around in the cytoplasm, requires high speed and three-dimensional (3D) image acquisition. Super-resolution confocal live imaging microscopy (SCLIM), which we have developed (Kurokawa et al., 2013), can achieve high speed visualization of dynamic behavior of 3D structures tagged with green and red fluorescence proteins in living cells with spatial resolution beyond the diffraction limit of light (Matsuura-Tokita et al., 2006; Ito et al., 2012; Okamoto et al., 2012; Suda et al., 2013; Uemura et al., 2014; Kurokawa et al., 2014; Iwai et al., 2016; Ishii et al., 2016 and 2019; Kurokawa et al., 2016). We can now use 3-color version of SCLIM, which enable us to conduct simultaneous 3-color (green, red, and infrared) observation in living yeast, Drosophila, plant, and mammalian cells at high spatial and time resolution (Ito et al., 2018; Kurokawa et al., 2019; Maeda et al., 2019; Tojima et al., 2019; Fujii et al., 2020). We have been working on the molecular mechanisms underlying protein transport and sorting in the Golgi apparatus and have utilized the cutting-edge performance of our technology to tackle a big question in this field. The purpose of this article is to introduce to readers our approaches by super-resolution and high-speed live cell imaging and provide basic protocols.
The Golgi apparatus is the central station of membrane traffic. One third of proteins in eukaryotic cells are newly synthesized in the endoplasmic reticulum (ER) and then delivered to the Golgi. In the Golgi, they are processed and glycosylated before being sorted to their final destinations (Emr et al., 2009). The Golgi is usually in the form of ordered stacks of several cisternae. Secretory cargo travels across the stack from the cis side to the trans side of cisternae and then to the trans-Golgi network (TGN) (Griffiths and Simons, 1986). The budding yeast Saccharomyces cerevisiae presents a unique example of the Golgi, in which individual cisternae, cis, medial and trans, do not stack but scatter in the cytoplasm (Matsuura-Tokita et al., 2006; Okamoto et al., 2012). Three major models of secretory cargo traffic within the Golgi have been proposed: 1) traffic via cisternal maturation, 2) traffic by anterograde vesicular carriers, and 3) traffic via interconnected continuity of cisternae (Glick and Nakano, 2009; Nakano and Luini, 2010; Pfeffer, 2010; Glick and Luini, 2011). Among these models, the cisternal maturation model has been favored to explain the live imaging observation in budding yeast that Golgi cisternae mature from early to late cisternae (Losev et al., 2006; Matsuura-Tokita et al., 2006; Rivera-Molina and Novick, 2009) and the movement of large cargo through the Golgi stacks without leaving cisternae in mammals (Bonfanti et al., 1998; Lanoix et al., 2001; Martinez-Menarguez et al., 2001; Mironov et al., 2001).The lacking proof of this mechanism was to visualize the delivery of cargo remaining in the maturing Golgi cisterna.
Electron microscopy shows detailed snap information where secretory cargo and Golgi resident proteins localize in the individual Golgi cisternae, but cannot directly visualize how secretory cargo traverse between these cisternae. Live imaging by using conventional epi- and confocal fluorescence microscopies visualize behavior of secretory cargo in vivo, but cannot provide detailed information where secretory cargo and Golgi resident proteins locate within the individual Golgi cisternae because of low spatial resolution. Super-resolution microscopy methods, for example STED, PALM/STORM, and SIM overcoming the diffraction limit of light, provide greater spatial resolution (Schermelleh et al., 2010). However, these methods are not high in temporal resolution, because time and space resolutions usually trade off each other. By using SCLIM technology, we have shown that secretory cargo is delivered within the Golgi by cisternal maturation. Maturing cisterna involves segregated zones of the earlier and later Golgi resident proteins. The location of cargo changes from the early to the late zone within the cisterna during the progression of maturation (Kurokawa et al., 2019).
Materials and Reagents
90 mm diameter Cell culture dishes, sterile (Iwaki, catalog number: SH90-15)
22 mm x 40 mm Micro cover glasses (Matusnami Glass, thickness No.1, 0.13-0.17mm)
18 mm x 18 mm Micro cover glasses (Matusnami Glass, thickness No.1, 0.13-0.17mm)
20 ml Syringes (Terumo, catalog number: SS-20ESZ)
Pipette tips, sterile (Sorenson, 1-200 µl Graduated tip, catalog number: 27730)
Kimwipes (Nihon Seishi, catalog number: 62011)
Tissue culture test plates, 24-well plate, sterile (TPP, catalog number: 92424)
Toothpicks sterilized before use (any brand)
Budding yeast cells expressing two Golgi markers and secretory cargo tagged with different fluorescent proteins. (see Procedure B for details)
Silicon grease (Dow Corning Toray, catalog number: HVG-50 TUBE)
Concanavalin A (Sigma-Aldrich, catalog number: C2010)
Yeast nitrogen base without amino acids (Difco Laboratories)
Casamino acids (Difco Laboratories)
Glucose (Nacalai Tesque)
Agar (Wako)
MCD agar plates (see Recipes)
MCD medium (see Recipes)
Equipment
Micropipette (Gilson, Pipetman, model: P200)
Bio Shaker (Taitec, model: M-BR-022UP)
-
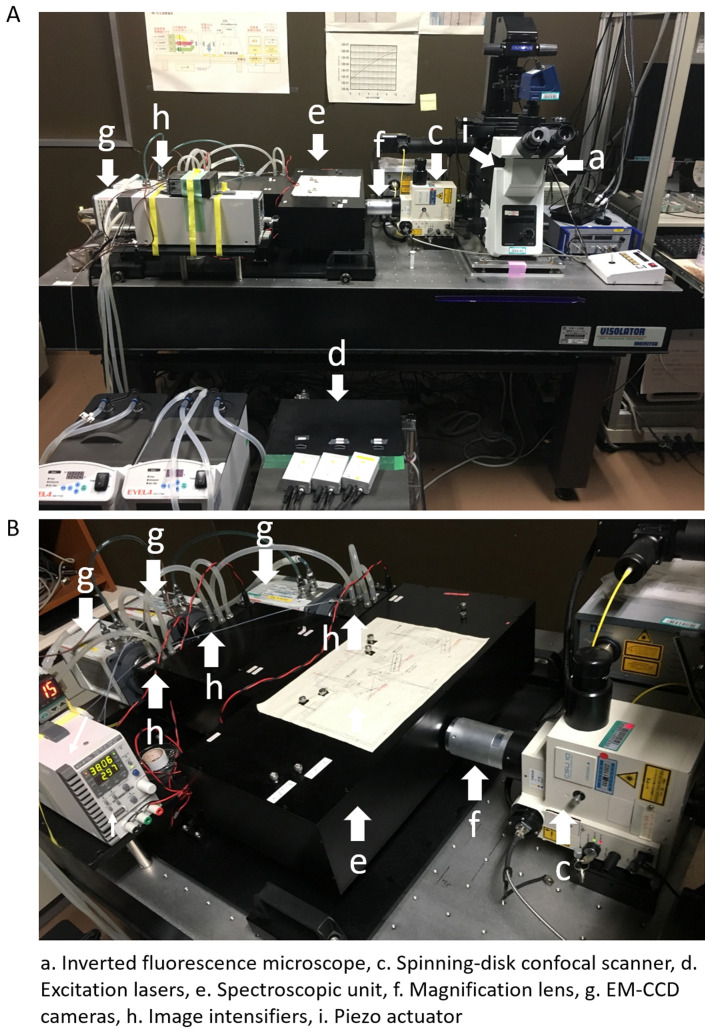
SCLIM (Figure 1) is equipped with:
Inverted fluorescence microscope (Olympus, model: IX-73)
Objective lens (Olympus, UPlanSApo 100x NA 1.4 oil objective lens)
-
Spinning-disk confocal scanner (Yokogawa Electric, CSU10 custom made model)
Other type of CSU can be used (e.g., CSU10, CSUX1, CSUW1). Confocal scanner is equipped with custom made dichroic mirror having high spectroscopic properties for 3-color observation (Kurokawa et al., 2013).
-
Excitation lasers: Solid-state 3 lasers with emission at 473 nm (Cobolt, CW 473nm, DPSS, 50 mW), 561 nm (Cobolt, CW 561 nm, DPSS, 50 mW), and 671 nm (CrystaLaser, CW 671 nm, DPSS, 100 mW)
These 3 lasers can excite GFP, mRFP or mCherry, and iRFP simultaneously. Irradiation of the sample by these 3 lasers is controlled by 3 independent electromagnetic shutters (Sigma Koki). These shutters are operated by the demand of the custom-made software. Irradiation powers of 3 lasers can be adjusted with variable ND filters.
-
Spectroscopic unit: A custom made system equipped with custom-made dichroic mirrors, reflection mirrors, band pass filters, and long pass filter to separate 3-color fluorescence (green, red, and infra-red) images to 3 different channels (Kurokawa et al., 2013)
The angles of dichroic mirrors and reflection mirrors can be adjusted from outside of the spectroscopic unit.
-
Magnification lens (NIKON, VM lens C-4x [4x] or C-4x plus C-2.5x [10x])
A magnification lens is putted in the light path between the confocal scanner and spectroscopic unit for raising spatial resolution.
-
EM-CCD cameras (Hamamatsu Photonics, C9100-13)
They contain 512 x 512 frame transfer CCD sensor. Pixel size of sensor is 16 x 16 µm. 3 EM-CCD cameras are set up for taking green, red, and infra-red fluorescence images.
-
Image intensifier (Hamamatsu Photonics)
3 Image intensifiers are equipped with each 3 EMCCD cameras. Image intensifiers are cooled with a custom-made cooling system to achieve low signal-to-noise ratio amplification. The amplification gain of these 3 image intensifiers are controlled independently.
-
Piezo actuator (Yokogawa Electric, custom made model)
It is equipped at the neck of objective lens to oscillate Z-axis position of the lens at high frequency (maximum, 30 Hz). Normally, we use it at 4-15 Hz.
-
Thermo-control stage (Tokai Hit)
The temperature of the sample during observation can be controlled by thermo-control stage.
-
Image acquisition system
Custom made system controls simultaneous collection of 3 EM-CCD camera’s images at each Z-axis position and each time point (Yokogawa Electric).
Figure 1. Set up of 3-color SCLIM.
A. An inverted microscopy (a) is combined with, an ultra-fast piezo actuator (i), a custom-made spinning-disk confocal scanner (c), 3 excitation lasers (d), a magnifier lens (f), a custom-made spectroscopic unit (containing dichroic mirrors, refraction mirrors, and band-pass and long-pass filters) (e), 3 cooled image intensifiers (h), and 3 EM-CCD cameras (g). B. Another view of the custom-made spectroscopic unit (e), 3 cooled image intensifiers (h), and 3 EM-CCD cameras (g) is shown.
Software
Volocity software (PerkinElmer)
MetaMorph software (Molecular Devices)
Procedure
-
Preparation of a Concanavalin A-coated glass dish for imaging living yeast cells
Concanavalin A is used to immobilize living yeast cells on the cover glass surface for microscopic observation.
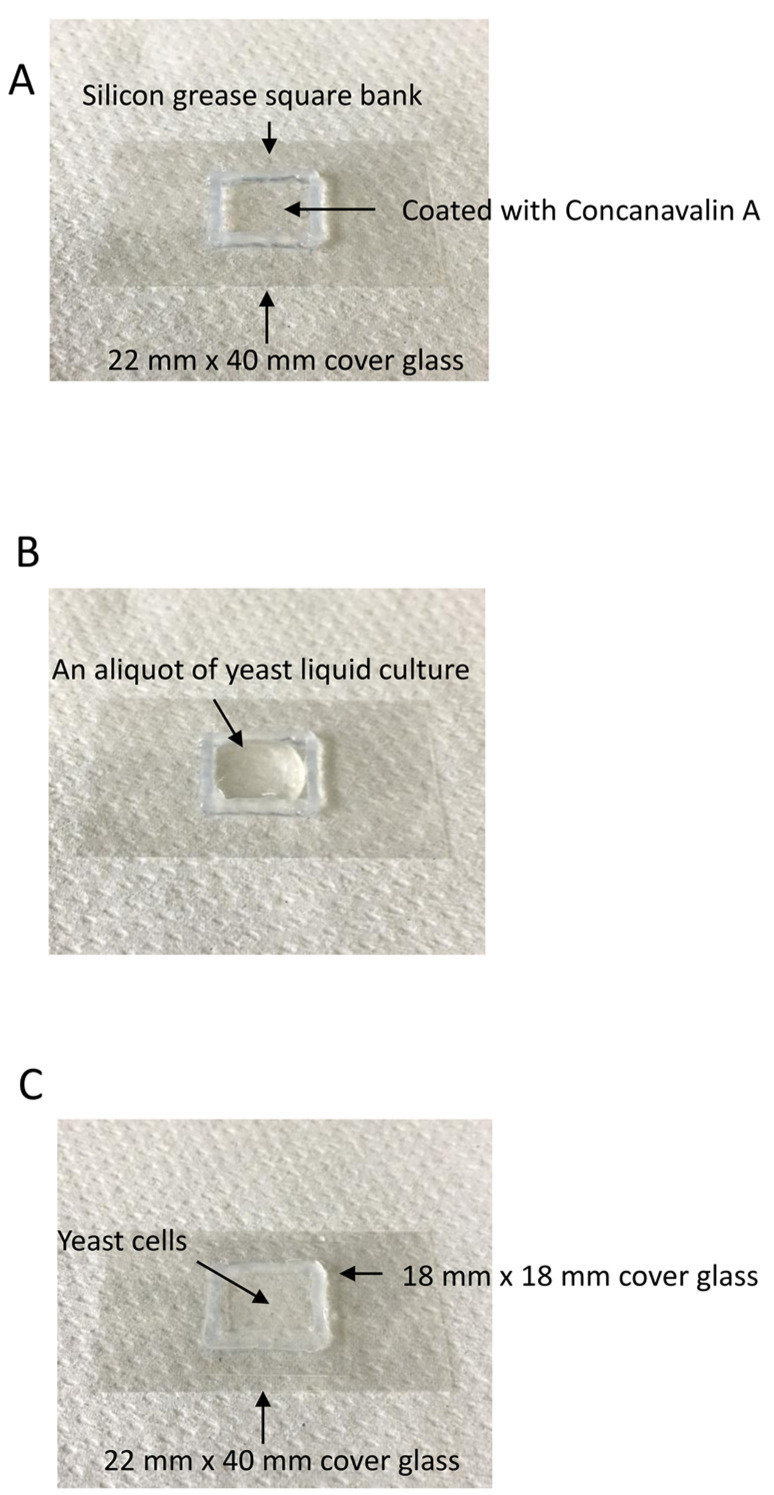
Make a square bank in 1-2 mm depth of 18 mm x 18 mm or less with silicon grease on a 22 mm x 40 mm cover glass (Figure 2A). Silicon grease is extruded from the syringe through a pipet tip with a cut end.
Apply about 25 µl of 0.2 mg/ml Concanavalin A on the cover glass within square bank.
Wait for about 2 min to coat the cover glass with Concanavalin A.
Remove the excess Concanavalin A solution from the glass surface.
Dry Concanavalin A at room temperature for about 10 min. The Concanavalin A-coated glass dish needs to be freshly prepared for well immobilizing living yeast cells.
-
Preparation of yeast cells for the fluorescent microscopic pulse-chase assay of cargo transport
Yeast temperature-sensitive mutants such as sec31-1 and uso1-1 show a defect in ER-to-Golgi cargo transport at the restrictive temperature (37 °C). By combining the gene expression of cargo by a heat-shock inducible promoter and the use of yeast temperature-sensitive mutants, the fluorescence microscopic pulse-chase assay has been established to visualize cargo transport from the ER to the Golgi and within the Golgi (Kurokawa et al., 2014 and 2019).
Pick up temperature-sensitive mutant yeast cells expressing cargo and two Golgi cisternal markers (e.g., uso1-1 cells expressing heat-shock-inducible Axl2-GFP (transmembrane cargo) and constitutive Mnn9-mCherry (cis-Golgi marker) and Sys1-iRFP (trans-Golgi marker)) from a frozen stock using a sterile toothpick, and streak yeast cells on a MCD agar plate with appropriate amino acid supplements.
Incubate yeast cells on the agar plate at 24 °C for 2-3 days.
Inoculate yeast cells into 1 ml MCD medium with appropriate amino acid supplements in a 24-well plate by using a sterile toothpick.
Grow yeast cells to the early-to-mid logarithmic phase at 24 °C with shaking at 500 rpm.
Incubate yeast cells at 37 °C for 15-30 min to induce GFP-tagged cargo (Axl2-GFP) synthesis and to inhibit the ER-to-Golgi cargo transport.
Apply about 100 µl of yeast liquid culture into a square bank of Concanavalin A-coated 22 mm x 40 mm cover glass (Figure 2B).
Wait for 2 min until yeast cells are immobilized on a Concanavalin coated cover glass.
-
Cover the square bank with 18 mm x 18 mm cover glass (Figure 2C).
Note: Yeast cells can grow well because two cover glasses are spaced with silicone grease.
Remove overflowing yeast liquid culture from sandwiched space of two cover glasses with Kimwipes.
Place the cover glasses sandwiching yeast cells on a microscope stage with the Concanavalin coated larger glass down. The temperatures of the microscopic stage and objective lens can be set at 24 °C by an automatic thermo-control system.
-
Image acquisition with SCLIM
-
Set up of SCLIM before observation
Due to various factors, such as chromatic aberrations of lenses in the whole microscopic and spectroscopic system, the 3 different fluorescence signals coming from the same position (XYZ) may be projected to different positions (XYZ) of 3 cameras. To conduct simultaneous 3-color 3D and 4D observation, it is necessary to correct the XYZ misalignments of these fluorescence signals. SCLIM has devised a method to correct the misalignments of XYZ positions in 3 cameras by using fluorescence beads (see Procedure F). Setting up SCLIM needs an expert operator who has well known the optics of SCLIM system.
-
Image acquisition
Fluorescent molecules have a broad range of emission. Thus, for example, when GFP is expressed at a very high level, the fluorescence signal of GFP may be detected even by a camera with a longer-wavelength emission filer. Such a leakage of fluorescence signals is called as bleed-through or crosstalk. It is critical to avoid such bleed-through signals as much as possible. The powers of 3 excitation lasers and the amplification gains of 3 image intensifiers should be independently controlled to minimize bleed-through. Users need to be trained in how to operate SCLIM correctly for ‘Image acquisition’ step.
Observe the yeast cells expressing cargo (heat-shock-inducible Axl2-GFP) and Golgi cisternal markers, cis-Golgi marker (Mnn9-mCherry) and trans-Golgi marker (Sys1-iRFP), by SCLIM. In these cells, we can observe that cis-Golgi cisterna labeled with Mnn9-mCherry matures to trans-Golgi cisterna labeled with Sys1-iRFP while maintaining Axl2-GFP cargo.
2D confocal fluorescence data are separated in the custom-made spectroscopic unit. GFP, mCherry, and iRFP fluorescence images finally pass through the spectral windows defined by 2 band pass filters (GFP; 490-545 nm, and mCherry; 580-660 nm) and 1 long pass filter (iRFP; 680 nm-) and are simultaneously collected by synchronized 3 EMCCD cameras.
Collect Z slice of 3-color images at appropriate time intervals during observation time (e.g., at every about 5 seconds during total 2-3 min observation). An appropriate range of Z-axis (e.g., 3 μm cover about 80% of yeast cell volume) is scanned into optical slices 100 nm apart by the piezo actuator equipped to the objective lens.
Raw data sets (Z slice 3-color images at each time points) are once stored in the TIFF format in the hard-disk memory of the image acquisition computer.
-
-
Reconstruction of 3D images from raw data sets and making of deconvolved 3D images using Volocity software
Transfer raw data sets to the computer installed with Volocity software.
-
Reconstruct 3D images from raw data sets using Volocity software.
Select ‘Create new’ from Actions menu in Volocity to make Image sequence.
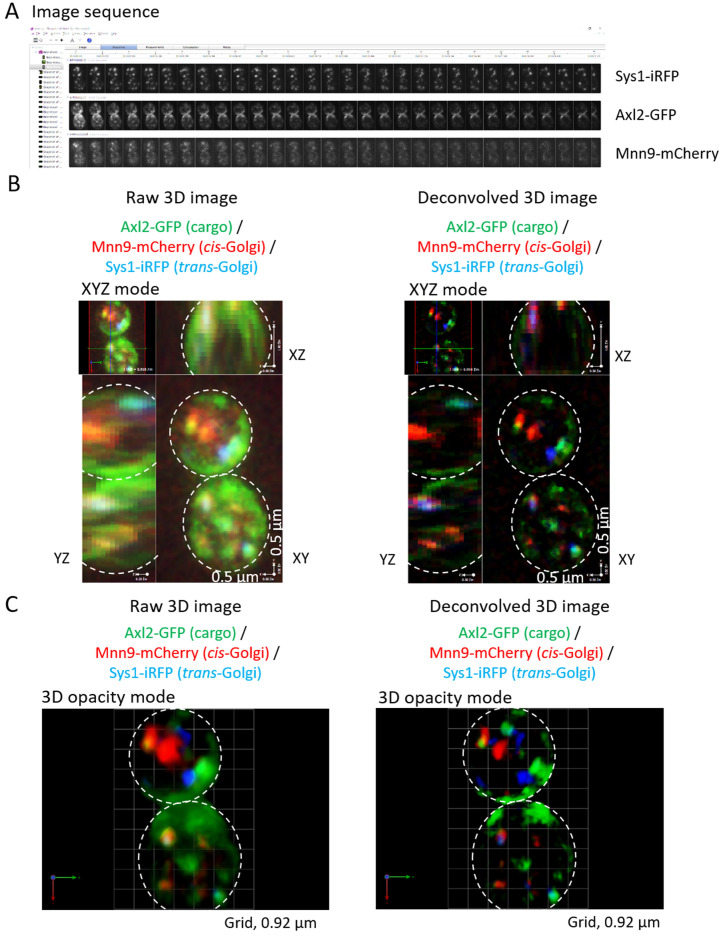
Read out raw data sets in 3 channels into Image sequence to reconstruct 3D images at each time point (Figure 3A).
Select ‘Remove Noise’ from the Tools menu and remove noise from all 3D images using a fine filter.
Select ‘Change Colors’ from the Tools menu and change colors of 3 channels (e.g., GFP as green, mCherry as red, and iRFP as blue).
Select ‘Correct Photobleaching’ from the Tools menu and correct for photobleaching of 3D images to maintain intensities that are reduced by photobleaching during the observation time.
Select ‘Properties’ from the Edit menu and change information of XYZ pixel sizes in 3D images. Pixels of (X) and (Y) are 0.06 µm and pixel of (Z) is 0.1 µm when we use 100x objective lens and 4x amplification lens and scan Z-axis with optical slices 100 nm apart.
Select ‘Fast restoration’ from the Tools menu and make deconvolved 3D images using PSF (point-spread function) parameters of 3 fluorescence proteins optimized for the spinning-disk confocal scanner. These parameters are made with ‘Calculated PSF’ in ‘Create new’ from Actions menu.
Raw 3D images and deconvolved 3D images can be shown in different modes of viewing, XYZ mode (Figure 3B), 3D opacity mode (Figure 3C), and so on.
-
Presentation and analysis of 3D and 4D images
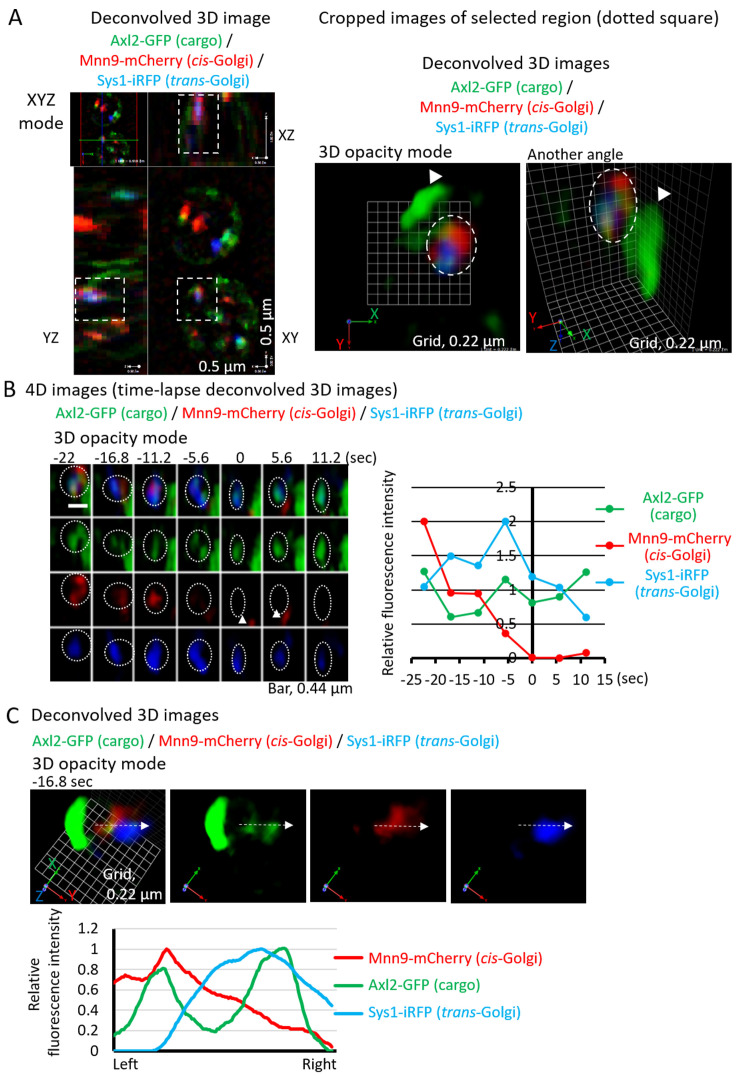
Regions of interest in deconvolved 3D images can be manually selected. Present the images as XYZ mode and outline the region of interest using the selection tool (Figure 4A, left panel). Select ‘Crop to Selection’ from the Actions menu to create a new deconvolved 3D image (Figure 4A, right 2 panels). 3D images shown in 3D opacity mode can be presented at any desired angles (Figure 4A, right 2 panels).
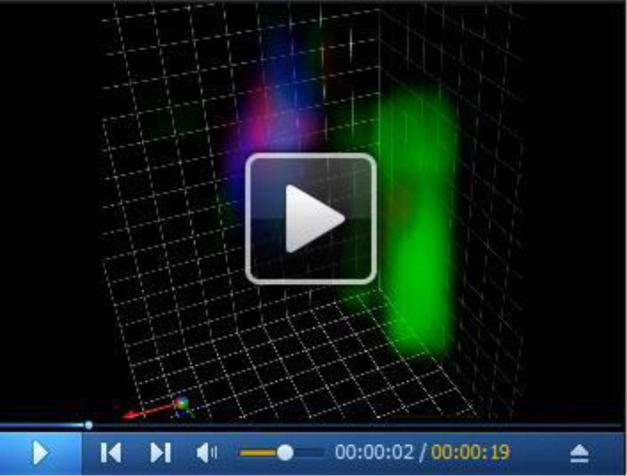
To analyze the change of fluorescence signal intensities over time, we make time-lapse movie of deconvolved 3D images using ‘Make Movie’ from the Movie menu (Video 1). Total fluorescence signal intensities of 3D images in 3 channels (green, red, and infrared) are collected to calculate relative fluorescence intensity values of e.g., Axl2-GFP (cargo, green), Mnn9-mCherry (cis-Golgi, red), and Sys1-iRFP (trans-Golgi, blue) using Metamorph (Figure 4B, Video 1). Note, by using 3D opacity mode, we can make 3D images viewed at various angles, which helps avoid collecting incorrect fluorescence signals of another Golgi cisterna (Figure 4B, arrowheads).
To analyze correct localization of cargo and Golgi resident proteins, 3D images shown in 3D opacity mode at any angles can be used for line-scan analysis using MetaMorph (Figure 4C).
-
Checking and correcting the misalignments of XYZ positions in 3 cameras
Before the observation of yeast cells expressing 3 fluorescence proteins, we always check and correct the misalignments of XYZ positions in 3 cameras by the following ways.
Check and correct the misalignment in XY positions by using pinhole images of 3 cameras
Stop the rotation of the spinning-disk of the confocal scanner.
Apply a weak light from a halogen lamp light source to objective lens.
-
Obtain the halogen light images passed through the pinhole with 3 cameras.
Note: Because the gain of amplification in 3 Image Intensifiers are controlled independently, we can acquire images of almost the same intensities in 3 cameras.
Adjust the angles of dichroic millers and reflection millers of the custom-made spectroscopic unit to correct the XY positions of 3 cameras’ images.
Check and correct the misalignment in XYZ positions in 3 cameras by using bleed-through signals of fluorescence proteins using Volocity
Prepare yeast cells expressing GFP (e.g., yeast cells expressing Sec13-GFP which show the dotted signals around the peripheral ER and nuclear membrane).
Excite GFP with the 473 nm laser at high power and obtain emission signals and bleed-through signals of GFP simultaneously with 2 cameras for green and red fluorescence by adjusting the amplification gain of 2 Image Intensifiers. Check the misalignment in XYZ positions of emission signals and bleed-through signals from GFP dots in 2 cameras dedicated for green and red fluorescence.
In the same way, obtain emission signals and bleed-through signals of red fluorescence (e.g., yeast cells expressing Sec13-mCherry) with 2 cameras dedicated for red and infrared fluorescence and then check the misalignment.
Select ‘Registration Correction’ from Create New in Actions menu to create new registration correction parameters using the misalignment in XYZ positions in 3 channels.
Select ‘Correct Registration’ from Tools menu and correct the misalignments in XYZ positions in 3 channels using the registration correction parameters.
Figure 2. Sample preparation.
A. A square bank in 1-2 mm depth of 18 mm x 18 mm or less is made with silicon grease on a 22 mm x 40 mm cover glass. The cover glass surface within square bank is coated with Concanavalin A. B. An aliquot of yeast liquid culture is applied into the square bank of Concanavalin A-coated 22 mm x 40 mm cover glass. C. The yeast liquid culture is sandwiched by the Concanavalin A-coated cove glass and a 18 x 18 mm cover glass. The yeast cells are then subjected to microscopic observation.
Figure 3. Reconstruction of raw and deconvolved 3D images.
A. Image sequence of raw data sets in 3 channels at each time point are shown. B. Reconstructed raw and deconvolved 3D images at one time point are shown in XYZ mode. C. Reconstructed raw and deconvolved 3D images at one time point are shown in 3D opacity mode. cis-Golgi (Mnn9-mcherry, red) and trans-Golgi (Sys1-iRFP, blue) existed dispersed in the cytoplasm. Some cargos (Axl2-GFP, green) were transported to their final destination, the plasma membrane. Other cargos localized within Golgi cisternae. Dotted circles in the images highlight the edges of yeast cells.
Figure 4. Presentation and analysis of 3D and 4D images.
A. Select the region of interest in XYZ mode image (left panel) to make a new cropped 3D image. Cropped 3D images are shown in 3D opacity mode at two different angles (right 2 panels). Cargos (Axl2-GFP, green) localized at the plasma membrane (arrowheads) and within the Golgi cisterna (dotted circles) labeled with both of cis- (Mnn9-mcherry, red) and trans-Golgi (Sys1-iRFP, blue) markers. B. 4D images (time-lapse 3D deconvolved images) are shown (left panels) (see also Video 1). The frame where Mnn9-mCherry signals disappeared was set as 0 s. Relative fluorescence intensities of Axl2-GFP (cargo, green), Mnn9-mCherry (cis, red), and Sys1-iRFP (trans, blue) at each time point are shown on the right. Maturation of Golgi cisterna with cargo was observed (dotted circles). The cisterna was labeled with cis-Golgi marker (Mnn9-mcherry, red) and trans-Golgi marker (Sys1-iRFP, blue) at the beginning (-25 s). It lost Mnn9-mcherry signals and gained Sys1-iRFP signals, and then it was labeled only with Sys1-iRFP at -5.6 s, indicating it matured to trans-Golgi. Finally, this cisterna matured to the TGN because Sys1-iRFP signals were disappeared at 11.2 s. Note, the angle showing 3D images is important to obtain the correct fluorescence intensities in one cisterna. Top view analysis alone of fluorescence intensities over time may have obtained incorrect values of red fluorescence, because arrowheads in left panels indicate another cis cisterna, which was present just below the analyzed cisterna. C. 3D deconvolved images were subjected to line scan analysis (upper panels). 3D deconvolved images (merged image, Axl2-GFP, Mnn9-mCherry, and Sys1-iRFP) at -16.8 s are shown (upper panels). Lower graph shows relative fluorescence intensities of Axl2-GFP (cargo, green), Mnn9-mCherry (cis, red), and Sys1-iRFP (trans, blue) along the white arrows in the maturing cisterna. Mnn9-mCherry and Sys1-iRFP showed segregated localization within the cisterna. Cargo located both regions.
Video 1. Maturation of the Golgi cisterna with cargo viewed from two different angles.
Recipes
-
MCD agar plate
0.67% yeast nitrogen base without amino acids
0.5% casamino acids
2% glucose
2% agar
Mix Yeast Nitrogen Base 3.4 g, Vitamin assay casamino acid 2.5 g, and Agar 10 g in 450 ml of distilled water
Autoclave at 120 °C for 20 min
Add 50 ml of 20% Glucose and 5 ml of appropriate amino acid supplements
Pour the medium into a cell culture dish (approximately 20 ml/dish)
Solidify the plates for 2-3 days before use and store at 4 °C
-
MCD media
0.67% yeast nitrogen base without amino acids
0.5% casamino acids
2% glucose
Mix Yeast Nitrogen Base 3.4 g and Vitamin assay casamino acid 2.5 g in 450 ml of distilled water
Add 50 ml of 20% Glucose and 5 ml of appropriate amino acid supplements
Store at room temperature
Acknowledgments
This work has been supported by JSPS grants to the authors (JP25221103, JP17H06420, and JP18H05275 to K.K and A.N). The protocol has been adapted from Kurokawa et al. (2019).
Competing interests
The authors declare no competing interests.
Citation
Readers should cite both the Bio-protocol article and the original research article where this protocol was used.
References
- 1.Bonfanti L., Mironov A. A. Jr. Martinez-Menarguez J. A., Martella O., Fusella A., Baldassarre M., Buccione R., Geuze H. J., Mironov A. A. and Luini A.(1998). Procollagen traverses the Golgi stack without leaving the lumen of cisternae: evidence for cisternal maturation. Cell 95(7): 993-1003. [DOI] [PubMed] [Google Scholar]
- 2.Emr S., Glick B. S., Linstedt A. D., Lippincott-Schwartz J., Luini A., Malhotra V., Marsh B. J., Nakano A., Pfeffer S. R., Rabouille C., Rothman J. E., Warren G. and Wieland F. T.(2009). Journeys through the Golgi--taking stock in a new era. J Cell Biol 187(4): 449-453. [DOI] [PMC free article] [PubMed] [Google Scholar]
- 3.Fujii S., Kurokawa K., Inaba R., Hiramatsu N., Tago T., Nakamura Y., Nakano A., Satoh T. and Satoh A. K.(2020). Recycling endosomes attach to the trans-side of Golgi stacks in Drosophila and mammalian cells. J Cell Sci 133(4). [DOI] [PubMed] [Google Scholar]
- 4.Glick B. S. and Luini A.(2011). Models for Golgi traffic: a critical assessment. Cold Spring Harb Perspect Biol 3(11): a005215. [DOI] [PMC free article] [PubMed] [Google Scholar]
- 5.Glick B. S. and Nakano A.(2009). Membrane traffic within the Golgi apparatus. Annu Rev Cell Dev Biol 25: 113-132. [DOI] [PMC free article] [PubMed] [Google Scholar]
- 6.Griffiths G. and Simons K.(1986). The trans Golgi network: sorting at the exit site of the Golgi complex. Science 234(4775): 438-443. [DOI] [PubMed] [Google Scholar]
- 7.Ishii A., Kurokawa K., Hotta M., Yoshizaki S., Kurita M., Nakano A., and Kimura Y.(2019). Role of Atg8 in the regulation of vacuolar membrane invagination. Sci Rep 9(1): 14828. [DOI] [PMC free article] [PubMed] [Google Scholar]
- 8.Ishii M., Suda Y., Kurokawa K. and Nakano A.(2016). COPI is essential for Golgi cisternal maturation and dynamics. J Cell Sci 129(17): 3251-3261. [DOI] [PMC free article] [PubMed] [Google Scholar]
- 9.Ito Y., Uemura T., Shoda K., Fujimoto M., Ueda T. and Nakano A.(2012). cis-Golgi proteins accumulate near the ER exit sites and act as the scaffold for Golgi regeneration after brefeldin A treatment in tobacco BY-2 cells. Mol Biol Cell 23(16): 3203-3214. [DOI] [PMC free article] [PubMed] [Google Scholar]
- 10.Ito Y., Uemura T., and Nakano A.(2018). The Golgi entry core compartment functions as a COPII-independent scaffold for ER-to-Golgi transport in plant cells. J Cell Sci 131(2) [DOI] [PubMed] [Google Scholar]
- 11.Iwai M., Yokono M., Kurokawa K., Ichihara A. and Nakano A.(2016). Live-cell visualization of excitation energy dynamics in chloroplast thylakoid structures. Sci Rep 6: 29940. [DOI] [PMC free article] [PubMed] [Google Scholar]
- 12.Kurokawa K., Ishii M., Suda Y., Ichihara A. and Nakano A.(2013). Live cell visualization of Golgi membrane dynamics by super-resolution confocal live imaging microscopy. Methods Cell Biol 118: 235-242. [DOI] [PubMed] [Google Scholar]
- 13.Kurokawa K., Okamoto M. and Nakano A.(2014). Contact of cis-Golgi with ER exit sites executes cargo capture and delivery from the ER. Nat Commun 5: 3653. [DOI] [PMC free article] [PubMed] [Google Scholar]
- 14.Kurokawa K., Osakada H., Kojidani T., Waga M., Suda Y., Asakawa H., Haraguchi T. and Nakano A.(2019). Visualization of secretory cargo transport within the Golgi apparatus. J Cell Biol 218(5): 1602-1618. [DOI] [PMC free article] [PubMed] [Google Scholar]
- 15.Kurokawa K., Suda Y. and Nakano A.(2016). Sar1 localizes at the rims of COPII-coated membranes in vivo. J Cell Sci 129(17): 3231-3237. [DOI] [PMC free article] [PubMed] [Google Scholar]
- 16.Lanoix J., Ouwendijk J., Stark A., Szafer E., Cassel D., Dejgaard K., Weiss M. and Nilsson T.(2001). Sorting of Golgi resident proteins into different subpopulations of COPI vesicles: a role for ArfGAP1. J Cell Biol 155(7): 1199-1212. [DOI] [PMC free article] [PubMed] [Google Scholar]
- 17.Losev E., Reinke C. A., Jellen J., Strongin D. E., Bevis B. J. and Glick B. S.(2006). Golgi maturation visualized in living yeast. Nature 441(7096): 1002-1006. [DOI] [PubMed] [Google Scholar]
- 18.Maeda M., Kurokawa K., Katada T., Nakano A. and Saito K.(2019). COPII proteins exhibit distinct subdomains within each ER exit site for executing their functions. Sci Rep 9(1): 7346. [DOI] [PMC free article] [PubMed] [Google Scholar]
- 19.Martinez-Menarguez J. A., Prekeris R., Oorschot V. M., Scheller R., Slot J. W., Geuze H. J. and Klumperman J.(2001). Peri-Golgi vesicles contain retrograde but not anterograde proteins consistent with the cisternal progression model of intra-Golgi transport. J Cell Biol 155(7): 1213-1224. [DOI] [PMC free article] [PubMed] [Google Scholar]
- 20.Matsuura-Tokita K., Takeuchi M., Ichihara A., Mikuriya K. and Nakano A.(2006). Live imaging of yeast Golgi cisternal maturation. Nature 441(7096): 1007-1010. [DOI] [PubMed] [Google Scholar]
- 21.Mironov A. A., Beznoussenko G. V., Nicoziani P., Martella O., Trucco A., Kweon H. S., Di Giandomenico D., Polishchuk R. S., Fusella A., Lupetti P., Berger E. G., Geerts W. J., Koster A. J., Burger K. N. and Luini A.(2001). Small cargo proteins and large aggregates can traverse the Golgi by a common mechanism without leaving the lumen of cisternae. J Cell Biol 155(7): 1225-1238. [DOI] [PMC free article] [PubMed] [Google Scholar]
- 22.Nakano A. and Luini A.(2010). Passage through the Golgi. Curr Opin Cell Biol 22(4): 471-478. [DOI] [PubMed] [Google Scholar]
- 23.Okamoto M., Kurokawa K., Matsuura-Tokita K., Saito C., Hirata R. and Nakano A.(2012). High-curvature domains of the ER are important for the organization of ER exit sites in Saccharomyces cerevisiae. J Cell Sci 14): 3412-3420. [DOI] [PubMed] [Google Scholar]
- 24.Pfeffer S. R.(2010). How the Golgi works: a cisternal progenitor model. Proc Natl Acad Sci U S A 107(46): 19614-19618. [DOI] [PMC free article] [PubMed] [Google Scholar]
- 25.Rivera-Molina F. E. and Novick P. J.(2009). A Rab GAP cascade defines the boundary between two Rab GTPases on the secretory pathway. Proc Natl Acad Sci U S A 106(34): 14408-14413. [DOI] [PMC free article] [PubMed] [Google Scholar]
- 26.Schermelleh L., Heintzmann R. and Leonhardt H.(2010). A guide to super-resolution fluorescence microscopy. J Cell Biol 190(2): 165-175. [DOI] [PMC free article] [PubMed] [Google Scholar]
- 27.Suda Y., Kurokawa K., Hirata R. and Nakano A.(2013). Rab GAP cascade regulates dynamics of Ypt6 in the Golgi traffic. Proc Natl Acad Sci U S A 110(47): 18976-18981. [DOI] [PMC free article] [PubMed] [Google Scholar]
- 28.Tojima T., Suda Y., Ishii M., Kurokawa K. and Nakano A.(2019). Spatiotemporal dissection of the trans-Golgi network in budding yeast. J Cell Sci 132(15). [DOI] [PMC free article] [PubMed] [Google Scholar]
- 29.Uemura T., Suda Y., Ueda T. and Nakano A.(2014). Dynamic behavior of the trans-golgi network in root tissues of Arabidopsis revealed by super-resolution live imaging. Plant Cell Physiol 55(4): 694-703. [DOI] [PubMed] [Google Scholar]


