eLife logoLink to eLife
. 2021 Jan 12;10:e56426. doi: 10.7554/eLife.56426

Random access parallel microscopy

Mishal Ashraf 1,, Sharika Mohanan 2,, Byu Ri Sim 1,, Anthony Tam 1,, Kiamehr Rahemipour 1, Denis Brousseau 3, Simon Thibault 3, Alexander D Corbett 2,, Gil Bub 1,
Editors: Jonathan Ewbank4, Didier YR Stainier5
PMCID: PMC7843131  PMID: 33432922

Abstract

We introduce a random-access parallel (RAP) imaging modality that uses a novel design inspired by a Newtonian telescope to image multiple spatially separated samples without moving parts or robotics. This scheme enables near-simultaneous image capture of multiple petri dishes and random-access imaging with sub-millisecond switching times at the full resolution of the camera. This enables the RAP system to capture long-duration records from different samples in parallel, which is not possible using conventional automated microscopes. The system is demonstrated by continuously imaging multiple cardiac monolayer and Caenorhabditis elegans preparations.

Research organism: C. elegans, Chicken

Introduction

Conventional multi-sample imaging modalities either require movement of the sample to the focal plane of the imaging system (Klimas et al., 2016; Yemini et al., 2013; Kopljar et al., 2017; Hortigon-Vinagre et al., 2018), movement of the imaging system itself (Likitlersuang et al., 2012; Hansen et al., 2010), or use a wide-field approach to capture several samples in one frame (Larsch et al., 2013; Taute et al., 2015). Schemes that move the sample or the imaging system can be mechanically complex and are inherently slow, while wide-field imaging systems have poor light collection efficiency and resolution compared to systems that image a single sample at a given time point. An important limitation of current imaging modalities is that they cannot continuously monitor several samples unless they are in the same field of view. As many experiments require continuous long-term records in spatially separated samples, they cannot benefit from these high-throughput techniques.

The random-access parallel (RAP) system uses a large parabolic reflector and objective lenses positioned at their focal distances above each sample. A fast light-emitting diode (LED) array sequentially illuminates samples to generate images that are captured with a single camera placed at the focal point of the reflector. This optical configuration allows each sample to fill a sensor’s field of view. Since each LED illuminates a single sample and LED switch times are very fast, images from spatially separated samples can be captured at rates limited only by the camera’s frame rate or the system’s ability to store data. RAP enables effectively simultaneous continuous recordings of different samples by switching LEDs at very fast rates. We demonstrate the system in two low-magnification, low-resolution settings using single-element lenses and other easily sourced components.

Results

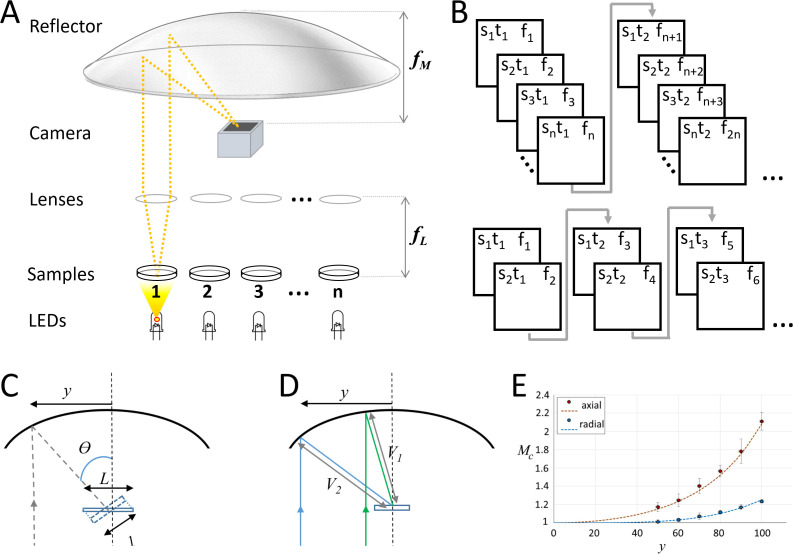
Our current prototypes (Figure 1A) use fast machine vision complementary metal-oxide semiconductor cameras and commercially available LED arrays controlled by Arduino microcontrollers, which can rapidly switch between LEDs at kHz rates. A single-element plano-convex lens is placed above each sample, so that collimated light is projected to a 100 mm focal length parabolic reflector, which then creates an image on the detector. The bright-field nature of the illumination used in this design allows images to be captured with sub-millisecond exposure times. The camera is synchronized with the LED array via a transistor–transistor logic (TTL) signal from the microcontroller, so that a single frame is captured when any LED is on. This setup can rapidly switch to image any dish under the parabolic reflector without moving the sample or camera. In addition, the system can acquire data from several dishes near-simultaneously by trading-off the number of samples for frame rate: for example, if a 500 fps camera is used, 50 dishes can be captured at 10 fps, or any two dishes can be recorded at 250 fps (Figure 1B).

Figure 1. Random-access parallel (RAP) imaging principle and magnification properties.

(A) The random-access imaging system uses a parabolic reflector to image samples directly on a fast machine vision camera located at the focal point of the mirror (f M). Single-element plano-convex lenses are used as objectives, with samples positioned at their focal point (f L). Samples are sequentially illuminated using a LED array controlled by an Arduino microcontroller: a sample is only projected on the sensor when its corresponding LED is ‘on’. See Figure 1—figure supplement 1 and Table 1 for details. (B) (top) Sample s, is captured at time t, on frame f. For a total of n samples, each sample is captured once every n frames; (bottom) a smaller subset of samples can be imaged at higher temporal resolution by reducing the number of LEDs activated by the microcontroller. (C) Image magnification: the chief ray (dashed line) arrives at the detector plane at an incidence angle θ which increases with lateral displacement, y. The image is stretched in the direction parallel to y by a factor of L/l. (D) The image is isotopically magnified as the distance between the mirror and the image increases (V2>V1) as y increases. (E) The combined magnification, MC, shows the impact of the combined transformation on the magnification in both image dimensions (y' parallel to y, and x' orthogonal to y). Red dots (measured) and dashes (predicted) show magnification in y', and blue dots (measured) and dashes (predicted) show magnification in x', inset shows Images of a grid (200 μm pitch) taken with y = 70 mm, left is the uncorrected image and right shows the correct image using Equation 1.

Figure 1.

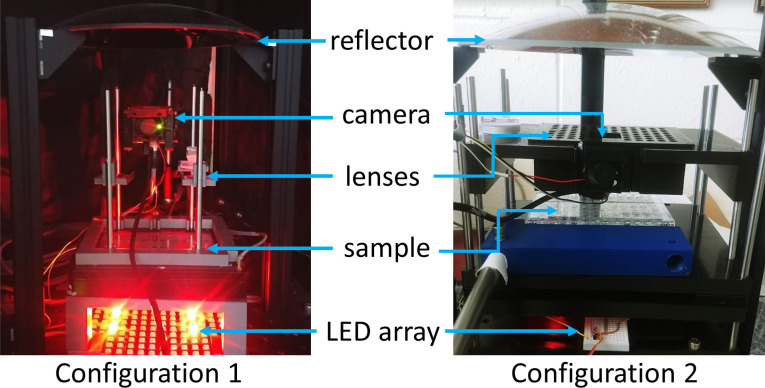
Figure 1—figure supplement 1. Configurations used for data collection.

Figure 1—figure supplement 1.

Two configurations, constructed from a combination of Thorlabs optical components (Thorlabs ER series 6 mm rods) and 3D printed parts, were used to collect the data. Both configurations use the same parabolic reflector held at three points by optical rails (Thorlabs XE25) attached to a breadboard. Configuration 1 allows for adjustable focus for each sample by sliding a 3D printed lens holder along 6 mm diameter rods; Configuration 2 has an array of lenses at a fixed vertical position and focus is achieved by moving the samples (here a single 96-well plate).

Figure 1—figure supplement 2. Comparison of conventional and RAP images.

Figure 1—figure supplement 2.

USAF targets (clear pattern on a chrome background) imaged using 25 mm, 100 mm focal length plano-convex lens positioned 100 mm above the sample as an objective and the 100 mm focal length parabolic mirror to refocus the image (A, with a zoomed and flipped version of the same image shown in B) or a second 25 mm diameter, 100 mm focal length lens to refocus the image on the sensor (C, shown at same scale as B). The axial distance of the objective to the centre of the parabolic reflector is 40 mm (images A and B). The large square in the centre right in both close-up images is 140 × 140 μm. The sensor used is a 640 × 480 pixel camera with 4.8 × 4.8 μm pixels.

The high NA and large field of view offered by parabolic mirrors have made them very attractive to imaging applications beyond the field of astronomy. However, parabolic mirrors introduce off-axis aberrations, which corrupt any widefield image formed (Rumsey, 1971; Wynne, 1972). This has resulted in compromises, such as restricting imaging to the focal region and then stage scanning the sample (Lieb and Meixner, 2001), which have limited its use to niche applications. In our design, transillumination from LEDs far from the sample and collimation from the objective lens results in mostly collimated light being refocused by the parabolic mirror, avoiding the introduction of significant aberrations. The illumination of the sample by a partially spatially coherent source (Deng and Chu, 2017) produces greyscale images, and in our studies, it is the change in this intensity that is of interest.

Propagation-based phase contrast in our imaging system is generated when collimated light from the LED is diffracted by the sample. Light that remains in the collection cone of the objective lens is then refocused on the sensor by the parabolic reflector at an oblique angle (Figure 1C). As a result of this angle, the image moves through focus from one side of the detector plane to the other. The region over which the image is in focus is determined by the depth of focus of the parabolic mirror. The distance along the chief ray (Df) between the image at either side of the detector is given by Df=Dssinθ, where Ds is the width of the sensor and θ is the angle of the chief ray. For our system, Ds is 2.4 mm, and θ is always less than 60 degrees, so Df is always less than 2 mm and the entire image therefore remains inside the Rayleigh length of the parabolic focus.

Images are subject to two transformations: (1) a stretch due to the image meeting the camera plane obliquely and (2) a small variation in magnification as a function of the separation between the optical axes of the objective lens and the parabolic reflector. These image transformations can be compensated by post-processing the captured images using equations derived from geometric optics as described below.

Light from the sample arrives at the detector plane at an incidence angle θ, which increases with lateral displacement between objective and mirror axes, y (Figure 1C). As the image itself is formed normal to the chief ray, the detector plane captures a geometric projection of the image which is stretched in the direction of y. The magnitude of the stretch is given by

S=1cos[2 tan1(y2fM)] (1)

where S is the magnitude of the stretch in one axis, y is the lateral displacement, and fM is the focal length of the parabolic mirror. In addition, there is also a small variation in magnification, which is the same in both image dimensions (y' parallel to displacement y, and x' orthogonal to y) due to the distance between the parabolic mirror surface and the focal point (V) increasing as a function of y (Figure 1D). The magnification is then given by the ratio of V to the focal length of the objective lens, fL. As V(y) can be calculated precisely for a parabola, the magnification M can be written as function of y, fL, and mirror focal length, fM:

M=1fL{y2+(fMy24fM)2}12 (2)

The combined magnification (MM × S) from global scaling and geometric projection along the x' and y' dimensions is shown together with measured results in Figure 1E.

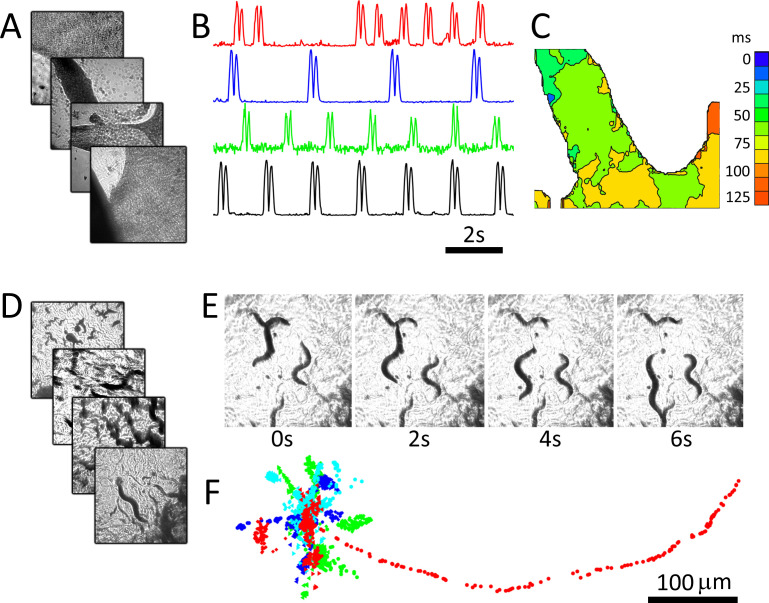
We demonstrate the system using two popular biological models that may benefit from capturing images in parallel. Cultured cardiac monolayer preparations (Tung and Zhang, 2006; Shaheen et al., 2017) are used to study arrhythmogenesis in controlled settings and are subject to intense research due to their potential for screening compounds for personalized medicine. Caenorhabditis elegans are used as model organisms to study the genetics of aging and biological clocks (Hekimi and Guarente, 2003) and, due to highly conserved neurological pathways between mammals and invertebrates, are now used for neuroprotective compound screening (Larsch et al., 2013). Both model systems are ideally imaged continuously over long periods to capture dynamics (Larsch et al., 2013; Kucera et al., 2000), which is not possible in automated microscopy platforms that move samples or the optical path. The preparations were imaged using four 25 mm diameter, 100 mm focal length lenses (see Materials and methods: Configuration 1). Figure 2A shows recordings from four dishes imaged in parallel containing monolayer cultures of neonatal cardiac cells at 40 fps per dish. Here, motion is tracked by measuring the absolute value of intensity changes for each pixel over a six-frame window (Burton et al., 2015). Intensity vs time plots (Figure 2B) highlight different temporal dynamics in each preparation, and an activation map from one of the dishes shows conduction velocity and wave direction data (Figure 2C). C. elegans can similarly be imaged, here at 15 fps for four dishes over a period of 5 min (Figure 2D–F). C. elegans motion paths (Figure 2D), which are often used to quantify worm behaviour, can be extracted from each image series using open-source software packages.

Figure 2. RAP imaging of cardiac monolayer and C. elegans preparations.

Figure 2.

(A) Four cardiac monolayer preparations in four separate petri dishes are imaged in parallel at 40 fps/dish. (B) Activity vs time plots obtained from the four dishes show different temporal dynamics, where double peaks in each trace correspond to contraction and relaxation within a 20 × 20 pixel ROI (see Materials and methods); (C) an activation map from the second dish (blue trace in B) can be used to determine wave velocity and speed; (D) four C. elegans dishes imaged in parallel at 15 fps/dish; (E) images from one dish every 30 frames (2 s intervals) shows C. elegans motion; (F) the location of five worms in each dish was tracked from data recorded at 15 fps over 250 frames using open-source wrMTrck (Nussbaum-Krammer et al., 2015) software. Dots in different colours (blue, cyan, green, and red) show the tracked positions from plates 1–4, respectively. Each image in (A), (D), and (E) shows a 2 × 2 mm field of view.

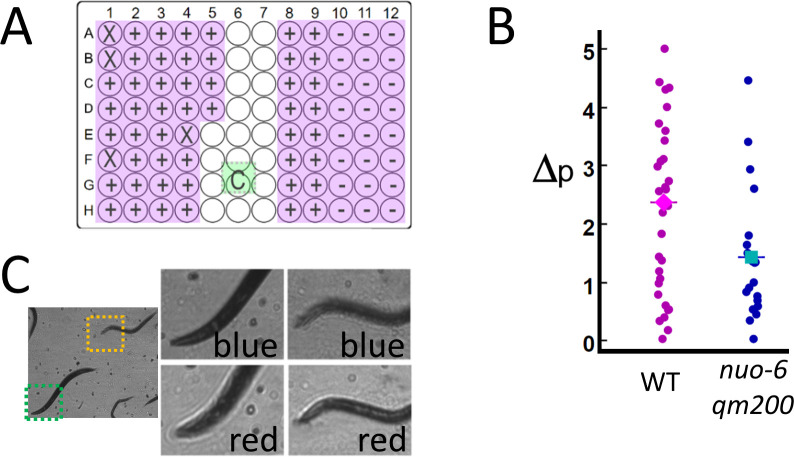
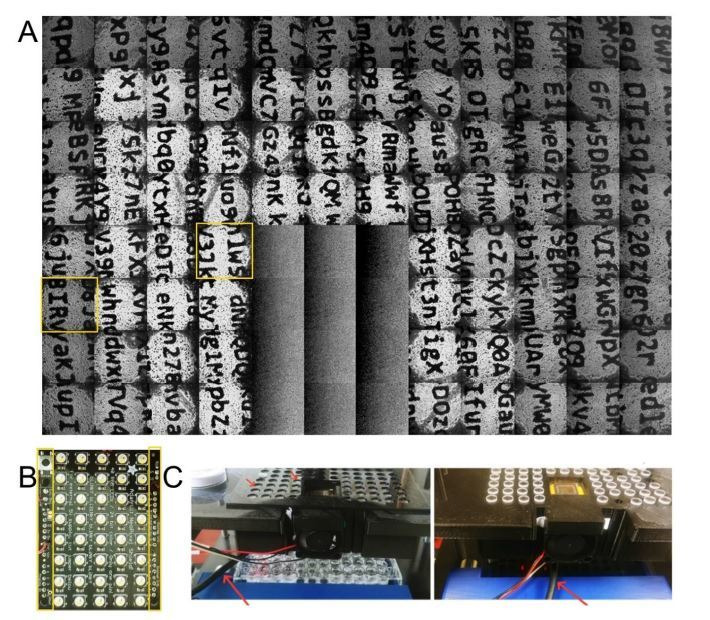
We validate the potential for RAP to be used in a higher-throughput imaging application by measuring motion in C. elegans mitochondrial mutant nuo-6(qm200) (Yang and Hekimi, 2010), which have a slower swimming rate (frequency of thrashing) than that of the wild-type C. elegans. Mutant and wild-type C. elegans were loaded into a 96-well plate containing liquid media and imaged by using an array of 76 6 mm diameter, 72 mm focal length lenses positioned above each well (see Materials and methods: Configuration 2). Instead of measuring thrashing frequency directly, motion was quantified by measuring the fraction of pixels per frame that display a change in intensity of over 25% for 100 sequential frames captured at 15 fps/well (see Materials and methods: Image processing). In this experiment, the frame rate of the camera is limited to 120 fps (see Materials and methods: Practical considerations and Video 1), allowing us to image eight wells in parallel at 15 fps/well. Eighty wells (76 active and four blank wells – see Figure 3A) are imaged by measuring 100 frames from each well in a row of eight wells in parallel (800 frames/row) before moving to the next row, until all 80 wells are imaged (a total of 8000 frames). The system quantified decreased activity in nuo-6(qm200), which is consistent with published results (Yang and Hekimi, 2010; Figure 3B). The time needed to perform this assay is just over 1 min (8000 frames/120 fps = 67 s).

Figure 3. High-throughput estimates of C. elegans motion in liquid media.

Images are captured at 120 fps, which is split over multiple wells as shown in Video 1. (A) The position of the active detection sites (magenta) relative to the camera (green), which obscures a portion of the 96-well plate: Wells obscured by hardware are denoted by an ‘X’ symbol (see Materials and methods: Table 1), wells with wild-type C. elegans (WT, ‘+’ symbol) and mutant (nuo-6(qm200), ‘−’ symbol). (B) Motion analysis comparing wild type (magenta dots) to mitochondrial mutant nuo-6(qm200) (blue dots): wells in each row are imaged in parallel (eight wells at 15 fps per well), and net motion is estimated in each well by summing absolute differences in pixel intensities in sequential frames (see Materials and methods: Image analysis). This estimate confirms that the imaging system can detect significant differences between the two strains (averages shown by diamond and square symbols, two-tailed t-test p=0.01), which is consistent with published results (Yang and Hekimi, 2010). (C) Focal plane wavelength dependence: details from two fields of view (dashed green and orange squares) in the same image appear in or out of focus depending on whether imaged using a red or blue LED (see Video 2 and Figure 3—figure supplement 1).

Figure 3.

Figure 3—figure supplement 1. Focal plane wavelength dependence.

Figure 3—figure supplement 1.

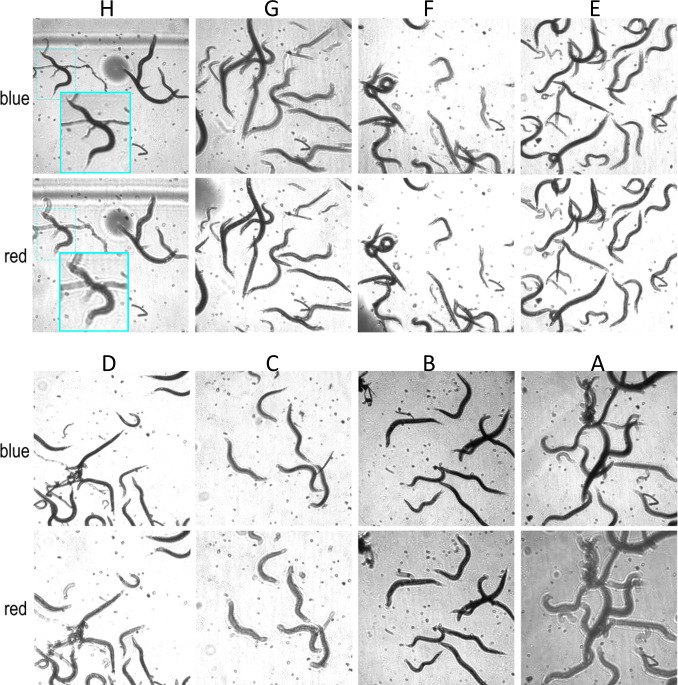
Images from all wells(A–H) for row 10, illuminated using a blue and red LEDs for Configuration 2 imaging C. elegans in liquid media. Images are in better focus when illuminated with the red LED for wells (G), (F), and (E) and the blue LED for wells (H), (D), (C), (B), and (A). Images for each channel are taken 8.3 ms apart, and the 16 images from eight wells are sampled at 7.5 fps. Each image is 512 × 512 pixels and is not transformed other than brightness adjustment in wells (B) and (A) for clarity. The inset in (H) shows a close up to highlight the focal plane difference between the two channels.

Video 1. RAP recordings from a 96-well plate, showing recordings at different temporal resolutions.

Download video file (6.1MB, mp4)

A limitation of our current implementations of RAP is that focusing individual wells is impractical when there are more than few (i.e. four as in Figure 2) active samples. For System 2 (76 wells), the objective lenses had a depth of focus of 1 mm, which is sufficient tolerance to accommodate most of the wells imaged. Small variations in lens focal length, variability in printed parts, and variations in tissue culture plates result in well-to-well variations in image quality as samples may not be perfectly in focus. While we were able to resolve C. elegans and measure activity in all wells, images are noticeably blurred in about half of the wells, and in some cases, some objects in a single well are better focused than others. This situation can be mitigated by changing the LED colour, as the single-element lenses used in our system show variations in focal length as a function of wavelength (Figure 3C and Video 2). Optical simulations using ray tracing software Configuration 2 confirm that the focal plane can be shifted by 0.981 μm by switching LED colour from red to blue (see Materials and methods). Rapid colour switching (i.e. alternating image capture between red and blue LEDs) may be used to increase data set quality at the expense of decreasing the framerate per well (as was done in Figure 3—figure supplement 1) or the number of wells that can be imaged in parallel, as twice the number of images per well are required.

Video 2. RAP recordings using different colours (red and blue LEDs) focus at different planes in the sample.

Download video file (4.6MB, mp4)

Discussion

The push to develop new high-throughput screening modalities (Abraham et al., 2004; Oheim, 2007) has resulted in several innovative approaches, ranging from the use of flatbed scanners for slowly varying preparations (Stroustrup et al., 2013), to wide-field methods that incorporate computational image reconstruction (Taute et al., 2015; Zheng et al., 2013), to ‘on-chip’ imaging systems that plate samples directly on a sensor (Zheng et al., 2011; Göröcs and Ozcan, 2013; Cui et al., 2008; Greenbaum et al., 2012; Greenbaum et al., 2013). Despite these advances, methods that accommodate a biologists’ typical workflow – for example comparing multiple experimental samples plated in different petri dishes – depend on automation of conventional microscopes.

Automated microscopes excel at applications where data can be acquired from samples sequentially as a single high-numerical-aperture (NA) objective is used. While a RAP system could be built using high-NA, high-magnification optics, this likely would require that each objective lens is independently actuatable in order to achieve focus which poses practical limits on the number of imaged wells. RAP systems can be used to speed up conventional imaging tasks in low-magnification settings by capturing data from different samples in parallel (as was done in Figure 3). However, here the speed increase afforded by RAP must be weighed against the many benefits of using a mature technology such as the automated widefield microscope (see Table 2 for a comparison between these systems). RAP systems are better suited for dynamic experiments where multiple continuous long-duration recordings are the primary requirement. For example, rhythms in cultured cardiac tissue evolve over hours (Kim et al., 2009) or even days (Woo et al., 2008; Burridge et al., 2016), but display fast transitions between states (e.g. initiation or termination of re-entry Bub et al., 1998), necessitating continuous measurement. In these experiments, moving between samples would result in missed data. RAP overcomes these constraints by reducing transit times between samples to less than a millisecond without the use of automation or relying on a widefield imaging approach, while allowing for an optimized field of view.

Table 2. Comparison between conventional and RAP imaging systems.

Conventional microscope RAP microscope
Resolution NA = 0.025 (1×) to 0.95 (40×) NA = 0.04 and 0.124 (1.4× and 1×)
Image quality Optimal
(multi-element objectives correct for most aberrations)
Moderate
(single-element lenses used as objectives display spherical and other aberrations)
Modalities Bright-field, phase contrast, DIC, fluorescence Bright-field, multi-sample
Scan time* ~8 min (no autofocus)
~11 min (with autofocus)
1 min (no focus)
2 min (LED colour switching)
Focal drift Moderate to low (due to the use of a heavy machined platform, with further improvements afforded to autofocus systems) Moderate to high (focal plane drift is expected due to light, 3D printed parts, but its impact can be mitigated by LED colour switching)
Cost High (~$30,000 with automated x,y,z stages) Low ($1750–$3250)
Automation§ Good (many automated microscopes are fully programmable) Unknown (fully programmable, but not validated as part of a conventional high-throughput workflow)

*Scan time is estimated for measuring the 72 unobstructed wells in a 96-well plate to allow direct comparison to the data in Figure 3. The estimate is based on moving serially between wells with a transit time of 0.5 s and imaging 100 frames at 15 fps. Examples from the literature vary considerably (e.g. up to one hour using 3D printed automation technologies, due to limitations in hardware communication speeds: see Schneidereit et al., 2017).

We assume the autofocus algorithm takes on average 2.5 s (see Geusebroek et al., 2000).

The cost for the RAP system depends on the number of objective lenses used: Configuration 1 costs approximately $1750, while Configuration 2 (with 76 wells) costs approximately $3,250, as the cost for the cameras in both configurations are similar (~$400). Costs are in USD.

§‘Automation’ refers to a system’s ability to be integrated into robotic workflows. Conventional automated microscopes are core components of high-throughput screening platforms with sample and drug delivery capabilities. While our system is in principle compatible with these technologies (e.g. by leveraging existing open-source software, see Booth et al., 2018), it has not been tested in these settings.

Materials and methods

Sample preparation and imaging

Wild-type C. elegans were maintained in standard 35 mm petri dishes in 5–8 mm of agar seeded with E. coli for the data in Figure 2. For Figure 3, the mitochondrial mutant nuo-6(qm200) (Yang and Hekimi, 2010) was used along with wild-type C. elegans. Here, C. elegans were transferred to 96-well plates by washing adults off NGM plates in M9 buffer, washed once to remove E. coli, and resuspended in fresh M9 buffer. Fifty microlitres of this worm suspension was loaded into a 96-well, flat-bottom assay plate (Corning, Costar), excluding half of row five and all wells in rows 6 and 7 as shown in Figure 3A, as these wells were either obscured by sensor hardware or not illuminated by the two 40-element LED arrays (see Configuration 2 in Table 1 below). Wells are filled with M9 buffer and covered with a glass coverslip to reduce refraction artefacts at the meniscus interface at well borders. For additional details, see Hekimi and Guarente, 2003. All experiments involving C. elegans were imaged at room temperature. Cardiac monolayer cultures were prepared from ventricular cells isolated from 7 day old chick embryos: cells were plated within 1 cm glass rings in 35 mm petri dishes as described in Bub et al., 1998. Cardiac monolayers were imaged in a stage top incubator (Okolabs) at 36°C and at 5% CO2 in maintenance media.

Table 1. Configuration details.

See Figure 1—figure supplement 1 for additional details.

Configuration 1 Configuration 2
Camera Basler acA640-750um, 750 maximum fps, with 640 × 480, 4.8 × 4.8 μm pixels Basler acA1300-200um, 202 maximum fps, with 1280 × 1024, 4.8 × 4.8 μm pixels
Lenses Edmund Optics 25 mm diameter, 100 mm focal length (NA = 0.124) Edmund Optics 6 mm diameter, 72 mm focal length (NA = 0.04)
LED array Adafruit DotStar 8 × 32 LED matrix 2× Adafruit NeoPixel 40 LED Shields
Sample location Four samples equidistant (~40 mm) from the optical axis. Up to 76 wells in a 96-well plate (Figure 3A).
Frame rate Images captured at 160 fps for four sample (Figure 2A–C and 40.0 fps/sample) or 60 fps for four samples (Figure 2D–F and 15 fps/sample). Images captured at 120 fps for eight samples (Figure 3 and 15 fps/sample). Different sampling rates are shown in Video 1.
Usage notes Vibrations in cardiac experiments were damped by using Sorbothane isolators (Thorlabs AV5), and room light was blocked using black aluminium foil (Thorlabs BFK12). We use a 640 × 512 pixel ROI for the camera in Configuration 2 as the illumination spot is smaller than the camera FOV. Camera placement obscures 12 wells in the 96-well plate imaged in Configuration 2 (see Figure 3A), and the use of two commercial 40 element LED arrays precludes imaging all wells in a 96-well plate as the LEDs are permanently mounted on a board that is too large to be tiled without leaving gaps. In addition, some wells (marked in Figure 3A) were inadvertently obscured by hardware between the sample and objective lenses for the motion quantification experiment in Figure 3; however, the number of imaged wells was considered to be sufficient to demonstrate the utility of the RAP system.

Optical setup

A parabolic reflector (220 mm diameter, 100 mm focal length, Edmund Optics) was mounted 300 mm above a breadboard. The camera sensor and electronics (acA640-750um for data collection in Figure 2, acA1300-200um for data collection in Figure 3, Basler AG) were mounted in a PLA (polylactic acid) housing without a c-mount thread to allow image formation from light at oblique angles and positioned at the focal point of the parabola. Biological samples were positioned 50 mm above a LED array (DotStar 8 × 32 LED matrix for Figure 2 or two NeoPixel 40 LED Shields for Figure 3, Adafruit Industries). Plano-convex lenses (25 mm diameter, 100 mm focal length for Figure 2, 6 mm diameter, 72 mm focal length for Figure 3, Edmund Optics) were positioned at their focal lengths above each sample. Axial alignment tolerances were set by the depth of field (DOF) of the lenses, calculated to be 0.9 mm using the approximation: DOF=(2u2Nc)/f2 where the subject distance, u=f, the f-number, N=12, and the circle of confusion c, was set to be twice the lateral resolution (18 μm). The LED array was controlled by an ATmega328P microcontroller (Arduino Uno, Arduino.cc) using the FastLED 3.2 open-source library and custom code (Source code 1 and 2, in conjunction with free Basler Pylon Viewer software) to synchronize the camera with each LED via a TTL trigger pulse. Custom parts were printed with a Prusa I3 MK2S printer; STL files with an image of the setup showing their use is provided in ‘stl_files.zip’. Table 1 summarizes features of the two systems.

Image processing

We find that image brightness drops with increased objective lateral distance and that images are subject to aberrations at the edges. To offset these effects, captured images shown in Figures 2 and 3 are cropped (480 × 480 pixels for Configuration 1, and 640 × 512 for Configuration 2) and rescaled (so that maximum and minimum pixel intensity values fall between 0 and 255). Dye-free visualization of cardiac activity (Figure 2B) is carried out by applying a running background subtraction followed by an absolute value operation on each pixel:

Pti,j=|Pti,j-Pt-ni,j|

where Pti,j is the value of pixel p at location i,j at time t and Pt-ni,j is the value of the same pixel at an earlier frame (typically six frames apart: see Burton et al., 2015) for details on this technique). Intensity vs time plots of averaged pixels in a 20 × 20 pixel region of interest show double spikes corresponding to contraction followed by relaxation (Figure 2B). Activation maps (Figure 2C) are generated as previously described (Burton et al., 2015). Motion (Figure 3B) is quantified by finding the magnitude of the intensity change between co-localized pixels in sequential images, counting the number of pixels where the magnitude of the change is over 65 intensity units (25% of the intensity range of the image), and dividing the total by the number of analysed frames. We note that while this algorithm yields results that are consistent with published manual measurements of thrashing frequency (see figure 2j in Yang and Hekimi, 2010), there is no direct correspondence between this metric and specific behaviours (head movement, posture changes, etc.). However, the documented difference in the activity of the two strains we use would predict the difference in the metric that we observe and can be used as a validation of the imaging method to track movement over time.

Practical considerations

The camera used in Figure 2 was chosen for its high frame rate as we were interested in imaging cardiac activity, which in our experience requires 40 fps acquisition speeds. The small field of view imposed by the sensor (640 × 480 pixels at 4.8 microns per pixel giving a 3 × 2.3 mm FOV for the 1× imaging scheme used in Figure 2) was considered reasonable as the field imaged by the 25 mm lens was larger than the sensor, ensuring that the sensor will always capture useful data. In contrast, the system used in Figure 3 used smaller 6 mm lenses, and a relatively small 4 mm diameter spot was projected on the sensor. Small changes in lens angle and position (which proved to be hard to control using our consumer grade desktop 3D printer) result in up to a millimetre well-to-well variation for position of the image on the sensor. We therefore opted to use a higher resolution camera with a larger sensor to ensure that the image would reliably fall on the sensor. While this choice lowers the number of frames that can be continuously saved to disk, we considered this to be an acceptable trade-off as the frame rate needed to image C. elegans motion is relatively modest. Future designs will use precision (e.g.CNC (computer numerical control) machined) lens holders that would reduce these variations by an order of magnitude.

The imaging scheme captures data at a maximum rate that depends on the camera as well as the system’s ability to save data continuously to disk. Our system’s hard drive is capable of continuously saving to disk at 150 MB/second. The camera used in Configuration 2 has a resolution of 1280 × 1024 pixels, which generates 1.25-MB images: the 150 MB/second limit therefore imposes a sustained base frame rate of 120 fps (150 MB/second/1.25MB = 120 fps). C. elegans motion can be adequately quantified when imaging at 15 fps, allowing us to image eight wells (120 fps/15 fps) in parallel. A faster hard drive (e.g. an SSD) or RAID array would significantly increase throughput.

We note that RAP has been validated in low-magnification, bright-field settings that have relaxed constraints relative to microscopy applications that may require high magnification with optimized resolution and high light throughput (e.g. fluorescence microscopy). Rather, our designs aim to maximize the number of independent samples that can be imaged in parallel. We therefore opt to use inexpensive components and minimize the device’s footprint, allowing us to either increase the number of samples captured by a single system or alternatively – as large parabolic reflectors may not be practical in a lab setting – duplicate the system to increase total capacity.

The use of low-magnification optics in our current implementation is not a defining property of RAP, as higher NA, high-magnification optics could be used. In the same way that the objective lens is not limited by the tube lens in a conventional microscope, the choice of the objective lenses in the RAP microscope is not limited by the parabolic mirror. The NA (and resolving power) of the implementations described above to demonstrate RAP microscopy are consistent with other low-magnification systems. Conventional bright-field 1× microscope objective lenses have NAs close to that of Configuration 2 (e.g. the Zeiss 1× Plan Neofluar commercial objective has an NA of 0.025, and the Thorlabs TL1X-SAP 1× objective has an NA of 0.03), and research stereo macroscopes have NAs close to that of Configuration 1 (e.g. the NA is 0.11 for an Olympus SZX10 at 1×), but can be higher in specialized macroscope systems. As is the case with conventional microscope designs, a high-magnification RAP system would likely require a mechanism for finely adjusting objective heights to keep each sample in focus, as the depth of field of the objective lenses would be reduced. While the resolution of a RAP system is similar to conventional microscopes, RAP systems differ from conventional microscopes in several respects. Table 2 summarizes some key differences between a conventional automated widefield imaging microscope and the two RAP systems implemented in this publication. We note that higher performance RAP systems (e.g. faster disks, a faster camera, corrected optics) would display improved performance.

Optical model validation

To validate the optical model of the imaging system (Equations 1 and 2), an opaque grid with a 200 μm pitch (#58607, Edmund Optics) was used as a test sample. Images of grid sample were captured using an objective lens with its optic axis separated from that of the mirror by distances shown in Figure 1E. Rescaling the images by the factor given in Equation 1 recovers the image of the square grid.

Optical resolution comparison

To compare the performance of RAP (Configuration 1) to a conventional on-axis imaging system, the parabolic mirror was replaced by a plano-convex lens with the same 100 mm focal length and aligned co-axially with the objective lens and sample. A qualitative comparison of images of a US Air Force chart showed that image resolution degradation in the RAP system, caused by off-axis aberrations in the parabolic mirror, is relatively modest for small (<40 mm) axial distances (Figure 1—figure supplement 2).

In addition, images of an optically opaque grid were captured on the Configuration 2 system for a variety of off-axis distances. The intensity contrast (the ratio of the darkest region in the gridline to the intensity in the adjacent transmissive region) was used to infer the lateral extent of the optical point spread function (PSF) by comparison to a computational model. The model calculated the anticipated contrast as a function of PSF width (PSF FWHM, see below) using a simple convolution. As the original width of the gridline was known (20 μm, equivalent to 25 line pairs/mm), this relationship could then be used to estimate the lateral PSF width for a given intensity contrast (Table 3). The theoretical lateral resolution of a 6 mm diameter, 72 mm focal length lens was calculated to be: PSFXY=0.6*λ/NA=9.1μm when using the centre emission wavelength of 622.5 nm from the Adafruit Neopixel red LEDs. Estimated lateral PSF widths varied from 13.4 to 21.6 microns over the full range of axial distances used in the 96-well experiment, with performance falling as a function of axial distance.

Table 3. Comparison of image quality (intensity contrast and estimated lateral width of the point spread function) for varying distances from the optic axis.

Off-axis distance (mm) Contrast at 25 lp/mm Estimated FWHM (μm)
 22.16 4.50 14.9
 29.96 6.52 13.4
 38.48 6.06 13.7
 45.04 3.62 16.0
 53.90 3.27 16.6
 60.46 2.101 20.3
 66.84 1.88 21.6

Optical simulations

The chromatic focal shift observed in the experiments was confirmed using optical simulations (Zemax OpticStudio 18.1). The shift in the back focal plane, solved for marginal rays at a particular wavelength, was calculated. For the plano-convex lens used in Configuration 2 (Edmund Optics #45–696), this focal shift was found to be 981 μm when switching from a red (622 nm) to blue (469 nm) LED.

Acknowledgements

We thank RS Branicky and S Hekimi for the C. elegans preparation, A Caldwell for sample preparation, and C Sprigings for programming assistance.

Funding Statement

The funders had no role in study design, data collection and interpretation, or the decision to submit the work for publication.

Contributor Information

Alexander D Corbett, Email: A.Corbett@exeter.ac.uk.

Gil Bub, Email: gil.bub@mcgill.ca.

Jonathan Ewbank, Aix Marseille Université, INSERM, CNRS, France.

Didier YR Stainier, Max Planck Institute for Heart and Lung Research, Germany.

Funding Information

This paper was supported by the following grants:

  • National Science and Engineering Research Council of Canada RGPIN-2018-05346 to Gil Bub.

  • National Science and Engineering Research Council of Canada RGPIN-2016-05962 to Simon Thibault.

  • Heart and Stroke Foundation of Canada HSFC G-18-0022123 to Gil Bub.

Additional information

Competing interests

No competing interests declared.

Author contributions

Investigation, Writing - original draft.

Software, Formal analysis, Investigation.

Investigation.

Software, Investigation.

Investigation.

Investigation, Writing - review and editing.

Investigation, Writing - review and editing.

Supervision, Investigation, Methodology, Writing - review and editing.

Conceptualization, Resources, Software, Supervision, Investigation, Methodology, Writing - original draft, Writing - review and editing.

Additional files

Source code 1. Arduino code for controlling the camera and LED array for Configuration 1.
elife-56426-code1.zip (1.3KB, zip)
Source code 2. Python code for sorting images for each sample into unique directories.
elife-56426-code2.zip (1.2KB, zip)
Supplementary file 1. STL files and instructions for assembling RAP Configurations 1 and 2.
elife-56426-supp1.zip (612KB, zip)
Transparent reporting form

Data availability

All data generated during this study are included in the manuscript and supporting files.

References

  1. Abraham VC, Taylor DL, Haskins JR. High content screening applied to large-scale cell biology. Trends in Biotechnology. 2004;22:15–22. doi: 10.1016/j.tibtech.2003.10.012. [DOI] [PubMed] [Google Scholar]
  2. Booth BW, McParland C, Beattie K, Fisher WW, Hammonds AS, Celniker SE, Frise E. OpenHiCAMM: high-content screening software for complex microscope imaging workflows. iScience. 2018;2:136–140. doi: 10.1016/j.isci.2018.03.017. [DOI] [PMC free article] [PubMed] [Google Scholar]
  3. Bub G, Glass L, Publicover NG, Shrier A. Bursting calcium rotors in cultured cardiac myocyte monolayers. PNAS. 1998;95:10283–10287. doi: 10.1073/pnas.95.17.10283. [DOI] [PMC free article] [PubMed] [Google Scholar]
  4. Burridge PW, Li YF, Matsa E, Wu H, Ong SG, Sharma A, Holmström A, Chang AC, Coronado MJ, Ebert AD, Knowles JW, Telli ML, Witteles RM, Blau HM, Bernstein D, Altman RB, Wu JC. Human induced pluripotent stem cell-derived cardiomyocytes recapitulate the predilection of breast Cancer patients to doxorubicin-induced cardiotoxicity. Nature Medicine. 2016;22:547–556. doi: 10.1038/nm.4087. [DOI] [PMC free article] [PubMed] [Google Scholar]
  5. Burton RA, Klimas A, Ambrosi CM, Tomek J, Corbett A, Entcheva E, Bub G. Optical control of excitation waves in cardiac tissue. Nature Photonics. 2015;9:813–816. doi: 10.1038/nphoton.2015.196. [DOI] [PMC free article] [PubMed] [Google Scholar]
  6. Cui X, Lee LM, Heng X, Zhong W, Sternberg PW, Psaltis D, Yang C. Lensless high-resolution on-chip optofluidic microscopes for Caenorhabditis elegans and cell imaging. PNAS. 2008;105:10670–10675. doi: 10.1073/pnas.0804612105. [DOI] [PMC free article] [PubMed] [Google Scholar]
  7. Deng Y, Chu D. Coherence properties of different light sources and their effect on the image sharpness and speckle of holographic displays. Scientific Reports. 2017;7:5893. doi: 10.1038/s41598-017-06215-x. [DOI] [PMC free article] [PubMed] [Google Scholar]
  8. Geusebroek JM, Cornelissen F, Smeulders AW, Geerts H. Robust autofocusing in microscopy. Cytometry. 2000;39:1–9. doi: 10.1002/(SICI)1097-0320(20000101)39:1&#x0003c;1::AID-CYTO2&#x0003e;3.0.CO;2-J. [DOI] [PubMed] [Google Scholar]
  9. Göröcs Z, Ozcan A. On-chip biomedical imaging. IEEE Reviews in Biomedical Engineering. 2013;6:29–46. doi: 10.1109/RBME.2012.2215847. [DOI] [PMC free article] [PubMed] [Google Scholar]
  10. Greenbaum A, Luo W, Su TW, Göröcs Z, Xue L, Isikman SO, Coskun AF, Mudanyali O, Ozcan A. Imaging without lenses: achievements and remaining challenges of wide-field on-chip microscopy. Nature Methods. 2012;9:889–895. doi: 10.1038/nmeth.2114. [DOI] [PMC free article] [PubMed] [Google Scholar]
  11. Greenbaum A, Luo W, Khademhosseinieh B, Su T-W, Coskun AF, Ozcan A. Increased space-bandwidth product in pixel super-resolved lensfree on-chip microscopy. Scientific Reports. 2013;3:1717. doi: 10.1038/srep01717. [DOI] [Google Scholar]
  12. Hansen A, Eder A, Bönstrup M, Flato M, Mewe M, Schaaf S, Aksehirlioglu B, Schwoerer AP, Schwörer A, Uebeler J, Eschenhagen T. Development of a drug screening platform based on engineered heart tissue. Circulation Research. 2010;107:35–44. doi: 10.1161/CIRCRESAHA.109.211458. [DOI] [PubMed] [Google Scholar]
  13. Hekimi S, Guarente L. Genetics and the specificity of the aging process. Science. 2003;299:1351–1354. doi: 10.1126/science.1082358. [DOI] [PubMed] [Google Scholar]
  14. Hortigon-Vinagre M, Zamora V, Burton F, Butler P, Smith G. Measurements of voltage, intracellular Ca2+ and contraction from spontaneous iPSC-derived cardiomyocytes using CellOPTIQ platform reveals complex effects from drugs that parallel in vivo cardiac effects. Journal of Pharmacological and Toxicological Methods. 2018;1:119–120. doi: 10.1016/j.vascn.2018.01.407. [DOI] [Google Scholar]
  15. Kim MY, Aguilar M, Hodge A, Vigmond E, Shrier A, Glass L. Stochastic and spatial influences on drug-induced bifurcations in cardiac tissue culture. Physical Review Letters. 2009;103:058101. doi: 10.1103/PhysRevLett.103.058101. [DOI] [PubMed] [Google Scholar]
  16. Klimas A, Ambrosi CM, Yu J, Williams JC, Bien H, Entcheva E. OptoDyCE as an automated system for high-throughput all-optical dynamic cardiac electrophysiology. Nature Communications. 2016;7:11542. doi: 10.1038/ncomms11542. [DOI] [PMC free article] [PubMed] [Google Scholar]
  17. Kopljar I, De Bondt A, Vinken P, Teisman A, Damiano B, Goeminne N, den Wyngaert IV, Gallacher D, Lu HR. Combining video microscopy motion analysis and detection of cardiac injury biomarkers to evaluate chronic cardiotoxicity in hiPS cardiomyocytes. Journal of Pharmacological and Toxicological Methods. 2017;88:239–240. doi: 10.1016/j.vascn.2017.09.233. [DOI] [Google Scholar]
  18. Kucera JP, Heuschkel MO, Renaud P, Rohr S. Power-law behavior of beat-rate variability in monolayer cultures of neonatal rat ventricular myocytes. Circulation Research. 2000;86:1140–1145. doi: 10.1161/01.RES.86.11.1140. [DOI] [PubMed] [Google Scholar]
  19. Larsch J, Ventimiglia D, Bargmann CI, Albrecht DR. High-throughput imaging of neuronal activity in Caenorhabditis elegans. PNAS. 2013;110:E4266–E4273. doi: 10.1073/pnas.1318325110. [DOI] [PMC free article] [PubMed] [Google Scholar]
  20. Lieb M, Meixner A. A high numerical aperture parabolic mirror as imaging device for confocal microscopy. Optics Express. 2001;8:458. doi: 10.1364/oe.8.000458. [DOI] [PubMed] [Google Scholar]
  21. Likitlersuang J, Stephens G, Palanski K, Ryu WS. Elegan stracking and behavioral measurement. Journal of Visualized Experiments : JoVE. 2012;17:e4094. doi: 10.3791/4094. [DOI] [PMC free article] [PubMed] [Google Scholar]
  22. Nussbaum-Krammer CI, Neto MF, Brielmann RM, Pedersen JS, Morimoto RI. Investigating the spreading and toxicity of Prion-like proteins using the metazoan model organism C. elegans. Journal of Visualized Experiments. 2015;8:e52321. doi: 10.3791/52321. [DOI] [PMC free article] [PubMed] [Google Scholar]
  23. Oheim M. High-throughput microscopy must re-invent the microscope rather than speed up its functions. British Journal of Pharmacology. 2007;152:1–4. doi: 10.1038/sj.bjp.0707348. [DOI] [PMC free article] [PubMed] [Google Scholar]
  24. Rumsey NJ. Pairs of spherical mirrors as field correctors for paraboloid mirrors. Publications of the Astronomical Society of Australia. 1971;2:22–23. doi: 10.1017/S1323358000012595. [DOI] [Google Scholar]
  25. Schneidereit D, Kraus L, Meier JC, Friedrich O, Gilbert DF. Step-by-step guide to building an inexpensive 3D printed motorized positioning stage for automated high-content screening microscopy. Biosensors and Bioelectronics. 2017;92:472–481. doi: 10.1016/j.bios.2016.10.078. [DOI] [PubMed] [Google Scholar]
  26. Shaheen N, Shiti A, Gepstein L. Pluripotent stem Cell-Based platforms in cardiac disease modeling and drug testing. Clinical Pharmacology & Therapeutics. 2017;102:203–208. doi: 10.1002/cpt.722. [DOI] [PubMed] [Google Scholar]
  27. Stroustrup N, Ulmschneider BE, Nash ZM, López-Moyado IF, Apfeld J, Fontana W. The Caenorhabditis elegans lifespan machine. Nature Methods. 2013;10:665–670. doi: 10.1038/nmeth.2475. [DOI] [PMC free article] [PubMed] [Google Scholar]
  28. Taute KM, Gude S, Tans SJ, Shimizu TS. High-throughput 3D tracking of Bacteria on a standard phase contrast microscope. Nature Communications. 2015;6:1–9. doi: 10.1038/ncomms9776. [DOI] [PMC free article] [PubMed] [Google Scholar]
  29. Tung L, Zhang Y. Optical imaging of arrhythmias in tissue culture. Journal of Electrocardiology. 2006;39:S2–S6. doi: 10.1016/j.jelectrocard.2006.04.010. [DOI] [PubMed] [Google Scholar]
  30. Woo S-J, Hong JH, Kim TY, Wook Bae B, Lee KJ. Spiral wave drift and complex-oscillatory spiral waves caused by heterogeneities in two-dimensional in vitro cardiac tissues. New Journal of Physics. 2008;10:015005. doi: 10.1088/1367-2630/10/1/015005. [DOI] [Google Scholar]
  31. Wynne CG. IV field correctors for astronomical telescopes. Prog. Opt. 1972;10:137–164. doi: 10.1016/S0079-6638(08)70059-3. [DOI] [Google Scholar]
  32. Yang W, Hekimi S. Two modes of mitochondrial dysfunction lead independently to lifespan extension in Caenorhabditis elegans. Aging Cell. 2010;9:433–447. doi: 10.1111/j.1474-9726.2010.00571.x. [DOI] [PubMed] [Google Scholar]
  33. Yemini E, Jucikas T, Grundy LJ, Brown AE, Schafer WR. A database of Caenorhabditis elegans behavioral phenotypes. Nature Methods. 2013;10:877–879. doi: 10.1038/nmeth.2560. [DOI] [PMC free article] [PubMed] [Google Scholar]
  34. Zheng G, Lee SA, Antebi Y, Elowitz MB, Yang C. The ePetri dish, an on-chip cell imaging platform based on subpixel perspective sweeping microscopy (SPSM) PNAS. 2011;108:16889–16894. doi: 10.1073/pnas.1110681108. [DOI] [PMC free article] [PubMed] [Google Scholar]
  35. Zheng G, Horstmeyer R, Yang C. Wide-field, high-resolution fourier ptychographic microscopy. Nature Photonics. 2013;7:739–745. doi: 10.1038/nphoton.2013.187. [DOI] [PMC free article] [PubMed] [Google Scholar]

Decision letter

Editor: Jonathan Ewbank1
Reviewed by: Didier Marguet2

In the interests of transparency, eLife publishes the most substantive revision requests and the accompanying author responses.

Acceptance summary:

The clarifications that you have made now allow readers to judge for themselves the utility of this novel imaging modality. While the current system falls short of providing truly continuous high-speed (i.e. > 10 fps) imaging of 80-96 wells, it clearly has great potential for multiple applications.

Decision letter after peer review:

Thank you for submitting your article "Solid state high throughput screening microscopy" for consideration by eLife. Your article has been reviewed by three peer reviewers, and the evaluation has been overseen by a Reviewing Editor and Didier Stainier as the Senior Editor. The following individual involved in review of your submission has agreed to reveal their identity: Didier Marguet (Reviewer #1).

The reviewers have discussed the reviews with one another and the Reviewing Editor has drafted this decision to help you prepare a revised submission.

As the editors have judged that your manuscript is of interest, but as described below that additional experiments are required before it is published, we would like to draw your attention to changes in our revision policy that we have made in response to COVID-19 (https://elifesciences.org/articles/57162). First, because many researchers have temporarily lost access to the labs, we will give authors as much time as they need to submit revised manuscripts. We are also offering, if you choose, to post the manuscript to bioRxiv (if it is not already there) along with this decision letter and a formal designation that the manuscript is “in revision at eLifeeLife”. Please let us know if you would like to pursue this option.

The reviewers all recognised the originality of your solution to perform high throughput imaging without moving parts. They do have some serious reservations, primarily regarding the evaluation of the quality and utility of the technique and in addition to the other points raised, consider it essential that you address the following:

– The standard topics for any new microscope paper: "objective" numerical aperture, image resolution, optical aberration, and camera sensor size, together with the specific aspects related to this technique, including dependence on homogeneous illumination, and sensitivity to maintenance of F2 distance.

– A substantial expansion of the scope of the data presented, to provide readers with sufficient evidence with which to evaluate the quality of the technique, including proof of principal with a 96-well plate assay.

– A direct quantitative comparison with existing HTS imaging solutions.

Reviewer #1:

Ashraf and colleagues describe an approach to perform high throughput screening imaging without moving parts. The setup is original and offers to experimentalists the flexibility to record quasi-simultaneously stacks of images of multiple samples at the full field of resolution of the camera. The optical aberration inherent to the use of a parabolic mirror are mostly overcome by collimating light from the objective lens. The images require a post-processing in two steps for taking into account the image stretching on the detector and the variation in magnification due to the variation of the distance between the mirror and the image. Two applications illustrate the potential of the solid-state HTS.

To my opinion, the following points need to be clarified:

– How homogeneous is the field of illumination with a single LED? Especially for a large field of illumination, a non-homogeneous illumination would compromise the quantifications.

– The accuracy of this ssHTS is related to the robustness at keeping the distance F2 constant between samples. In other words, how sensitive is the image acquisition to the potential variation in the F2 distance between samples as well as within a single large field of view?

– The magnification Mc must be explained.

– Is the post-processing compensation applied only in the y-direction?

Assuming that such publication aims to disseminate the use of an ssHTS setup to a wide scientific community, I find the description of the setup as well as the applied image post-processing rather succinct, even with the 3D printing and source codes information.

Reviewer #2:

Astronomers have spent centuries learning how to image the night sky with limited sensor hardware. Ashraf et al. present an ingenious adaptation of a technology developed for telescopes-parabolic reflectors-for imaging biological samples. In principle, the approach seems like it could be incredibly useful across a wide range of applications where multiple samples must be imaged in tandem. By placing multiple samples under a single parabolic reflector, multiplexing of samples and imaging hardware can be accomplished without sample-handling robots or moving cameras. The authors highlight two applications: cardiac cells in culture and free-moving nematodes.

The authors explain the theory behind their technique in a clear and convincing way. However, the biggest challenge in most imaging projects is making the theory work in practice. In its current form, the manuscript falls far short of demonstrating the practical usefulness of parabolic mirrors for imaging biological samples. The authors include only a small amount of image data-for the nematode work, this consists of eight images collected from two plate regions. Data of this scope cannot provide readers or reviewers with sufficient evidence with which to evaluate the quality of the technique.

1) The images shown-are they typical or are they the best possible images that can be collected from the device? The authors do not provide any quantitative evaluation of the quality of their images, in absolute terms or relative to existing methods, with which to understand the practical performance of parabolic mirrors. The authors should estimate the spatial resolution and dynamic range that can be obtained in practice with the devices, and evaluate how such image quality metrics vary across the entire field of view. Does performance degrade towards the edge of the mirror? Does performance degrade over time, as devices become de-calibrated with use?

2) The manuscript is additionally weakened by the absence of a non-trivial measurement made with the device. Pilot experiments are included, demonstrating that images can be collected. However, no evidence is provided to show that these images can be used to compare samples and draw biological conclusions from them. A more convincing proof-of-principle would involve the measurement of some non-trivial biological difference between samples measured with the device, either confirming previous work or discovering something new.

3) The authors highlight the comparative simplicity of their method: it eliminates the need for motorized samples or cameras. However, this simplicity must come at some: for example a substantially increased use of space or perhaps an increase in delicate calibration required, or equipment price. If a 0.25 meter mirror is required to measure four C. elegans plates, how large a mirror would be required to measure 16 plates-the number that can typically be measured using a flatbed scanner? The authors could also expand greatly on other practical issues: for example, is a dedicated imaging table required to align mirrors and samples? Readers would benefit from a clearer evaluation of the practical trade-offs in deploying parabolic mirrors in a laboratory setting relative to other imaging approaches.

Reviewer #3:

The authors present a cool new idea: using a large parabolic reflector in combination with a macroscopic lens array and rapidly modulated LED array to enable fast image multiplexing between spatially separated samples. I believe that there may be interesting applications that would benefit from this capability, although the authors have not clearly demonstrated one. The paper is short, and light on discussion, details, and data.

1) The manuscript does not discuss several standard, key topics for any new microscope paper: "objective" numerical aperture, image resolution, optical aberration (other than distortion, which is discussed), and camera sensor size.

2) Why was an array of low-performance singlet lenses used? With that selection, the image quality cannot be good. Can the system not be paired with an array of objectives or higher performance multielement lenses?

3) Fluorescence imaging is not discussed or demonstrated but would obviously increase the impact of the microscope. At least some discussion would be helpful.

4) Actual HTS applications are almost always implemented in microtiter plates (e.g. a 96-well plate) to reduce reagent costs and enable automated pipetting, etc. I do not believe anyone would implement HTS in thousands of petri dishes. The paper would be strengthened substantially by a demonstration of simultaneous recording from all (or a large subset) of the wells in a 96-well plate. It's not clear whether this is possible due to the blind spot in the center of the parabolic mirror's field of view that is blocked by the camera.

5) One of the primary motivations for this approach is given in the first paragraph as: "wide-field imaging systems [which capture multiple samples in one frame] have poor light collection efficiency and resolution compared to systems that image a single sample at a given time point." With a f = 100 mm singlet lens, the light collection efficiency of the demonstrated microscope is also low (estimated NA = 0.12) and the resolution is unimpressive with the high-aberration lens and 1x magnification. They demonstrated only trans-illumination applications (e.g. phase contrast), where light collection efficiency is not important. I believe a fancy photography lens mounted directly on a many-megapixel camera set to image all or part of a microtiter plate could likely outperform their system in throughput and simplicity, at least for the demonstrated applications of cardiomyocytes and C. elegans.

[Editors' note: further revisions were suggested prior to acceptance, as described below.]

Thank you for resubmitting your work entitled "Solid state high throughput screening microscopy" for further consideration by eLife. Your revised article has been evaluated by Didier Stainier (Senior Editor) and a Reviewing Editor following review and discussion by the three original reviewers.

Overall, the reviewers recognised that this setup could be useful for readers looking for an inexpensive bright-field imaging setup for multi-well imaging without fluorescence. They agree that you have provided substantial additional data and analysis that support your claim that parabolic reflectors can be useful for studying many samples in a parallel. The new images and videos of a 96-well plate were judged compelling. In particular, the prospect of focusing samples simply by adjusting the wavelength of illumination was thought an important step towards the goal of designing a "solid-state" imaging apparatus with no moving parts.

Nevertheless, although the reviewers were satisfied that you had addressed most or all of the material points, they had considerable reservations about the way in which these improvements were presented and could not support publication of the manuscript in its present form. Indeed, there are numerous lacunae and parts where the writing is not at all clear and leads to confusion about how the system functions and what its limits are. Please find below a summary of their most important comments and a series of points made by individual reviewers, all of which would need to be addressed in a revised manuscript. If this would require a further round of experimental work, then I am afraid that we will not be able to consider your work for publication.

The description of the 96-well plate data was considered both terse and vague, leaving unclear several aspects of experimental design and interpretation.

– If no samples were loaded into columns 6 and 7 of the 96 well plate because of the use of 40 LED arrays, this should be stated explicitly.

– What was the exact reason for not imaging in column 4 of row E or row 1F.

These discrepancies between the theoretically predicted function of the device and its practical performance must be clarified.

If these issues do not reflect technical limitation of the device, you would need to demonstrate that these columns/wells can be imaged just like the others (i.e. this is a criterion for rejection).

The details about acquisition are so poorly described that one reviewer wrote, "why not leverage those capabilities to scan 33 wells in parallel at 15 Hz rather than one well at a time at 15 Hz?". This illustrates how you have failed to convey clearly that the system captures data from multiple wells in parallel at 120-500 fps. One video does show how 120 fps can be divided up across 80 wells, and it is illustrated in Figure 1, but these details need to be explicitly stated in the text. In Figure 2, a faster (500 fps) camera of lower resolution is used. As well as making all acquisition details clearer, you will need to provide an explicit discussion of camera choice, and any trade-off between image resolution and speed. Additionally, you need to address another technical limitation and trade-off, namely rates of acquisition and data transfer so that the possibility (and cost) of implementation in a HTS setting (see below) is clear.

The center of the optical system is intrinsically blind since space is required to position the detector. This point is implicit and must be documented as a function of the magnification.

The microscope resolution in the 15 – 20 µm range is poor relative to the sub-micron resolution of a traditional microscope. It is probably not good enough, for example, to tell individual mammalian cells apart in a confluent monolayer. This will limit the range of potential applications. Thus the spatial resolution needs to be stated in the Abstract or Introduction, not buried deep in the Materials and methods. Further, you will need to include a detailed comparison with a standard commercial widefield microscope with a scanning stage (resolution, imaging modalities, scan time, defocusing over time, cost, integration into robotic workflows). If you wish to claim HTS capacity, the comparison should also include a dedicated commercial HCS/HTS system, and the many other features needed for HTS (e.g. see https://www.ncbi.nlm.nih.gov/books/NBK558077/).

Alternatively, in the absence of easy incorporation of the system in an automated setting, at a time when HTS can mean >50,000 tests/day, "High Throughput" should be removed from the title ("multi-sample" or "multi-well" would be better), and any suggestion in the text that your system is HTS-compatible seriously toned down. Equally, given the very different uses in optics or electronics of the term "solid-state", you should avoid it in the title, replacing it, for example by, "with no moving parts".

There was also a general consensus that your design is not a Newtonian telescope, which has two mirrors instead of a single mirror as in this design. The reviewers recommend changing "novel Newtonian telescope design" to "large on-axis parabolic mirror design", "parabolic reflector", or something similar that is clearer and more accurate. Including a phrase like "inspired by a Newtonian telescope" would be acceptable.

Further points made by individual reviewers:

1) The authors compare wild-type C. elegans to nuo-6 mutants. The authors are vague and qualitative in their descriptions of movement. Nuo-6 mutants are predicted to "move less frequently" than wildtype. This is confusing, as C. elegans generally exhibit some degree of continuous movement as long as they remain alive, involving body postural changes, head movements, or pharyngeal pumping. Are the authors referring to the frequency of a particular type of movement? For the purposes of this paper, the authors probably do not need to alter their imaging pipeline, but they should be substantially more specific about which behavior their method is measuring.

2) Many nematode behaviors change in response to stimulation with light, physical stimulus, or immersion in liquid. Other behaviors are suppressed by long periods spent immersed in un-mixed liquids. It remains difficult to interpret the authors' results without additional information describing how the light and culturing conditions they are use influences nematode behavior and how this influences their results. In particular, the behavioral difference observed between day 1, 2 and 3 could be expected as a technical artifact (i.e., in the absence of any underlying aging process) if nematodes remained in the same wells for multiple days.

3) The authors observe a difference in activity between nuo-6 and wild-type animals, and also between young animals and old animals. However, discussion of this is surprisingly qualitative given the quantitative thinking found elsewhere in the paper. Are the observed differences in movement approximately the same magnitude as what would be expected given previous results? Why is a significant difference between the two strains observed only on day one and three, but not day two?

4) The Figure 1 caption uses fM and fL while Figure 1 uses F1 and F2. Please make consistent.

5) Equation 2 is not fully displayed.

6) Introduction: Please give some concrete examples of experiments that require continuous long-term recording where low-resolution brightfield imaging would be the appropriate readout modality.

7) Introduction: The phrase "high resolution" is misleading, as the 15-22 µm resolution of this microscope would be considered very low resolution by most microscopists. Please insert the actual resolution here.

8) Results: I would not call this a high light collection efficiency design, as most standard microscopes have higher efficiency. Light collection efficiency is not very important here, so please change the language to be less contentious.

9) Results: Calling an LED source spatially coherent is really straining the definition. Please use different language.

10) Materials and methods: Something is wrong or confusing about the depth of focus discussion. Please cite a source for the equations and clearly define all variables. If u = f as you indicate in the text, then DOF=2c≠0.9 mm, which was stated in the text. The f-number does not appear in the equation you have, but the discussion seems to indicate that it is important (as would be expected).

11) Figure 2 legend: should be "(blue trace in B)"

12) Figure 3 legend: duplicated text "C) Focal plane…."

13) The authors limit their discussion of statistical analysis of animal movement to the legend of Figure three. This analysis would seem more natural to include either in the main text or in a dedicated statistical methods section

14) Provide more precise references to allow others to set up an ssHTS system; see for example the references for LEDs.

[Editors' note: further revisions were suggested prior to acceptance, as described below.]

Thank you for resubmitting your work entitled "Random Access Parallel Microscopy" for further consideration by eLife. Your revised article has been evaluated by Didier Stainier (Senior Editor) and a Reviewing Editor.

The manuscript has been improved but there are some remaining issues that need to be addressed before acceptance, as outlined below:

The authors stress that one of the principal interests of the system is the capacity for rapid and continuous imaging. They write, "captures data 15 fps/well by measuring groups of eight wells in parallel". Then they write, "As the system captures data from multiple wells in quick succession at a rate of 120 fps, the time needed to acquire 100 frames for each of the 76 wells for this assay is just over one minute". They need to be more explicit. When they are capturing data from 76 wells, then are they imaging each well at ca. 1.5 fps? As it stands, a reader might understand that they are switching between groups of eight wells, imaging one group at 15 fps/well, then moving to the next group after capturing 100 frames (6.7 seconds). If this were the case, then they would return to image the first group after a minute, so their system would not be continuous. This clearly requires clarification.

eLife. 2021 Jan 12;10:e56426. doi: 10.7554/eLife.56426.sa2

Author response


The reviewers all recognised the originality of your solution to perform high throughput imaging without moving parts. They do have some serious reservations, primarily regarding the evaluation of the quality and utility of the technique and in addition to the other points raised, consider it essential that you address the following:

– The standard topics for any new microscope paper: "objective" numerical aperture, image resolution, optical aberration, and camera sensor size, together with the specific aspects related to this technique, including dependence on homogeneous illumination, and sensitivity to maintenance of F2 distance.

We have addressed these issues by making several improvements to the paper. First, the system is now better described, with figure supplements (Figure 1—figure supplement 1) and tables (Materials and methods: Table 1) The resolution of the system has been quantified, both qualitatively (Figure 1—figure supplement 2) and quantitatively (Materials and methods: Table 2). In addition, we found that we can move the F2 distance dynamically by almost a millimeter by switching LED wavelength, which greatly simplifies focal plane issues (Figure 3C, Figure 3—figure supplement 1, and Video 2). The text also now includes details relating to specific issues raised by the reviewers (discussed below).

– A substantial expansion of the scope of the data presented, to provide readers with sufficient evidence with which to evaluate the quality of the technique, including proof of principal with a 96-well plate assay.

We have implemented a multiwell imaging system based on imaging most of the wells in a 96-well plate (See Video 1) and used this to perform a proof of principle study on C-elegans mutants with reduced activity (Figure 3A and B).

– A direct quantitative comparison with existing HTS imaging solutions.

As there are many HTS systems, we decided to address this issue by comparing the images collected using our platform to those collected using a standard on-axis optical path, which most microscopes and HTS systems use (Figure 1—figure supplement 2, and new section “Image quality quantification” in Materials and methods). We compare the performance both to a theoretical calculated maximum as well as to a setup that uses the same lenses but in a more standard configuration.

Reviewer #1:

Ashraf and colleagues describe an approach to perform high throughput screening imaging without moving parts. The setup is original and offers to experimentalists the flexibility to record quasi-simultaneously stacks of images of multiple samples at the full field of resolution of the camera. The optical aberration inherent to the use of a parabolic mirror are mostly overcome by collimating light from the objective lens. The images require a post-processing in two steps for taking into account the image stretching on the detector and the variation in magnification due to the variation of the distance between the mirror and the image. Two applications illustrate the potential of the solid-state HTS.

To my opinion, the following points need to be clarified:

– How homogeneous is the field of illumination with a single LED? Especially for a large field of illumination, a non-homogeneous illumination would compromise the quantifications.

As the reviewer correctly points out, the illumination field is not particularly homogeneous as we do not use any collimating optics above the LED. We find, however, that field flatness is not essential for the biological studies we typically conduct, as our examples involve looking at the differences between images. The intensity of a pixel in any one frame is effectively normalized in these measurements (either by background subtraction or rescaling based on the maximum and minimum values of that pixel’s intensity over the duration of the recording). This has been made clearer in the text: “The illumination of the sample by a spatially coherent source produces grey scale images, and in our studies, it is the change in this intensity that is of interest.”

We should note that if field flatness was indeed needed, collimating optics could be added over each LED but this would increase system cost.

– The accuracy of this ssHTS is related to the robustness at keeping the distance F2 constant between samples. In other words, how sensitive is the image acquisition to the potential variation in the F2 distance between samples as well as within a single large field of view?

Sensitivity to variations in the sample-objective separations are determined by the Rayleigh length of the objective lenses. As long as the samples remain within the Rayleigh length (approx. 1 mm for a 100 mm focal length lens), a sharp image of the sample will be formed. In addition, we observe a strong dependence of focal plane location on LED wavelength which we confirmed using Zemax optical simulations: red and blue LED illumination result in images from planes that are roughly 1mm apart. As alignment is maintained to <2 mm by the Thorlabs cage system, we find that most of wells are sufficiently in focus to resolve samples. Figure 3C now has an example of an image that has samples (C. elegans) at slightly different planes and shows how this can be corrected by changing LED colour. Video 2 gives an example where LED colour is switched rapidly to obtain pairs of images, allowing selection of the best image for analysis. Figure 3—figure supplement 1 shows all wells from a single row of a 96 well plate, which can be used to assess sensitivity to small variations in F2 distance (i.e. by wells captured at a single LED colour).

– The magnification Mc must be explained.

We thank the reviewer for catching this. Mc is now defined on : “The combined magnification (MC=M*S)”.

– Is the post-processing compensation applied only in the y-direction?

Assuming that such publication aims to disseminate the use of an ssHTS setup to a wide scientific community, I find the description of the setup as well as the applied image post-processing rather succinct, even with the 3D printing and source codes information.

We agree that our original submission was missing needed details. We’ve expanded the paper, including images of the setup (Figure 1—figure supplement 1), and a table in the Materials and methods section that give additional details (Table 1, Materials and methods). Post-processing compensation is applied in both x and y directions, as described in the caption of Figure 1. The small amount of residual geometric correction has been applied in both axes. The distortion correction algorithm is a generic algorithm that does not take into account the specific geometry of the mirror.

Reviewer #2:

Astronomers have spent centuries learning how to image the night sky with limited sensor hardware. Ashraf et al. present an ingenious adaptation of a technology developed for telescopes-parabolic reflectors-for imaging biological samples. In principle, the approach seems like it could be incredibly useful across a wide range of applications where multiple samples must be imaged in tandem. By placing multiple samples under a single parabolic reflector, multiplexing of samples and imaging hardware can be accomplished without sample-handling robots or moving cameras. The authors highlight two applications: cardiac cells in culture and free-moving nematodes.

The authors explain the theory behind their technique in a clear and convincing way. However, the biggest challenge in most imaging projects is making the theory work in practice. In its current form, the manuscript falls far short of demonstrating the practical usefulness of parabolic mirrors for imaging biological samples. The authors include only a small amount of image data-for the nematode work, this consists of eight images collected from two plate regions. Data of this scope cannot provide readers or reviewers with sufficient evidence with which to evaluate the quality of the technique.

1) The images shown-are they typical or are they the best possible images that can be collected from the device? The authors do not provide any quantitative evaluation of the quality of their images, in absolute terms or relative to existing methods, with which to understand the practical performance of parabolic mirrors. The authors should estimate the spatial resolution and dynamic range that can be obtained in practice with the devices, and evaluate how such image quality metrics vary across the entire field of view. Does performance degrade towards the edge of the mirror? Does performance degrade over time, as devices become de-calibrated with use?

We’ve added several components to the paper that help address the reviewer’s concerns. First, videos with additional examples are now included (Video 1), as well as images of resolution charts (Figure 1—figure supplement 2). Figure 3—figure supplement 1 has images from 8 adjacent wells (a single row) in a 96 well plate, which should give the reader a sense of how images quality and focus can vary. As the reviewer notes, image quality does degrade toward the edge of the mirror – this has now been quantified in Materials and methods: Table 2, which gives information on contrast ratio and resolution as a function distance from the optical axis. As with any system, it can be decalibrated with use, but given that we are working at relatively low magnification we have not found this to be a significant concern.

2) The manuscript is additionally weakened by the absence of a non-trivial measurement made with the device. Pilot experiments are included, demonstrating that images can be collected. However, no evidence is provided to show that these images can be used to compare samples and draw biological conclusions from them. A more convincing proof-of-principle would involve the measurement of some non-trivial biological difference between samples measured with the device, either confirming previous work or discovering something new.

We agree that our original submission was missing a substantive example. We constructed a new imaging system to address this concern and now have a convincing proof-of-principle study (see Figure 3).

3) The authors highlight the comparative simplicity of their method: it eliminates the need for motorized samples or cameras. However, this simplicity must come at some: for example a substantially increased use of space or perhaps an increase in delicate calibration required, or equipment price. If a 0.25 meter mirror is required to measure four C. elegans plates, how large a mirror would be required to measure 16 plates-the number that can typically be measured using a flatbed scanner? The authors could also expand greatly on other practical issues: for example, is a dedicated imaging table required to align mirrors and samples? Readers would benefit from a clearer evaluation of the practical trade-offs in deploying parabolic mirrors in a laboratory setting relative to other imaging approaches.

We thank the reviewer for this suggestion. A new section (Materials and methods: Practical considerations) has been added that addresses their concerns, and details regarding vibration isolation was added to Table 1 (we used small Sorbothane pads to reduce vibrations when needed, which is inexpensive). As we discuss in the “Practical considerations” section, the systems we designed have a small footprint and are low cost. Rather than scale the mirror, the number of systems could be scaled as total cost primarily depends on the number of imaging objectives used. Multiple systems may well be preferable as this would allow slower cameras to be used, and optical distortions introduced by large axial distances would be less evident.

Reviewer #3:

The authors present a cool new idea: using a large parabolic reflector in combination with a macroscopic lens array and rapidly modulated LED array to enable fast image multiplexing between spatially separated samples. I believe that there may be interesting applications that would benefit from this capability, although the authors have not clearly demonstrated one. The paper is short, and light on discussion, details, and data.

1) The manuscript does not discuss several standard, key topics for any new microscope paper: "objective" numerical aperture, image resolution, optical aberration (other than distortion, which is discussed), and camera sensor size.

We thank the reviewer for pointing out this omission on our part. We’ve included the details in Table 1.

2) Why was an array of low-performance singlet lenses used? With that selection, the image quality cannot be good. Can the system not be paired with an array of objectives or higher performance multielement lenses?

It is certainly true that the architecture could incorporate higher specification imaging objectives. However, for the 96 well systems and higher there are no commercial multi-element lenses available. Also, in terms of practicality, one of our aims was to keep costs down to a level where these systems would see widespread use and be easy to duplicate to increase total capacity. We now address this in section “Practical considerations”

3) Fluorescence imaging is not discussed or demonstrated but would obviously increase the impact of the microscope. At least some discussion would be helpful.

We agree that fluorescence would increase the impact of the microscope. However, this system is designed to be used for brightfield imaging applications. This allows us to achieve high frame rates without compromising signal to noise. Fluorescence imaging may be possible, but the low NA of the imaging objectives would severely limit the SNR and /or the rate of image capture. This issue is now also addressed in “Practical considerations”.

4) Actual HTS applications are almost always implemented in microtiter plates (e.g. a 96-well plate) to reduce reagent costs and enable automated pipetting, etc. I do not believe anyone would implement HTS in thousands of petri dishes. The paper would be strengthened substantially by a demonstration of simultaneous recording from all (or a large subset) of the wells in a 96-well plate. It's not clear whether this is possible due to the blind spot in the center of the parabolic mirror's field of view that is blocked by the camera.

We thank the reviewer for this suggestion. We now have a study that meets this criterion (Configuration 2 in Table 1, and data in Figure 3 and its corresponding video).

5) One of the primary motivations for this approach is given in the first paragraph as: "wide-field imaging systems [which capture multiple samples in one frame] have poor light collection efficiency and resolution compared to systems that image a single sample at a given time point." With a f = 100 mm singlet lens, the light collection efficiency of the demonstrated microscope is also low (estimated NA = 0.12) and the resolution is unimpressive with the high-aberration lens and 1x magnification. They demonstrated only trans-illumination applications (e.g. phase contrast), where light collection efficiency is not important. I believe a fancy photography lens mounted directly on a many-megapixel camera set to image all or part of a microtiter plate could likely outperform their system in throughput and simplicity, at least for the demonstrated applications of cardiomyocytes and C. elegans.

We agree that the alternative suggested by the reviewer may be viable. However, while a single-lens system could achieve similar light collection efficiency, the system would necessarily be very large (and considerably more expensive, as telecentric optics may be needed to image off-axis wells). The increased size would prohibit the use of incubators for exploring a range of sample environments. Finally, the frame rate of the machine vision camera is much higher than that of a high-resolution camera: the ssHTS system allows for fast random access capture for any sample under the parabolic mirror, allowing comparison between samples at high frame rates, which something that a conventional setup can’t do.

[Editors' note: further revisions were suggested prior to acceptance, as described below.]

Overall, the reviewers recognised that this setup could be useful for readers looking for an inexpensive bright-field imaging setup for multi-well imaging without fluorescence. They agree that you have provided substantial additional data and analysis that support your claim that parabolic reflectors can be useful for studying many samples in a parallel. The new images and videos of a 96-well plate were judged compelling. In particular, the prospect of focusing samples simply by adjusting the wavelength of illumination was thought an important step towards the goal of designing a "solid-state" imaging apparatus with no moving parts.

Nevertheless, although the reviewers were satisfied that you had addressed most or all of the material points, they had considerable reservations about the way in which these improvements were presented and could not support publication of the manuscript in its present form. Indeed, there are numerous lacunae and parts where the writing is not at all clear and leads to confusion about how the system functions and what its limits are. Please find below a summary of their most important comments and a series of points made by individual reviewers, all of which would need to be addressed in a revised manuscript. If this would require a further round of experimental work, then I am afraid that we will not be able to consider your work for publication.

The description of the 96-well plate data was considered both terse and vague, leaving unclear several aspects of experimental design and interpretation.

– If no samples were loaded into columns 6 and 7 of the 96 well plate because of the use of 40 LED arrays, this should be stated explicitly.

We have added the following lines to the document:

In Materials and methods, Sample Preparation and Imaging:

“50 µL of this worm suspension was loaded into a 96-well, flat-bottom assay plate (Corning, Costar), excluding half of row 5 and all wells in rows 6 and 7 as shown in Figure 3A, as these wells were either obscured by sensor hardware or not illuminated by the two 40-element LED arrays (see Configuration 2 in Table 1).”

And, in Materials and methods: Optical Setup, Table 1:

“Camera placement obscures 12 wells in the 96 well plate imaged in configuration 2 (see Figure 3A), and the use of two commercial 40 element LED arrays precludes imaging all wells in a 96 well plate as the LEDs are permanently mounted on a board that is too large to be tiled without leaving gaps.”

– What was the exact reason for not imaging in column 4 of row E or row 1F.

These discrepancies between the theoretically predicted function of the device and its practical performance must be clarified.

If these issues do not reflect technical limitation of the device, you would need to demonstrate that these columns/wells can be imaged just like the others (i.e. this is a criterion for rejection).

In order to demonstrate to the reviewer that all wells that aren’t obscured by the camera are imageable, we present the above composite calibration image (of an overhead sheet printed with random characters with a 1.1 mm height font) which was generated by moving a single 40 element LED array and lenses to cover all locations corresponding to wells in a 96 well plate.

The system described in the paper uses two commercial 40 element LED arrays. The arrays cannot be placed side by side without gaps (see Author response image 1B – parts the board reserved for input pads are highlighted in yellow), so the use of these particular arrays precludes complete coverage of a 96 well plate without moving the array or the 96 well plate. This would not be an issue with a different array (e.g. a custom-built LED array or an LED array from another manufacturer), and we consider this a practical instead of a technical limitation. These LED arrays were chosen as they were easily sourced during the university shutdown from a Canadian supplier.

Author response image 1. (A) composite image showing images from all wells aside from those under the camera housing, with wells obscured by cabling in Figure 3 highlighted in yellow.

Author response image 1.

(B) Image of one of the LED arrays with region reserved for electrical connections highlighted in yellow; the size of these regions prevents tiling the array and complete coverage of the 96 well plate (C) images of the system showing the location of the cable (red arrows) that obscured the wells in Figure 3, and its orientation for the image collected in the top panel of this figure (panel A).

In the paper, wells E4 and F1 were obscured by a cable running from the camera. This wasn’t noticed until after the first images for the experiment shown in Figure 3 were collected, and was left in place in order to avoid moving the sample and reorienting the camera (which would have involved partial disassembly of the microscope). The orientation of the camera and cable was such so that this was not an issue when collecting the calibration image. The orientation of the cable for the experiment in Figure 3 and orientation of the cable the calibration measurement (Author response image 1A) are shown in Author response image 1C. As you can see, the black cable (indicated by the large red arrow) is angled so that it passes between the sample and the lenses in the left panel. As a result, the cable partially obscured wells E4 and F1 (indicated by small red arrows) in the experiments.

We have amended the text to clarify the missing wells in Figure 3 with the following three changes:

i) In the previous submission, we originally indicated that the wells were obscured in the legend of Figure 3 with the statement: “Wells obscured by hardware are denoted by an “X” symbol.”

We have changed this to read: “Wells obscured by hardware are denoted by an “X” symbol (see Materials and methods: Table 1)”

ii) And in Materials and methods: Table 1, we have added the following clarification:

In addition, some wells (marked with an “X” in Figure 3a) were inadvertently obscured by hardware between the sample and objective lenses for the motion quantification experiment in Figure 3, however the number of imaged wells was considered to be sufficient to demonstrate the utility of the RAP system.”

iii) As the calibration image is useful in the context of building the same RAP system that was used to capture data in Figure 3, we include this image as part of a zip file which also includes images of the LED array and 3D printed parts with associated STL files. We also note that since author response images and text are available to eLife readers, the information about wells E4 and F1 will be presented in the context of the reviewer’s question and remain accessible.

The details about acquisition are so poorly described that one reviewer wrote, "why not leverage those capabilities to scan 33 wells in parallel at 15 Hz rather than one well at a time at 15 Hz?". This illustrates how you have failed to convey clearly that the system captures data from multiple wells in parallel at 120-500 fps. One video does show how 120 fps can be divided up across 80 wells, and it is illustrated in Figure 1, but these details need to be explicitly stated in the text. In Figure 2, a faster (500 fps) camera of lower resolution is used. As well as making all acquisition details clearer, you will need to provide an explicit discussion of camera choice, and any trade-off between image resolution and speed. Additionally, you need to address another technical limitation and trade-off, namely rates of acquisition and data transfer so that the possibility (and cost) of implementation in a HTS setting (see below) is clear.

We regret the confusion caused by our previous submission, and fully agree that the wording was not clear. We have amended the text in several places to make these details clear.

In the main text, the description of data acquisition was changed from:

“Motion was quantified by measuring the fraction of pixels per frame that display a change in intensity of over 25% for 100 sequential frames captured at 15 fps for each well (Figure 3A and B; Video 1).” to “… motion was quantified by measuring the fraction of pixels per frame that display a change in intensity of over 25% for 100 sequential frames captured at 15 fps/well by measuring groups of eight wells in parallel (see Figure 3A and B; Video 1, and Materials and methods: Image processing).”

The last sentence of the same paragraph has been changed from:

“As the system captures data from multiple wells in parallel, the time needed to measure activity in 76 wells for this assay is just over one minute.” to “As the system captures data from multiple wells in quick succession at a rate of 120 fps, the time needed to acquire 100 frames for each of the 76 wells for this assay is just over one minute.”

The relevant sentence in the legend in Figure 3 was changed from:

“Motion is estimated by summing absolute differences in pixel intensities in sequential frames imaged at 15 Hz.” to “wells in each row are imaged in parallel (8 wells at 15 fps per well), and net motion is estimated in each well by summing absolute differences in pixel intensities in sequential frames (see Materials and methods: Image analysis).”

We have also gone into greater details on camera choice and limitations associated with data throughput in the Materials and methods section. The following section was added:

“The camera used in Figure 2 was chosen for its high frame rate as we were interested in imaging cardiac activity, which in our experience requires 40fps acquisition speeds. […] A faster hard drive (e.g. an SSD) or RAID array would significantly increase throughput.”

The center of the optical system is intrinsically blind since space is required to position the detector. This point is implicit and must be documented as a function of the magnification.

The following sentence was added to Table 1: “Camera placement obscures 12 wells in the 96 well plate imaged in configuration 2 (see Figure 3A).”

However, we note the number of obscured wells depends only on the physical size of the camera and is independent of optical magnification.

The microscope resolution in the 15 – 20 µm range is poor relative to the sub-micron resolution of a traditional microscope. It is probably not good enough, for example, to tell individual mammalian cells apart in a confluent monolayer. This will limit the range of potential applications. Thus the spatial resolution needs to be stated in the Abstract or Introduction, not buried deep in the Materials and methods.

We have added the following line to the Introduction:

“We demonstrate the system in two low-magnification, low resolution settings using single element lenses and other easily sourced components. “

However, the use of low magnification, low NA lenses is not a defining limitation of our method. We have added the following paragraph to the Materials and methods section to clarify this point and make the reader aware of potential issues with moving to higher magnification:

“The use of low magnification optics in our current implementation is not a defining property of RAP, as higher NA, high magnification optics could be used. […] As is the case with conventional microscope designs, a high magnification RAP system would likely require a mechanism for finely adjusting objective heights to keep each sample in focus, as the depth of field of the objective lenses would be reduced.”

Further, you will need to include a detailed comparison with a standard commercial widefield microscope with a scanning stage (resolution, imaging modalities, scan time, defocusing over time, cost, integration into robotic workflows).

We have added the following text and table to the Materials and methods section, and included three additional references to support the comparison:

“While the resolution of a RAP system is similar to conventional microscopes, RAP systems differ from conventional microscopes in several respects. Table 2 summarizes some key differences between a conventional automated widefield imaging microscope and the two RAP systems implemented in this publication. We note that higher performance RAP systems (e.g. faster disks, a faster camera, corrected optics) would display improved performance.”

In addition, we have added the following to the discussion to ensure that readers are aware of the differences between our system and a conventional automated microscope:

“Automated microscopes excel at applications where data can be acquired from samples sequentially as a single high numerical aperture (NA) objective is used. […] Here, the speed increase afforded by RAP must be weighed against the many benefits of using a mature technology such as the automated widefield microscope (see Table 2 for a comparison between these systems).”

If you wish to claim HTS capacity, the comparison should also include a dedicated commercial HCS/HTS system, and the many other features needed for HTS (e.g. see https://www.ncbi.nlm.nih.gov/books/NBK558077/).

Alternatively, in the absence of easy incorporation of the system in an automated setting, at a time when HTS can mean >50,000 tests/day, "High Throughput" should be removed from the title ("multi-sample" or "multi-well" would be better), and any suggestion in the text that your system is HTS-compatible seriously toned down.

We have removed high throughput from the title and removed the majority of references to high-throughput in the paper. For example, the lead sentence in the Introduction now reads:

“Conventional multi-sample imaging modalities either require movement of the sample to the focal plane of the imaging system 1–4, movement of the imaging system itself 5,6, or use a widefield approach to capture several samples in one frame 7,8.”

The term “high-throughput” is still occasionally used, but its context is limited to imaging multiple samples rapidly, or when discussing other platforms. Table 2 also states that the RAP system hasn’t been validated as part of a conventional high-throughput workflow.

Equally, given the very different uses in optics or electronics of the term "solid-state", you should avoid it in the title, replacing it, for example by, "with no moving parts".

We have removed the term solid-state from the title as requested.

There was also a general consensus that your design is not a Newtonian telescope, which has two mirrors instead of a single mirror as in this design. The reviewers recommend changing "novel Newtonian telescope design" to "large on-axis parabolic mirror design", "parabolic reflector", or something similar that is clearer and more accurate. Including a phrase like "inspired by a Newtonian telescope" would be acceptable.

We now use the phrase “inspired by Newtonian telescope” instead of “modified Newtonian telescope” as requested.

Further points made by individual reviewers:

1) The authors compare wild-type C. elegans to nuo-6 mutants. The authors are vague and qualitative in their descriptions of movement. Nuo-6 mutants are predicted to "move less frequently" than wildtype. This is confusing, as C. elegans generally exhibit some degree of continuous movement as long as they remain alive, involving body postural changes, head movements, or pharyngeal pumping. Are the authors referring to the frequency of a particular type of movement? For the purposes of this paper, the authors probably do not need to alter their imaging pipeline, but they should be substantially more specific about which behavior their method is measuring.

We regret the confusion and have amended the text as follows:

“We validate the potential for RAP to be used in a higher-throughput imaging application by measuring motion in C. elegans mitochondrial mutant nuo-6(qm200)18, which have a slower swimming rate (frequency of thrashing) than that of the wild type C. elegans. […] As the system captures data from multiple wells in quick succession at a rate of 120 fps, the time needed to acquire 100 frames for each of the 76 wells for this assay is just over one minute. “

The motion estimate we use is not based on the conventional method used to quantify thrashing frequency in C. elegans, but rather quantifies pixel intensity changes between frames.

We stress that our intention was not to measure thrashing frequency differences in C. elegans wild type and mutant strains, as this is already known. Rather, we leverage the fact that the documented difference in thrashing frequency will generate a measurable difference when quantifying pixel intensity changes in wells containing these two strains. Our aim was (only) to use these strains to demonstrate that the system can quantify differences in activity multiple, simultaneously imaged wells.

We have added the following statement (in Materials and methods: Image processing) in order to further clarify our intent:

“We note that while this algorithm yields results which are consistent with published manual measurements of thrashing frequency (see Figure 2j in Yang and Hekimi18), there is no direct correspondence between this metric and specific behaviours (head movement, posture changes etc.). However, the documented difference in the activity of the two strains we use would predict the difference in the metric that we observe and can be used as a validation of the imaging method to track movement over time.”

2) Many nematode behaviors change in response to stimulation with light, physical stimulus, or immersion in liquid. Other behaviors are suppressed by long periods spent immersed in un-mixed liquids. It remains difficult to interpret the authors' results without additional information describing how the light and culturing conditions they are use influences nematode behavior and how this influences their results. In particular, the behavioral difference observed between day 1, 2 and 3 could be expected as a technical artifact (i.e., in the absence of any underlying aging process) if nematodes remained in the same wells for multiple days.

3) The authors observe a difference in activity between nuo-6 and wild-type animals, and also between young animals and old animals. However, discussion of this is surprisingly qualitative given the quantitative thinking found elsewhere in the paper. Are the observed differences in movement approximately the same magnitude as what would be expected given previous results? Why is a significant difference between the two strains observed only on day one and three, but not day two?

We agree that the inclusion of the two extra imaging days is a potential source of confusion as animals are impacted by multiple inputs, and so we have opted to remove the data for days 2 and 3. The remaining data (on day 1), along with the included video examples are sufficient to demonstrate that we can use the system to collect data from multiple wells, which is the focus of the submitted paper.

4) The Figure 1 caption uses fM and fL while Figure 1 uses F1 and F2. Please make consistent.

We thank the reviewer for pointing this out. We have edited the figure to be consistent.

5) Equation 2 is not fully displayed.

We thank the reviewer for pointing this out. It was cropped during the pdf conversion process, and we will ensure that it is displayed properly in the submitted version.

6) Introduction: Please give some concrete examples of experiments that require continuous long-term recording where low-resolution brightfield imaging would be the appropriate readout modality.

We have added the following text to the discussion, as well as four references:

“RAP systems are better suited for dynamic experiments in relatively macroscopic samples where multiple continuous long-duration recordings are the primary requirement. For example, rhythms in cultured cardiac tissue evolve over hours28 or even days29,30, but display fast transitions between states (e.g. initiation or termination of re-entry31), necessitating continuous measurement. In these experiments, moving between samples would result in missed data.”

7) Introduction: The phrase "high resolution" is misleading, as the 15-22 µm resolution of this microscope would be considered very low resolution by most microscopists. Please insert the actual resolution here.

We originally intended for high resolution to refer to pixel count not numerical aperture but agree that this is confusing. We have removed the term.

8) Results: I would not call this a high light collection efficiency design, as most standard microscopes have higher efficiency. Light collection efficiency is not very important here, so please change the language to be less contentious.

The language has been changed to: “The brightfield nature of the illumination used in this design allows images to be captured with sub millisecond exposure times. “

9) Results: Calling an LED source spatially coherent is really straining the definition. Please use different language.

While the reviewer is right to state that LEDs are not normally coherent sources, they can be coherent if the emitting area is small. The following images (Author response image 2), taken at the same magnification, demonstrate that the emitting areas of these LEDs is approximately 200 x 200 um. This provides a spatial coherence value > 0.5 compared to a spatial coherence value of 0.88 for a DPSS laser (e.g. see DOI:10.1038/s41598-017-06215-x). It is therefore safe to assume that these emitters have a high degree of spatial coherence.

Author response image 2. LED emitting area is approximately 200x200 microns.

Author response image 2.

We have added the reference to the paper. We have also changed the text from

“coherent” to “partially coherent” to avoid confusion:

“The illumination of the sample by a spatially partially coherent source12 produces grey scale images, and in our studies, it is the change in this intensity that is of interest. “

10) Materials and methods: Something is wrong or confusing about the depth of focus discussion. Please cite a source for the equations and clearly define all variables. If u = f as you indicate in the text, then DOF=2c≠0.9 mm, which was stated in the text. The f-number does not appear in the equation you have, but the discussion seems to indicate that it is important (as would be expected).

We thank the reviewer for spotting this error. There was a typo in the equation, and the f-number is now included.

11) Figure 2 legend: should be "(blue trace in B)"

We thank the reviewer for spotting this typo. The legend has been changed.

12) Figure 3 legend: duplicated text "C) Focal plane…."

We thank the reviewer for spotting the duplicate text- it has been removed.

13) The authors limit their discussion of statistical analysis of animal movement to the legend of Figure three. This analysis would seem more natural to include either in the main text or in a dedicated statistical methods section

The following line is now in the main text:

“Instead of measuring thrashing frequency directly, motion was quantified by measuring the fraction of pixels per frame that display a change in intensity of over 25% for 100 sequential frames captured at 15 fps/well by measuring groups of eight wells in parallel (see Figure 3A and B; Video 1, and Materials and methods: Image processing).”

In addition, there is now new section (Image Processing) in Materials and methods with added details:

“Image processing: We find that image brightness drops with increased objective lateral distance and that images are subject to aberrations at the edges. […] The values are plotted as a percentage.”

14) Provide more precise references to allow others to set up an ssHTS system; see for example the references for LEDs.

We thank the reviewer for this suggestion. The LED array used (manufacturer and part name) is now in Table 1. In addition, as mentioned earlier in this response, we now include a zip file with additional details (including part numbers and stl files) targeted to readers interested in building their own device.

[Editors' note: further revisions were suggested prior to acceptance, as described below.]

The manuscript has been improved but there are some remaining issues that need to be addressed before acceptance, as outlined below:

The authors stress that one of the principal interests of the system is the capacity for rapid and continuous imaging. They write, "captures data 15 fps/well by measuring groups of eight wells in parallel". Then they write, "As the system captures data from multiple wells in quick succession at a rate of 120 fps, the time needed to acquire 100 frames for each of the 76 wells for this assay is just over one minute". They need to be more explicit. When they are capturing data from 76 wells, then are they imaging each well at ca. 1.5 fps? As it stands, a reader might understand that they are switching between groups of eight wells, imaging one group at 15 fps/well, then moving to the next group after capturing 100 frames (6.7 seconds). If this were the case, then they would return to image the first group after a minute, so their system would not be continuous. This clearly requires clarification.

We apologize for the confusion. As shown in Video 1, we can indeed image all wells in parallel continuously at 1.5 fps/well. However, for Figure 3, in order to capture 15 fps per well (which was needed to visualize C. elegans thrashing behaviour) we capture a subset of wells in parallel and switch to different subsets (every 6.7 seconds) until all the wells are imaged. The entire data set is 100 sequential frames for each well, so we do not return to the first group for this particular assay. We have changed the text in that paragraph as follows:

In this experiment, the frame rate of the camera is limited to 120 fps (see Materials and methods: Practical considerations and Video 1), allowing us to image 8 wells in parallel at 15 fps/well. 80 wells (76 active and 4 blank wells – see Figure 3A) are imaged by measuring 100 frames from each well in a row of 8 wells in parallel (800 frames/row) before moving to the next row, until all 80 wells are imaged (a total of 8000 frames). The system quantified decreased activity in nuo-6(qm200) which is consistent with published results18 (Figure 3B). The time needed to perform this assay is just over one minute (8000 frames/120 fps = 67 seconds).

We also note that relationship between framerate, data throughput and the number of samples that can be imaged continuously in parallel is discussed in more detail in “Materials and methods: Practical considerations.”

Associated Data

    This section collects any data citations, data availability statements, or supplementary materials included in this article.

    Supplementary Materials

    Source code 1. Arduino code for controlling the camera and LED array for Configuration 1.
    elife-56426-code1.zip (1.3KB, zip)
    Source code 2. Python code for sorting images for each sample into unique directories.
    elife-56426-code2.zip (1.2KB, zip)
    Supplementary file 1. STL files and instructions for assembling RAP Configurations 1 and 2.
    elife-56426-supp1.zip (612KB, zip)
    Transparent reporting form

    Data Availability Statement

    All data generated during this study are included in the manuscript and supporting files.


    Articles from eLife are provided here courtesy of eLife Sciences Publications, Ltd

    RESOURCES