Abstract
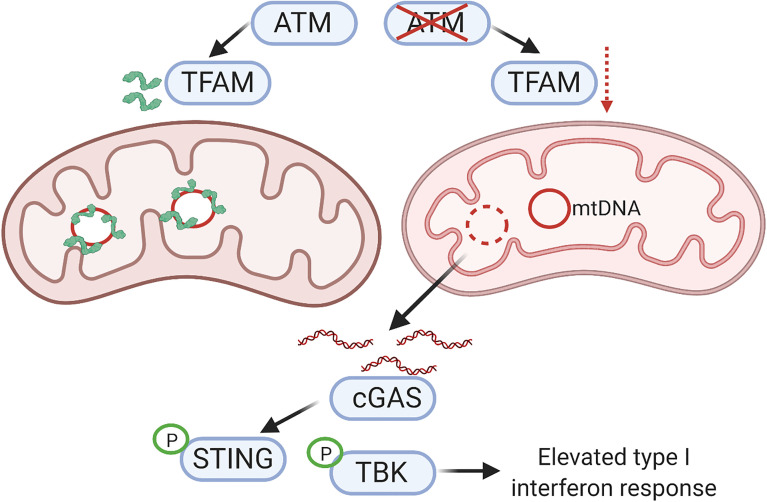
Novel approaches are needed to boost the efficacy of immune checkpoint blockade (ICB) therapy. Ataxia telangiectasia mutated (ATM) protein plays a central role in sensing DNA double-stranded breaks (DSBs) and coordinating their repair. Recent data indicated that ATM might be a promising target to enhance ICB therapy. However, the molecular mechanism involved has not been clearly elucidated. Here, we show that ATM inhibition could potentiate ICB therapy by promoting cytoplasmic leakage of mitochondrial DNA (mtDNA) and activation of the cGAS/STING pathway. We show that genetic depletion of ATM in murine cancer cells delayed tumor growth in syngeneic mouse hosts in a T cell–dependent manner. Furthermore, chemical inhibition of ATM potentiated anti–PD-1 therapy of mouse tumors. ATM inhibition potently activated the cGAS/STING pathway and enhanced lymphocyte infiltration into the tumor microenvironment by downregulating mitochondrial transcription factor A (TFAM), which led to mtDNA leakage into the cytoplasm. Moreover, our analysis of data from a large patient cohort indicated that ATM mutations, especially nonsense mutations, predicted for clinical benefits of ICB therapy. Our study therefore provides strong evidence that ATM may serve as both a therapeutic target and a biomarker to enable ICB therapy.
Keywords: Oncology
Keywords: Cancer immunotherapy, Cytokines, DNA repair
Introduction
Despite the great promise for immune checkpoint blockade (ICB) therapy, only 10%–30% of patients respond to it (1–5). Therefore, there is a major push to identify novel therapeutics that can enhance the efficacy of ICB therapy. Previous studies have shown that many factors can influence whether a tumor responds to ICB treatment, including programmed cell death ligand 1 (PD-L1) expression levels (6), tumor mutational burden (TMB) (7, 8), and the “hotness” of the tumor immune microenvironment (TIME), determined by the amount of lymphocytic infiltrate in the tumor microenvironment, in particular of cytotoxic T cells (8). Activation status of innate cellular immunity is a major factor regulating the tumor microenvironment. Innate cellular immunity is normally responsible for mammalian cellular defense against viral infections. Examples of cellular innate immunity sensors include the cGAS/STING pathway for cytosolic dsDNA (9, 10) and the RIG-I/MDA5 pathway for cytosolic dsRNA (11). Recent studies showed that both of these pathways could play important roles in cancer immunotherapy. For example, the cGAS/STING pathway was shown to be critical for ICB therapy and radiotherapy in preclinical models (12–15). On the other hand, the RIG-1/MDA5 pathway was shown to be activated by endogenous retroviruses that could be activated by DNA methyltransferase inhibitors and synergize with ICB therapy (16, 17) and radiotherapy (18). Thus, there are many efforts underway to try to activate those innate inflammatory signaling pathways in the tumor microenvironment to enhance ICB therapy. One approach is to use STING agonists. In previous studies, STING agonists showed great promise in cancer immunotherapy in preclinical models (13, 19). Most of the current STING agonists are synthetic analogs of 2′3′-cGAMP. However, such agonists are so far mostly delivered via intratumoral injection because of poor bioavailability. Thus, there are ongoing efforts to develop STING agonists that can be delivered systemically (20–23). Even though there are candidates that showed strong promise, they are mostly at the very early stages and not yet in human clinical trials.
Inhibition of the ataxia telangiectasia mutated (ATM) protein is emerging as another promising approach to boost cellular innate immunity. Canonically, ATM plays a central role in sensing DNA double-stranded breaks (DSBs) and coordinating their repair in the mammalian genome (24, 25). As such, it is a critical factor in cellular defense against external and internal stresses that cause DNA DSBs. Because cells deficient in ATM are extremely sensitive to ionizing radiation (26), ATM inhibitors have been explored in preclinical and clinical studies as sensitizers of radiotherapy (27, 28). Recently it was found that kinase-deficient ATM in Drosophila ATM could trigger an innate immune response (29). Meanwhile, unrepaired DNA lesions induced STING pathway activation and primed antiviral and antibacterial responses in Atm–/– mice (30). More recently, it was reported that ATM inhibition could activate a type 1 IFN response in pancreatic tumor cells that could enhance ICB therapy in a cGAS/STING-independent manner (31). However, the molecular mechanisms involved in the above studies, especially those responsible for triggering spontaneous activation of the type 1 IFN response in ATM-deficient cells, were not clearly elucidated.
In the present study, we show that ATM deficiency–induced IFN-stimulated gene (ISG) expression and intratumoral lymphocyte infiltration were dependent on cGAS/STING pathway activation in several murine and human tumor cell lines. ATM inhibition led to the downregulation of mitochondrial transcription factor A (TFAM), which caused cytoplasmic leakage of mitochondrial DNA (mtDNA) that was functionally responsible for cGAS/STING activation. Our preclinical finding was validated by analyzing human clinical data, in which we show that ATM expression levels were negatively correlated with type 1 IFN gene expression in human tumor tissues. Furthermore, human tumors with ATM mutations responded significantly better to ICB therapy in a large patient cohort, suggesting that ATM gene mutation may serve as a predictive biomarker for ICB treatment.
Results
ATM inhibition suppresses tumor growth and sensitizes tumors to PD-1 blockade.
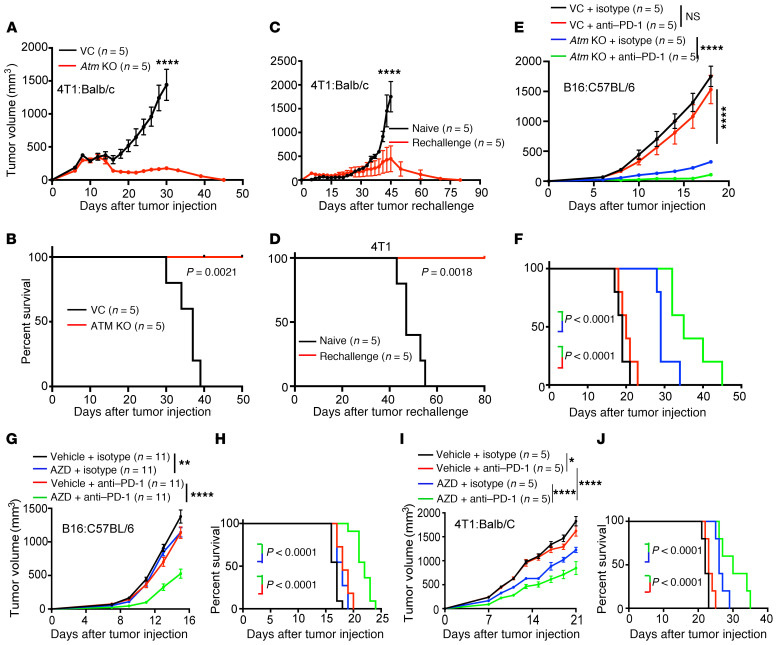
We first attempted to investigate whether ATM inhibition could suppress tumor growth in 2 poorly immunogenic murine tumor models, as reported in a murine pancreatic tumor model (31). We knocked out Atm in the poorly immunogenic 4T1 murine breast cancer cells by use of the CRISPR/Cas9 technology (32) (Supplemental Figure 1A; supplemental material available online with this article; https://doi.org/10.1172/JCI139333DS1). In vitro growth of the tumor cells was not significantly affected (Supplemental Figure 1B). However, when clonal 4T1 Atm-KO cells were inoculated into syngeneic BALB/C mice, those cells failed to form tumors, whereas vector control cells formed tumors readily (Figure 1, A and B). This striking result prompted us to determine whether the observed tumor-suppressive effect of ATM deficiency on tumor growth was dependent on an intact immune system. ATM-deficient and vector control 4T1 cells were inoculated into immunodeficient NSG mice. Our results indicated that 4T1 Atm-KO cells formed tumors almost at the same rate as the vector control cells (Supplemental Figure 1, C and D), thereby suggesting that the strong tumor-suppressive effect of Atm KO in the 4T1 tumor line was dependent on an intact immune system. A further proof for the involvement of the immune system came from tumor cell rechallenge experiments, in which WT 4T1 cells were injected into BALB/C mice that rejected 4T1 Atm-KO cells. All mice that survived the initial 4T1 Atm-KO inoculation also rejected WT 4T1 tumor cell rechallenge. In comparison, all naive mice succumbed to WT 4T1 challenge (Figure 1, C and D).
Figure 1. ATM inhibition induces a significant tumor growth delay and overcomes tumor resistance to anti–PD-1 therapy.
(A and B) Tumor volume and Kaplan-Meier survival curves for BALB/c mice inoculated with approximately 2 × 10⁵ vector control (VC) or Atm-KO 4T1 cells. (C and D) Tumor volume and Kaplan-Meier survival curves for naive and previously challenged but tumor-free BALB/C mice after rechallenge with 1 × 10⁵ WT 4T1 tumor cells. Tumor-free BALB/C mice were rechallenged after remaining tumor free 40 days following the initial inoculation with Atm-KO 4T1 cells. (E and F)Tumor volume and Kaplan-Meier survival curves for C57BL/6 mice inoculated with approximately 1 × 10⁵ vector control or Atm-KO B16F10 (B16) cells and treated with 100 μg/mouse anti–PD-1 or isotype control antibodies on days 6, 9, and 12 after inoculation. (G and H) Tumor volume and Kaplan-Meier survival curves for C57BL/6 mice inoculated with approximately 1 × 10⁵ B16F10 cells and treated with 100 μg/mouse anti–PD-1 or isotype control antibodies on days 6, 9, and 12 and with AZD1390 (AZD) (10 mg/kg) or vehicle (Veh) daily on days 4–14. Data are from 2 independent experiments. (I and J) Tumor volume and Kaplan-Meier survival curves for BALB/c mice inoculated with approximately 1 × 10⁵ 4T1 cells and treated with 100 μg/mouse anti–PD-1 antibodies or isotype control on days 6, 9, and 12 and with AZD1390 (10 mg/kg) or vehicle daily on days 4–14. Data represent the mean ± SEM. *P < 0.05, **P < 0.01, and ****P < 0.0001, by unpaired t test (A, C, E, G, and I) or log-rank test (B, D, F, H, and J).
To assess whether ATM inhibition could synergize with ICB therapy in another poorly immunogenic tumor model, we generated clonal Atm-KO cells on the B16F10 (melanoma) background using CRISPR/Cas9 technology (Supplemental Figure 1E). Syngeneic mice were injected with B16F10 Atm-KO cells and treated with anti–PD-1 antibodies following the schedule outlined in Supplemental Figure 1F. Our results indicated that Atm KO in tumor cells caused a significant tumor growth delay by itself (Figure 1E), consistent with results obtained with the 4T1 cells. Furthermore, it enhanced anti–PD-1 therapy potently in suppressing tumor growth and prolonging host survival (Figure 1, E and F). Using a previously established mathematical model (33), we concluded that the combination of Atm-KO and anti–PD-1 treatment was synergistic in suppressing tumor growth.
We next sought to determine whether a similar synergy between ATM inhibition and anti–PD-1 antibody treatment could be recapitulated by use of a small-molecule inhibitor of ATM, AZD1390. AZD1390 is a potent and selective ATM kinase inhibitor that significantly enhanced radiotherapy of glioma in preclinical models (28) and has been evaluated in a phase I clinical trial (ClinicalTrials.gov: NCT03423628). Following the schedule shown in Supplemental Figure 1G, we found that, while AZD1390 alone had the almost negligible effect on tumor growth in B16F10 tumors, it significantly enhanced the antitumor efficacy of the anti–PD-1 antibody (Figure 1, G and H). We also observed similar results in the 4T1 model (Figure 1, I and J). Here, the anti–PD-1 antibody had minimal effect on 4T1 tumor growth, but the ATM inhibitor alone showed a more significant tumor-suppressive effect. Importantly, combined AZD1390 and anti–PD-1 treatment had a synergistic effect in prolonging the survival of host mice in the B16F10 model, which was based on the Chou-Talalay model (33) (Figure 1G). Therefore, our results from both genetic depletion and chemical inhibition strongly suggested that ATM deficiency could effectively enhance anti–PD-1 therapy in 2 well-established poorly immunogenic murine tumor models.
ATM inhibition activates the cGAS/STING pathway.
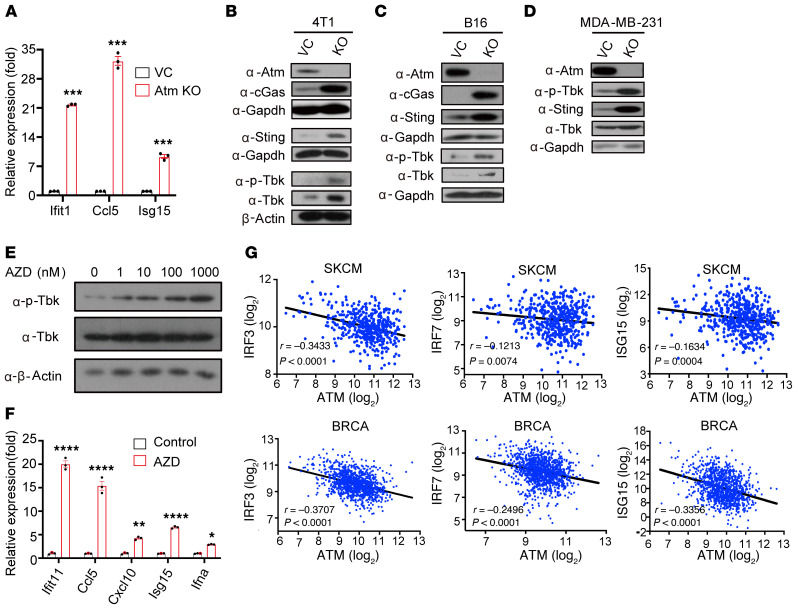
We next investigated the molecular mechanisms involved in ATM deficiency–mediated suppression of tumor growth. We first carried out gene set enrichment analysis (GSEA) of RNA-Seq data on ATM-deficient 4T1 cells in vitro. Our analysis indicated that there was a significant enrichment of genes associated with the cellular immune response in ATM-deficient 4T1 cells when compared with vector control cells (Supplemental Figure 2). One important pathway from GSEA was the innate immunity pathway (Supplemental Figure 2B) (34–36). Because it was well known that cGAS/STING was a key innate signaling pathway whose activation synergized with anti–PD-1 therapy (12), we decided to examine it in Atm-KO cells. ATM deficiency induced mRNA expression of several ISGs downstream of cGAS/STING: Ifit1, Isg15, and Ccl5 (Figure 2A). In addition, Western blot (WB) analyses showed that protein levels of cGAS, phosphorylated TNK1 (p-TBK1), and TBK1 increased substantially in ATM-deficient 4T1 breast cancer cells (Figure 2B), B16F10 melanoma cells (Figure 2C), and human breast cancer MDA-MB-231 cells (Figure 2D). Besides, we observed similar results in B16F10 cells that had been transduced with an inducible shATM minigene (Supplemental Figure 3A). To determine whether ATM inhibition–mediated cGAS/STING activation was malignant cell specific, we also examined its status in a human telomerase reverse transcriptase–immortalized (hTERT-immortalized) but nontransformed human foreskin fibroblast (HFF) cell line with ATM KO. Our analysis showed that protein levels of p-TBK1, TBK1, and STING did not increase significantly in ATM-KO HFF cells (Supplemental Figure 3B).
Figure 2. ATM inhibition enhances cGAS/STING activation.
(A) Expression of Ifit1, Ccl5, and Isg15 in vector control and Atm-KO B16F10 cells analyzed by real-time qPCR. (B–D) WB analysis of cGAS, STING, p-TBK1, and TBK1 expression in vector control and 4T1 cells (B) Atm-KO B16F10 cells (C), and MDA-MB-231 cells (D). GAPDH or β-actin was used as a protein loading control. Separate controls were used for different batches of experiments. (E) WB analysis of p-TBK1 levels in B16F10 cells treated with AZD1390 at the indicated concentrations for 48 hours. (F) Transcription levels of IFNs and ISGs in B16 cells treated with 1 μM AZD1390 for 48 hours and analyzed by qRT-PCR. (G) Correlation analysis for ATM expression level versus IRF3, IRF7, and ISG15 in human SKCM (n = 472 samples) and BRCA (n = 1100 samples) from TCGA Pan Cancer Atlas. R and P represent Pearson’s correlation coefficients and 2-tailed P values. Data represent the mean ± SEM (A and F). *P < 0.05, **P < 0.01, ***P < 0.001, and ****P < 0.0001, by 2-way ANOVA. n = 3 (A and F). α, anti.
We next determined whether chemical inhibitors of ATM, AZD1390, and Ku55933 could induce the expression of ISGs. WB analysis indicated that AZD1390 induced increased p-TBK1 in B16F10 (Figure 2E) and MDA-MB-231 (Supplemental Figure 3C) cells. In comparison, such induction was not obvious in nonmalignant HFF cells (Supplemental Figure 3D). These results were further confirmed using another ATM inhibitor, Ku55933, in MDA-MB-231 and B16F10 cells (Supplemental Figure 3, E–G). Consistent with the WB data, quantitative reverse transcriptase PCR (qRT-PCR) analysis showed that treatment with AZD1390 (Figure 2F) and Ku55933 (Supplemental Figure 4C) also induced ISG expression in B16F10 cells. It is interesting to note that chemical inhibition induced an increase in p-TBK1 with a much faster kinetics (Supplemental Figure 3G) than with shRNA-mediated ATM knockdown, which took 4–5 days to see obvious effects (Supplemental Figure 3A). Although the exact mechanisms were not clear, we speculated that this increase in p-TBK1 might be caused by the faster kinetics of chemical inhibition of ATN kinase activities versus the slower kinetics of ATM protein degradation induced by shRNA knockdown. These data therefore demonstrated that chemical inhibition of ATM could induce the activation of cGAS/STING and downstream signaling, similar to genetic depletion.
We next examined the relationship among ATM and ISGs at the transcriptional level in patients with cancer by analyzing the transcriptome profiles in The Cancer Genome Atlas (TCGA) database. Our analysis indicated that ATM expression was negatively correlated with the expression of ISGs (IRF3, IRF7, and ISG15) in human skin cutaneous melanoma (SKCM) (n = 472 samples) and breast carcinoma (BRCA) (n = 1100 samples) (Figure 2G), which is consistent with our observation in mouse tumor cells. In addition, the we observed this negative correlation in additional human cancer types (Supplemental Figure 4, A–C), including prostate adenocarcinoma (PRAD), which is known to be resistant to anti–PD-1 therapy.
Cytoplasmic release of mtDNA is responsible for ATM deficiency–induced activation of the cGAS/STING pathway.
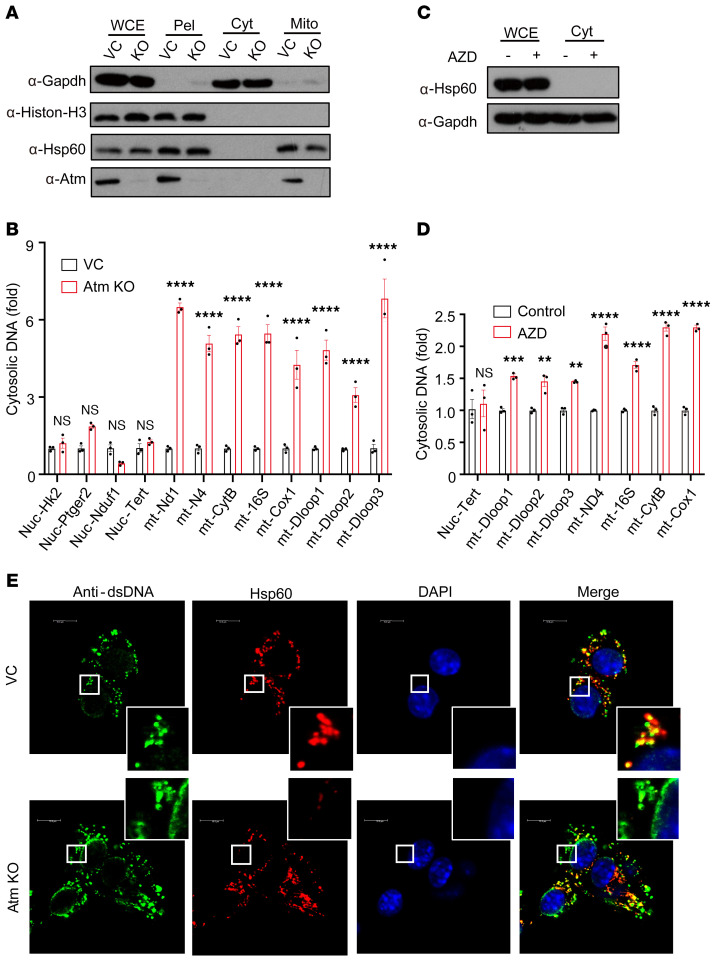
We next sought to elucidate the mechanisms involved in ATM deficiency–induced cGAS/STING activation. Because the cGAS/STING pathway functions to detect the presence of cytosolic DNA, we hypothesized that ATM deficiency might cause an increase in cytosolic DNA, thereby triggering activation of the cGAS/STING pathway. In theory, cytosolic DNA could originate from 2 sources: the nucleus and the mitochondria. To determine the source of cytosolic DNA in ATM-deficient cells, we fractionated vector control and ATM-deficient B16F10 cells and purified DNA from cytosolic extracts. The efficiency of our fractionation was determined by WB, in which histone H3, Hsp60, and GAPDH were used as markers for nuclear, mitochondrial, and cytosolic fractions, respectively (Figure 3A). qPCR analysis of the cytosolic fraction indicated that cytosolic DNA in ATM-deficient B16F10 and 4T1 cells was mainly mtDNA (as represented by Dloop1, Dloop2, Dloop3, Nd1, Nd4, 16S, CytB, and Cox1), instead of nuclear DNA (represented by Tert, Hk2, Ptgr2, and Nduf1) (Figure 3B). Similar results were also observed in ATM-deficient 4T1 cells (Supplemental Figure 5, A and B). We further showed that ATM inhibition by AZD1390 also induced mtDNA release in B16F10 cells (Figure 3, C and D). Further proof of ATM deficiency–induced mtDNA leakage came from antibody-based immunofluorescence staining of dsDNA. Our results indicated that ATM-deficient B16F10 cells had a markedly increased amount of cytosolic dsDNA outside of the mitochondria (Figure 3E). We observed similar results in ATM-deficient 4T1 cells (Supplemental Figure 5C). Thus, our results provided strong evidence for ATM deficiency–induced mtDNA release.
Figure 3. ATM inhibition increases the cytoplasmic release of mtDNA.
(A) WB verification of our cytosol fractionation protocol. Vector control and ATM-KO B16 cells were fractionated, and whole-cell extracts (WCE), pellets (Pel), cytosolic extracts (Cyt), and mitochondrion (Mito) were blotted using the indicated antibodies. (B) qRT-PCR quantification of cytosolic DNA extracted from digitonin-permeabilized cytosolic extracts of control and ATM-KO B16F10 cells. Normalization was carried out as described in Methods. (C) WB analysis of B16F10 cells treated with 1 μM AZD1390 for 48 hours and subjected to fractionation. (D) qRT-PCR analysis of DNA extracted from digitonin-permeabilized extracts of control and AZD1390-treated B16F10 cells. (E) Vector control and Atm-KO B16F10 cells were costained with anti-dsDNA (green), anti-Hsp60 (red), and DAPI. Scale bars: 10 μm. Original magnification, ×12 (insets). Data represent the mean ± SEM (B and D). **P < 0.01, ***P < 0.001, and ****P < 0.0001, by 2-way ANOVA. n = 3 (B and D). Nuc, nuclear.
Our identification of mitochondria as the main source of cytosolic DNA was consistent with gene ontology (GO) analysis of RNA-Seq data of Atm-KO 4T1 cells, which clearly showed the downregulation of various mitochondria-related GO pathways in Atm-KO versus vector control 4T1 cells (Supplemental Figure 6, A–C).
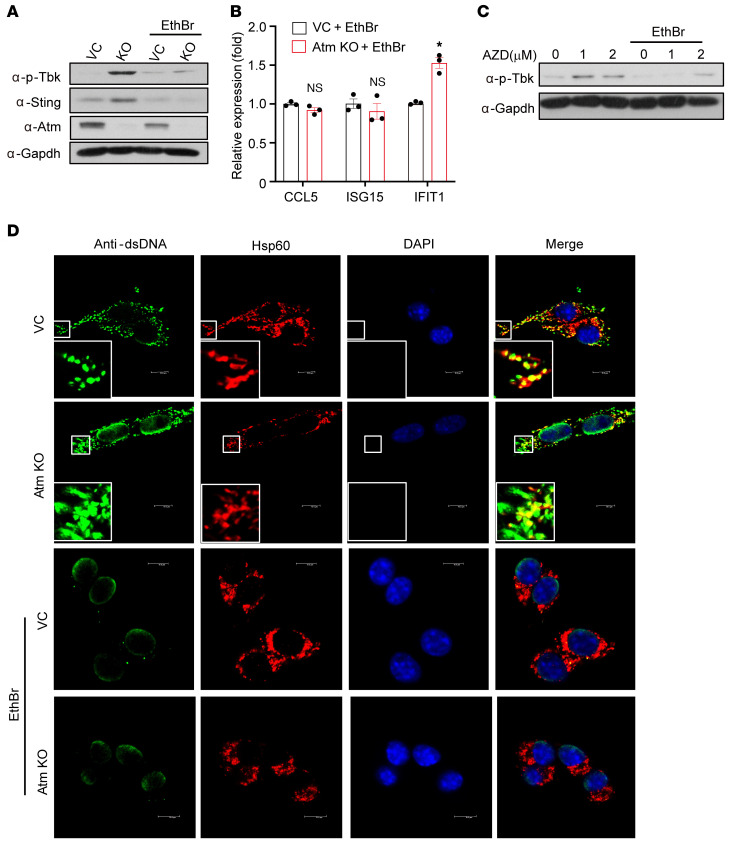
We next investigated whether mtDNA release into the cytosol was indeed responsible for activation of the cGAS/STING pathway in Atm-KO cells. We used an established protocol for depleting cellular mtDNA by culturing cells in low-concentration ethidium bromide (EthBr) (37). As expected, depletion of cellular mtDNA substantially diminished ATM deficiency–induced increases in STING and p-TBK1 protein levels (Figure 4A) and ISGs (Figure 4B). In addition, EthBr-induced depletion of mtDNA in WT B16F10 also abrogated cGAS/STING activation induced by the ATM inhibitor AZD1390 (Figure 4C). Furthermore, EthBr-induced depletion of mtDNA in ATM-deficient B16F10 cells substantially reduced the release of cytosolic dsDNA outside of the mitochondria (Figure 4D, lower panels). Besides EthBr treatment, we also used another mtDNA synthesis inhibitor, dideoxycytidine (ddC). As expected, depletion of cellular mtDNA by ddC markedly diminished ATM deficiency–induced increases in cGAS, STING, and p-TBK1 protein levels (Supplemental Figure 7A), ISG mRNA levels (Supplemental Figure 7B), and cytosolic dsDNA release from mitochondria (Supplemental Figure 7C).
Figure 4. Cytoplasmic release of mtDNA is responsible for ATM inhibition–induced cGAS/STING activation.
(A) WB analysis of protein levels of p-TBK1 and STING in vector control and Atm-KO B16F10 cells exposed to 100 ng/mL EthBr for 20 days to deplete mtDNA. (B) qPCR analysis of IFN response gene expression in vector control and Atm-KO B16F10 cells that had been treated with 100 ng/mL EthBr for 20 days. Data represent the mean ± SEM. *P < 0.05, by 2-way ANOVA. n = 3. (C) WB analysis of p-TBK1 levels in B16F10 cells that had been treated with sham or 100 ng/mL EthBr for 20 days and then exposed to 1 μM AZD1390 for 48 hours. GAPDH was used as a protein loading control. (D) Vector control and Atm-KO B16F10 cells that had been treated with 100 ng/mL EthBr for 20 days were costained with anti-dsDNA (green), anti-Hsp60 (red), and DAPI. Scale bars: 10 μm. Original magnification, ×12 (insets).
TFAM downregulation is involved in ATM deficiency–mediated cGAS/STING activation.
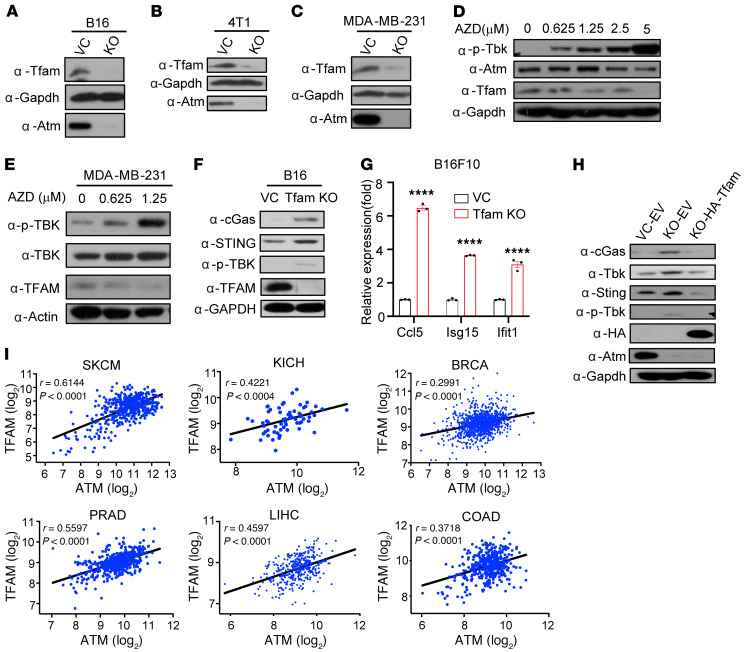
What triggered mtDNA leakage into the cytosol? GSEA of our RNA-Seq data suggested that ATM KO significantly downregulated the expression of various mitochondria-related genes (Supplemental Figure 6). We therefore focused on TFAM, which is a histone-like protein and a master regulator of mitochondrial biogenesis as well as a regulator of mitochondrial genome replication (38, 39). Previously published data indicated that TFAM deficiency could prime the antiviral innate immune response through mtDNA release (40). We thus measured TFAM levels in ATM-deficient tumor cells. Indeed, TFAM levels decreased significantly in ATM-deficient B16F10 (Figure 5A), 4T1 (Figure 5B), and MDA-MB231 (Figure 5C) cells. Chemical inhibition of ATM by use of AZD1390 in B16F10 (Figure 5D) and MDA-MB231 (Figure 5E) cells also substantially downregulated TFAM expression.
Figure 5. ATM inhibition downregulates TFAM to facilitate the release of mtDNA and activation of cGAS/STING.
(A–C) WB analysis of expression levels of TFAM in murine vector control and Atm-KO B16F10 and 4T1 cells and human MDA-MB-231 cells. (D) WB analysis of TFAM levels in B16F10 cells treated with AZD1390 for 48 hours. (E) WB analysis of TFAM levels in MDA-MB-231 cells treated with AZD1390 for 48 hours. (F) WB analysis of TFAM, cGAS, STING, and p-TBK1 expression levels in vector control and Tfam-KO cells. (G) Expression of IFN-β and related ISGs in vector control and Tfam-KO cells analyzed by real-time qRT-PCR. Data represent the mean ± SEM. ****P < 0.0001, by 2-way ANOVA. n = 3. (H) WB analysis of cGAS, TBK1, STING, HA, and ATM expression levels in murine vector control and Atm-KO B16F10 cells that had been transfected with empty vector and in Atm-KO cells that had been transfected with HA-Tfam. (I) Positive correlation of mRNA expression levels between ATM and TFAM in patients with cancer using TCGA data set. R and P represent Pearson’s correlation coefficients and 2-tailed P values, respectively. n = 472, 66, 1100, 498, 373, and 437 for SKCM, KICH, BRCA, PRAD, LIHC, and COAD, respectively.
We further examined the functional relevance of TFAM as a downstream factor for cGAS/STING activation by knocking it out in B16F10 cells (Figure 5F). Tfam KO significantly enhanced the expression levels of ISGs (Figure 5G) and decreased mtDNA copy numbers in B16F10 cells, as was observed with Atm KO (Supplemental Figure 8A). Similarly, Tfam KO increased the amount of cytoplasmic/extramitochondrial DNA in B16F10 cells as assessed by immunofluorescence staining (Supplemental Figure 8B) or subcellular fractionation and qPCR (Supplemental Figure 8, C–D). To further establish the functional importance of TFAM in ATM deficiency–induced cGAS/STING activation, we induced overexpression of Tfam in Atm-KO B16F10 cells. WB analysis showed that overexpression of TFAM in Atm-KO B16F10 cells abrogated the increase in protein levels of cGAS, STING, p-TBK1, and TBK1 in ATM-deficient B16F10 cells (Figure 5H). In addition, exogenously expressed TFAM in ATM-deficient B16 cells also reduced the expression of ISGs (Supplemental Figure 9A) and mitochondrial dsDNA release (Supplemental Figure 8, B and C) that were stimulated in ATM-deficient cells. These results thus established the functional importance of TFAM downregulation in mediating ATM deficiency–induced mtDNA release and cGAS/STING activation.
We further examined the relationship between ATM and TFAM at the transcriptional levels in patients with cancer by analyzing TCGA database. Our analysis indicated that ATM expression had a positive correlation with TFAM expression in multiple human cancers (Figure 5I). Human cancer data were therefore consistent with our experimental observations.
Functional requirement of the cGAS/STING pathway in mediating ATM inhibition–induced tumor growth delay and ICB sensitivity.
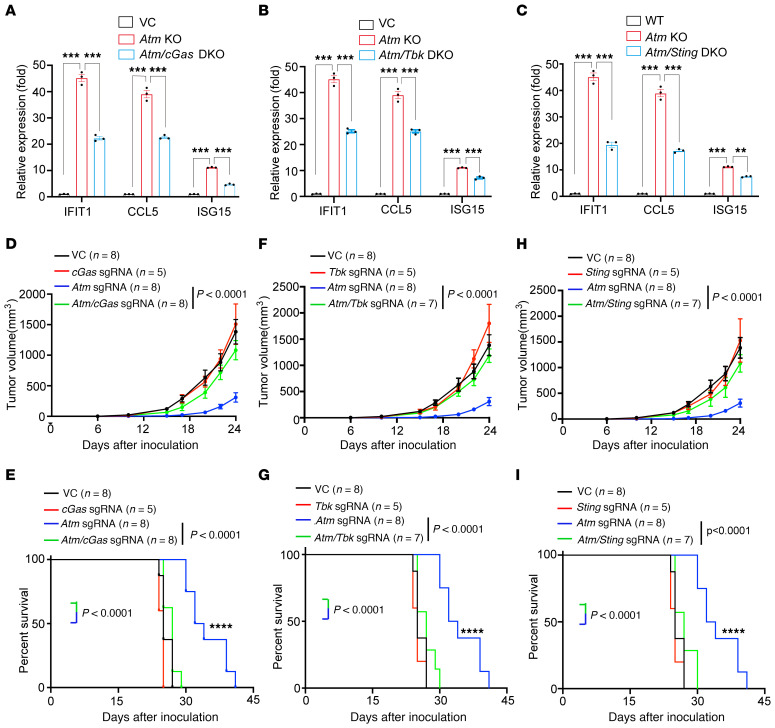
ISGs could be activated by both the DNA-sensing cGAS/STING pathway and the dsRNA-sensing MDA5/MAVS pathway (41). To narrow down which signaling pathway was responsible for the ATM deficiency–induced ISGs, we generated cGas-, Sting-, Tbk1-, and Mda5-KO cells in vector control and B16F10 Atm-KO cells (Supplemental Figure 10A). We then performed qRT-PCR analysis of mRNA levels of Ifit1, Ccl5, and Isg15 in these cells. Our results indicated that ISG transcriptional activation in ATM-deficient B16F10 cells was significantly attenuated in Atm/cGas–double-KO (DKO) (Figure 6A), Atm/Tbk1-DKO (Figure 6B), and Atm/Sting-DKO (Figure 6C) cells, but not in Atm/Mda5-DKO cells (Supplemental Figure 10B). These results therefore suggested that the cGAS/STING pathway was mainly responsible for ATM deficiency–induced ISG activation. In comparison, a previous study in which ATM inhibition induced a type 1 IFN response was shown to be independent of cGAS/STING (31).
Figure 6. The cGAS/STING pathway is functionally required for a type 1 IFN response and tumor growth suppression mediated by ATM inhibition.
(A–C) Transcriptional levels of the ISGs Ifit1, Ccl5, and Isg15 in B16F10 cells with vector control, Atm KO, or Atm/cGas DKO (A), Atm/Tbk1 DKO (B), or Atm/Sting DKO (C) as analyzed by real-time qRT-PCR. n = 3. (B) Transcriptional levels of ISGs in vector control, Atm-KO, and Atm/Tbk1-DKO B16F10 cells as analyzed by real-time qRT-PCR. (C) Transcriptional levels of ISGs in vector control, Atm-KO, and or Atm/Sting-DKO B16F10 cells as analyzed by real-time qRT-PCR. (D and E) Tumor volume and Kaplan-Meier survival curves for C57BL/6 mice inoculated with 1 × 10⁵ vector control, cGas-KO, Atm-KO, or Atm/cGas-DKO B16F10 cells. (F and G) Tumor volume and Kaplan-Meier survival curves for C57BL/6 mice inoculated with 1 × 10⁵ vector control, Tbk1-KO, Atm-KO, or Atm/Tbk1-DKO B16F10 cells. (H and I) Tumor volume and Kaplan-Meier survival curves for C57BL/6 mice inoculated with 1 × 10⁵ vector control, Sting-KO, Atm-KO, or Atm/Sting-DKO B16F10 cells. The vector control and Atm-KO groups were the same in D–I. Data are presented separately for easier visualization. Data represent the mean ± SEM. **P < 0.01, ***P < 0.001, and ****P < 0.0001, by unpaired t test (A–D, F, and H) or log-rank test (E, G, and I).
To determine whether ATM deficiency–induced activation of the cGAS/STING pathway was functionally responsible for the observed tumor growth suppression, we compared the tumor formation rates of Atm-KO, Atm/cGas-DKO, Atm/Sting-DKO, Atm/Tbk1-DKO, and Atm/Mda5-DKO B16F10 cells in syngeneic C57BL/6 mice. As expected, deletion of cGas (Figure 6, D and E), Tbk1 (Figure 6, F and G), or Sting (Figure 6, H and I) was each sufficient to abrogate Atm inhibition–elicited antitumor immunity. In contrast, Atm/Mda5-DKO (Supplemental Figure 10, C and D) cells formed tumors at the same rate as Atm-KO cells. In addition, anti–PD-1 treatment showed no significant tumor delay in Atm/cGas-, Atm/Tbk1-, or Atm/Sting-DKO tumors (Supplemental Figure 10, E–G) Our results thus suggested that the cGAS/STING pathway was mainly responsible for ATM deficiency–mediated tumor growth delay and sensitization to anti–PD-1 therapy.
ATM inhibition–mediated tumor growth suppression depends on intratumoral lymphocyte infiltration.
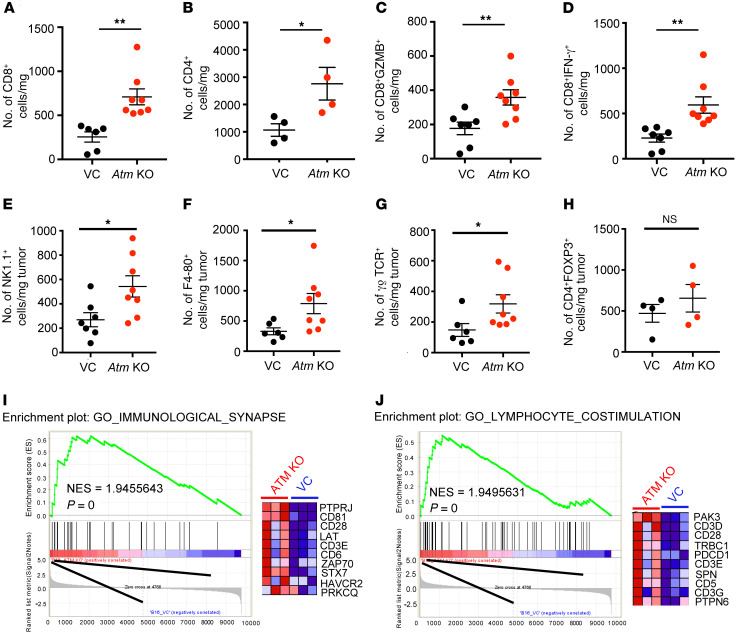
As the efficacy of ICB therapy was shown to be associated with tumor-infiltrating lymphocytes (TILs) (8), we assessed whether ATM inhibition could boost lymphocytes infiltration. We analyzed the TILs in vector control and ATM-deficient B16F10 tumors by flow cytometry (see Supplemental Figure 11 for gating strategy). We found a significant increase in CD8+ and CD4+ T cell infiltration in ATM-deficient B16F10 tumors when compared with control tumors (Figure 7, A and B). Furthermore, we also found increased levels of granzyme-B+CD8+ (GZMB+CD8+) and IFN-γ+CD8+T cells (Figure 7, C and D), both indicators of activated cytotoxic T cells, in ATM-deficient B16F10 tumors when compared with vector control tumors. We also discovered that ATM deficiency enhanced the infiltration of NK1.1+ (NK cells) (Figure 7E), F4/80+(macrophages) (Figure 7F), and γδ T cell receptor+ (γδTCR+) (Figure 7G) cells. In contrast, we observed no significant increase in CD4+FOXP3+ Tregs in ATM-deficient tumors (Figure 7H). We further conducted transcriptomic profiling of control and ATM-deficient B16F10 tumors. GSEA of our RNA-Seq results indicated that several important signaling pathways, including immune synapse (Figure 7I), lymphocyte costimulation (Figure 7J), and TCR signaling (Supplemental Figure 12, A and B), were significantly enriched in ATM-deficient tumors. In contrast, Atm/cGas-, Atm/Tbk1-, and Atm/Sting-DKO tumors showed decreased infiltration of CD4+ T cell cells (Supplemental Figure 13A), CD8+ T cells (Supplemental Figure 13B), and NK1.1+ cells (Supplemental Figure 13C), all of which were increased in tumors deficient in ATM alone.
Figure 7. ATM inhibition enhances lymphocyte infiltration.
(A–D) Average numbers of tumor-infiltrating CD8+ T cells (A), CD4+ T cells (B), GZMB+CD8+ T cells (C), IFN-γ+CD8+ T cells (D) per milligram of tissue from transplanted vector control or Atm-KO B16F10 tumors grown in C57BL/6 mice. Flow cytometric analysis was performed on day 13 after inoculation with 1 × 10⁵ tumor cells. Data are from 2 independent experiments. (E–H) Average number of tumor-infiltrating NK1.1+ NK cells (E), F4-80+ macrophages (F), γδTCR+ T cells (G), and FOXP3+ Tregs (H) per milligram of tumor tissue in vector control and Atm-KO B16F10 tumors grown in C57BL/6 mice. Tumors were analyzed by flow cytometry on day 13 after implantation. Data were aggregated from 2 independent experiments. (I and J) GSEA of immunological synapse (I) and lymphocyte costimulation (J) gene expression in control and Atm-KO B16F10 tumors. The FDR was calculated using GSEA. Data represent the mean ± SEM. *P < 0.05 and **P < 0.01, by unpaired t test (A–H).
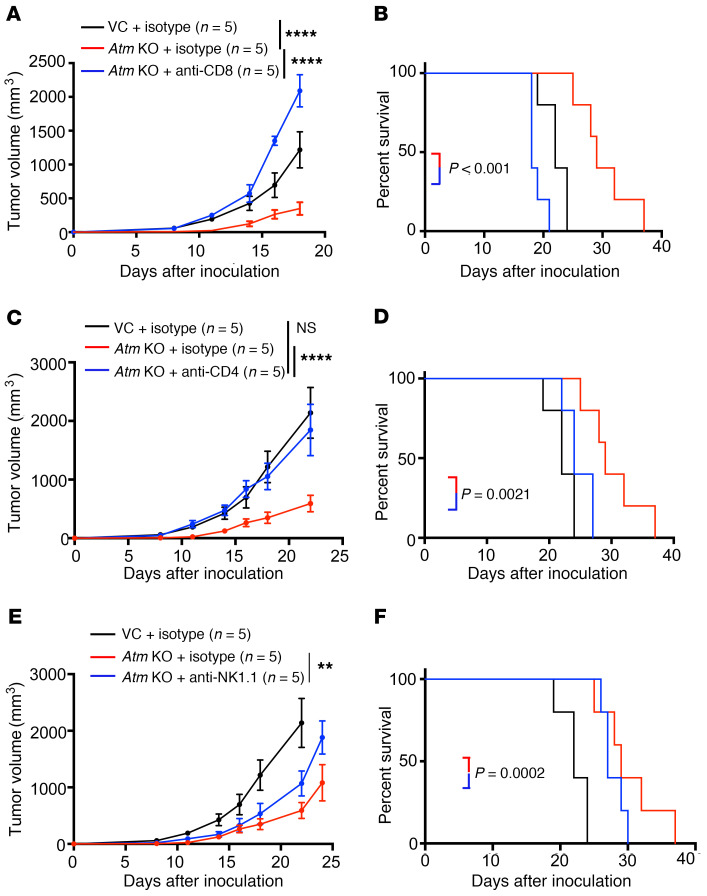
In order to determine the relative importance of different immune effector cells on the growth delay observed in ATM-deficient B16F10 tumors, we used well-established antibody-based methods to deplete CD8+ T cells, CD4+ T cells, and NK cells. Our results indicated that depletion of CD8+ or CD4+ T cells significantly or completely abrogated the tumor growth delay in ATM-deficient B16F10 tumors, respectively (Figure 8, A–D). In comparison, depletion of NK cells had a more moderate, but nonetheless significant, effect in attenuating the tumor growth delay observed in ATM-deficient tumors (Figure 8, E and F). Taken together, these results strongly suggested that ATM deficiency–induced tumor growth delay was dependent on intratumoral lymphocyte infiltration, especially CD8+ and CD4+ T cell infiltration.
Figure 8. Tumor growth suppression mediated by ATM deficiency is dependent on T cells.
(A and B) Tumor volume (A) and Kaplan-Meier survival curves (B) for C57BL/6 mice inoculated with approximately 1 × 10⁵ vector control or Atm-KO B16F10 cells and treated with 100 μg/mouse anti-CD8 or isotype control on days 1, 4, and 7. (C and D) Tumor volume (C) and Kaplan-Meier survival curves (D) for C57BL/6 mice inoculated with approximately 1 × 10⁵ vector control or Atm-KO B16F10 cells and treated with 100 μg/mouse anti-CD4 or isotype control on days 1, 4, and 7. (E and F) Tumor volume (E) and Kaplan-Meier survival curves (F) for C57BL/6 mice inoculated with approximately 1 × 10⁵ vector control or Atm-KO B16F10 cells and treated with 100 μg/mouse anti-NK1.1 or isotype control on days 1, 4, and 7. The vector control and Atm-KO groups are the same for A–F. Data are presented in separate panels for easy visualization. Data represent the mean ± SEM. **P < 0.01 and ****P < 0.0001, by unpaired t test (A, C, and E) or log-rank test (B, D, and F).
Loss of ATM predicts for clinical benefit of ICB therapy in patients with cancer.
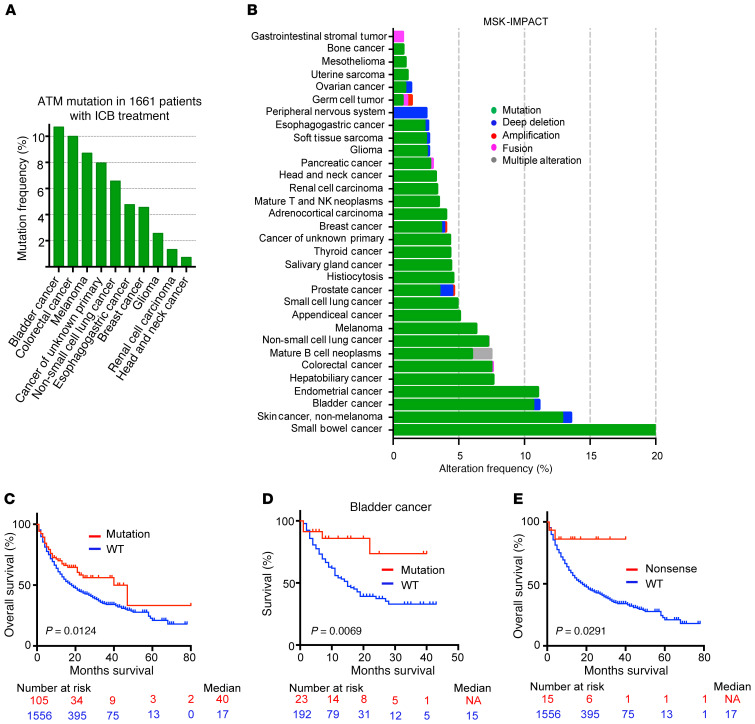
To explore the role of ATM in ICB cancer treatment, we analyzed recently published clinical and genomic data from a large cohort of 1661 patients with late-stage cancer treated with ICB at Memorial Sloan Kettering Cancer Institute, which we refer to as the MSK-TMB cohort (42). We found that approximately 6.32% of the patients in the cohort across different cancer types had mutations in the ATM gene (Figure 9A and Supplemental Table 1). Among them, patients with bladder, colorectal, melanoma, non–small-cell lung, esophagogastric, or breast cancer had the highest mutation rates. This pattern of mutation rates among different cancer patients also held true in the much larger MSK-IMPACT (Memorial Sloan Kettering–Integrated Mutation Profiling of Actionable Cancer Targets) cohort consisting of 10,336 patients with cancer, where the overall prevalence of ATM mutations reached 4.83% (Figure 9B and Supplemental Table 2) (43). Most important, we found that the patients with ATM mutations had a significantly better overall survival (OS) than those without this mutation (Figure 9C). This was in contrast to patients in the MSK-IMPACT cohort who had not gone through ICB treatment: those patients with ATM mutations had OS rates similar to those without (Supplemental Figure 14A), suggesting that mutation in the ATM gene was a predictive rather than prognostic biomarker for ICB treatment. Further analysis of the MSK-TMB cohort showed that, among different cancer types, ATM mutation also predicted for better OS (82.6%) in bladder cancer (Figure 9D). A similar trend was also observed in non–small-cell lung cancer (NSCLC) (Supplemental Figure 14B), although the difference did not reach statistical significance, given the low patient numbers. Most notably, the functional relevance of ATM in ICB therapy was strongly suggested by the observation that patients in the ICB-treated MSK-TMB cohort with nonsense ATM mutations had a significantly better OS (>85%) than did those without (Figure 9E). Only 2 of 15 patients died during the entire observation period. Furthermore, to exclude the confounding effect of high TMB, we reanalyzed the patients with bladder cancer by only considering those with a TMB value of less than 20. Our analysis indicated that, among those patients, the difference in OS between those with ATM mutations and those without remained significant (Supplemental Figure 14C). Therefore, our analysis of patient data suggested that the mutant ATM gene is a functionally involved player as well as a promising predictive biomarker for ICB therapy.
Figure 9. ATM mutations predict clinical benefits in patients with cancer treated with ICB therapy.
(A) ATM mutation frequencies across 10 human cancer types among 1661 patients with advanced-stage cancer who were treated with ICB therapy. (B) Frequencies of ATM alterations across different cancer types in the MSK-IMPACT cohort of 10,336 patients. Data were obtained from the cBioportal website. (C) Kaplan-Meier analysis of OS in ICB-treated patients with ATM mutations (red) versus those without (WT) (blue). (D) Kaplan-Meier analysis of OS of bladder cancer for patients with (red) or without (blue) ATM mutations. (E) Kaplan-Meier analysis of OS in ICB-treated patients with an ATM nonsense mutation (red) versus those without (blue). P values in C, D, and E were calculated by using the log-rank (Mantel-Cox) test.
Discussion
Despite previous findings that ATM deficiencies trigger the activation of cellular innate immunity in Drosophila (29), patients and mice (30), and pancreatic tumor cells (31), the molecular mechanisms involved remain elusive. The present study clearly indicates that cytosolic presence of dsDNA and the activation of the cGAS/STING pathway are responsible for activation of the type 1 IFN response. It also reveals that cytosolic leakage of mtDNA is the main source of the cytoplasmic dsDNA in ATM-deficient tumor cells. We believe our finding, therefore, is a major step forward toward a better understanding of the molecular mechanisms involved in ATM inhibition triggered type 1 IFN response. Our finding is also consistent with the increasing number of noncanonical functions of ATM being identified, such as the regulation of mitochondrial homeostasis (44) and mitophagy (45, 46).
An important mechanistic revelation from our study was the positive relationship between ATM and TFAM in both murine and human cells, especially in human tumor tissues (Figure 5). Because TFAM plays an important role in mtDNA homeostasis (38, 39), and because its deficiency causes aberrant mtDNA packaging and its leakage into the cytosol, as well as activation of the innate IFN response (40), our discovery of the relationship between ATM and TFAM therefore reveals a key mechanism through which ATM regulates the IFN response in a manner that is independent of its role in coordinating the repair of genomic DNA damage. Interestingly, several excellent studies have explored the relationship between ATM and mtDNA homeostasis. In one study, ATM deficiency was found to result in mtDNA depletion, similar to our findings (47). However, the depletion appeared to be related to disruptions in cellular deoxyribonucleoside triphosphate (dNTP) pools and was not associated with TFAM downregulation. In another study, ATM-induced mtDNA depletion was found to be related to mtDNA repair deficiency, caused by reduced protein levels of DNA ligase 3 (48). On the other hand, another study showed that activated ATM could induce HuR to stabilize TFAM mRNA in irradiated cancer cells (49), consistent with our studies. How does one reconcile the disparate mechanisms revealed by different studies? Although at present there is no consensus on this issue, it is possible that the mechanisms, including downregulation of TFAM, disruptions in the dNTP pools, and defects in DNA ligase 3, are not mutually exclusive. They could all coexist in an ATM-defective cell. Furthermore, there could be differences between normal, nontransformed cells and malignant tumor cells, which have quite different metabolic needs, that would explain the different behaviors with regard to TFAM involvement. Finally, our data demonstrating the rescue of mtDNA leakage and abrogation of cGAS/STING activation by TFAM overexpression strongly suggest a functional involvement of TFAM in ATM deficiency–induced activation of cGAS/STING in tumor cells.
The finding that ATM deficiency led to potent activation of the cGAS/STING pathway in the absence of DNA damaging agents has important clinical implications. Although STING agonists have shown great promise in cancer therapy in preclinical models, all the agents that are currently being evaluated in patients are delivered intratumorally. A systemically delivered agent that can activate cGAS/STING would have significant advantages in being able to reach metastatic diseases. The results from our current study clearly demonstrated that ATM inhibitors have potential in this respect.
Because only a minority of patients can benefit from ICB treatment, biomarkers are needed to identify those patients to reduce costly and unnecessary treatments. However, currently available biomarkers that are clinically approved, including high PD-L1 expression (>50%) for NSCLC and microsatellite instability (MSI) for MMR-deficient tumors, can only identify a subset of patients who might benefit. This is because only approximately 22% of patients with NSCLC have high PD-L1 expression levels (50), and the prevalence of MSI across all cancer types is approximately 3.8% (51). Therefore, we believe our identification of the ATM mutation as a biomarker to select for patients who would benefit from ICB treatment is significant clinically. If validated in future prospective clinical trials, its impact as an ICB biomarker could be as high as that of MSI status, because the prevalence of ATM mutations is approximately 4.83% across the MSK-IMPACT pan-cancer cohort of 10,336 patients and greater than or close to 10% in small bowl cancer, melanoma, bladder cancer, and endometrial cancer (43). In addition, our results also suggest that patients with ataxia telangiectasis who develop tumors may be good candidates for ICB therapy.
In summary, our study suggested that deficiencies in ATM could stimulate the innate immunity factors in the tumor microenvironment through the cGAS/STING pathway. It revealed the surprising mechanism through which ATM restrains mtDNA leakage and cellular innate immunity by maintaining TFAM levels. Moreover, we believe that one of the most exciting implications of our study is that small-molecule inhibitors of ATM could be used as a systemic cGAS/STING activator and administered together with ICB therapy. Because ATM inhibitors such as AZD1390 and AZD0156 are already being evaluated in clinical trials as sensitizers of radiotherapy, our study thus provides a strong rationale for the use of ATM as both a predictive biomarker and a therapeutic target for ICB therapy in future clinical trials.
Methods
Cell culture.
B16F10 mouse melanoma cells, 4T1 mouse BRCA cells, and MDA-MB-231 human BRCA cells were purchased from the Cell Culture facilities of the Duke University School of Medicine. B16F10, 4T1, and MDA-MB-231 cells were all grown in DMEM (MilliporeSigma) with 10% FBS. All cell lines were subjected to mycoplasma testing using the Universal Mycoplasma Detection Kit (American Type Culture Collection [ATCC]).
Antibodies.
FITC anti–mouse CD45 (30-F11), Pacific blue anti–mouse CD3 (145-2c11), Alexa Fluor 647 anti–mouse CD4 (GK1.5), APC750 anti–mouse CD8a (53-6.7), phycoerythrin (PE) anti–mouse NK1.1 (PK136), PE anti–mouse FOXP3 (MF-14), APC anti–γ/δ TCR (GL3), Alexa Fluor 647 anti–mouse IFN-γ (XMG1.2), and PE anti–mouse F4/80 (BM8) were purchased from BioLegend. Anti-Hsp60 (catalog 15282-1-AP), anti-Hsp60 (catalog 6604101-lg), and anti-GAPDH (catalog 60004) were purchased from Proteintech. Anti-cGAS (catalog 31659), anti-STING (2P2F, catalog 13647), anti-TBK1/Nak (D1B4, catalog 3504), anti–p-TBK1/p-Nak (Ser172) (D52C2, catalog 5483), and anti–MDA-5 (D74E4, catalog 5321) were purchased from Cell Signaling Technology. Anti-TFAM (catalog ab131607) and anti-ATM (catalog Ab199726) were purchased from Abcam. Anti-dsDNA (clone AC-30-10, CBL 186) was purchased from MilliporeSigma.
CRISPR/Cas9-mediated gene KO of ATM.
ATM-KO cells were generated using lentivirus-mediated CRISPR/Cas9 technology. sgRNA sequences targeting the mouse and human ATM gene are listed in Supplemental Table 3. Double-stranded oligonucleotides encoding the sgRNA sequences were cloned into the BsmB1-digested (Thermo Fisher Scientific) plasmid lentiCRISPRv2 (Addgene, deposited by Feng Zhang of MIT), which coexpresses Cas9 and sgRNA in the same vector. CRISPR lentivirus vectors were then produced according to a protocol established by the Zhang laboratory at MIT. To generate the KO cell lines, target cells were infected with lentivirus and cultured in DMEM (with 10% FBS) and selected in puromycin (1 μg/mL for B16, and MDA-MB-231 cells and 5 μg/mL for 4T1 cells).
Lentivirus vectors encoding shRNA targeting ATM.
Oligonucleotides encoding shRNA targeting ATM (sh1: CTATTACCTTTCGTGGTATAA; sh2: CCACCATATTTGGACAGGAAT) were ligated into the pINDUCER10 vector (Addgene, deposited by Stephen Elledge of Harvard Medical School; ref. 52). Lentivirus was made from the plasmid using standard procedures as described in the above. Viruses encoding ATM-targeting shRNA minigenes were then used to infect B16F10 cells. Stable cells were selected by puromycin. Inducible knockdown of ATM was performed by adding doxycycline to the culture.
Tumor growth delay in mice.
C57BL/6J and BALB/C mice were purchased from The Jackson Laboratory. NSG mice were purchased from the Division of Laboratory Animal Resources (DLAR) of Duke University. Prior to tumor cell injection, age-matched 6- to 8-week-old mice were shaved on 1 of the flanks. Tumor cells were then injected into the shaved flanks s.c. with lenti-CRISPRv2–modified control or target gene–specific KO tumor cells. Tumor volumes were measured every 2–3 days and calculated using the following formula: (length) × (width)2/2. The mice were sacrificed when tumors reached 2000 mm3 in size.
For antibody treatments, mice were given 100 μg antibody via i.p. injection on days 6, 9, and 12 after tumor cell injection using anti–PD-1 (clone 29F.1A12) or an isotype control (clone 2A3) antibody from Bio X Cell.
Lymphocyte depletion.
To evaluate the role of specific subsets of immune effector cells in mice, CD4+ T cells, CD8+ T cells, and NK cells were depleted with 100 μg i.p. injected anti-CD4 (Bio X Cell, GK1.5), 100 μg anti-CD8b (Bio X Cell, 53-5.8), and 100 μg anti-NK1.1 (Bio X Cell, PK136), respectively, on days 1, 4, and 7. Equal amounts of IgG isotype antibodies (Bio X Cell) were injected as a control.
Analysis of TILs by flow cytometry.
Approximately 1 × 10⁵ ATM-KO or vector control cells were inoculated s.c. into C57BL/6J mice. Tumors were excised on day 13 after inoculation, weighed, and then mechanically minced and incubated in DNase I (50ug/mL, MilliporeSigma) and collagenase P (2 mg/mL, MilliporeSigma) for 20 minutes at 37°C. The dissociated cells were passed through a 70 μm cell strainer (BD). The filtered cells were then blocked with an anti-CD16/32 antibody (BioLegend) and stained with the indicated surface antibodies for 20 minutes on ice. Dead cells were excluded using Live/Dead Fixable Aqua Dye (Thermo Fisher Scientific). Intracellular antibodies were added after fixation and permeabilization according to the manufacturer’s instructions (Thermo Fisher Scientific). The anti–mouse fluorochrome-conjugated antibodies are listed in the Antibodies section above. The stained cells were analyzed using a BD FACSCanto Flow Cytometer.
WB analysis.
Cells lysates were boiled in SDS sample loading buffer, resolved by 10% SDS-PAGE, and transferred onto nitrocellulose membranes. The membranes were blocked in 5% milk in Tris-buffered saline and Tween 20 (TBST) (10 mM Tris-HCl [pH 8.0], 150 mM NaCl, 0.1% Tween 20) for 1 hour at room temperature. After washing twice with TBST, the membranes were incubated overnight with the appropriate primary antibodies in BSA/TBST and then washed 3 times with TBST and probed with HRP-linked anti-IgG (1:5000 dilution) for 1 hour at room temperature. After 3 washes with TBST, the immunoreacted products were visualized using ECL reagent and autoradiography.
Immunofluorescence staining of cytosolic dsDNA.
Vector control, ATM-KO B16, and 4T1 cells were fixed in 4% buffered formalin with PBS. Cells were then mounted on 35 mm glass-bottomed poly-d-lysine–coated dishes, permeabilized with cold PBS containing 0.1% Triton X-100 for 30 minutes, and blocked with 4% bovine serum in PBS for 1 hour at room temperature. This was followed by incubation with primary anti-dsDNA (clone AC-30-10, CBL 186, MilliporeSigma) and Hsp60 (catalog 15282-1-AP, Proteintech) antibodies at room temperature for 3 hours, and then with FITC-labeled anti-IgG (1:400) and Cy3-labeled secondary antibodies at room temperature for 1 hour. Cells were costained with DAPI to visualize the nuclei. Immunofluorescence images were then taken under a confocal fluorescence microscope. The antibody used for staining dsDNA was validated in multiple previous studies (40, 53–55).
RNA-Seq.
RNA-Seq was performed to compare the transcriptome profiles of the control and ATM-KO 4T1 tumor cells in tissue culture and the control and ATM-KO B16F10 tumors grown in C57BL/6 mice. The data are deposited in the NCBI’s Gene Expression Omnibus (GEO) database (GEO GSE161912 for 4T1 tumor cells in culture and GSE161922 for B16F10 tumors).
Total cellular RNA from vector control and Atm-KO 4T1 cells was prepared using the RNeasy Plus RNA Extraction Kit (QIAGEN). Approximately 1 × 10⁵ Atm-KO or vector control B16F10 cells were inoculated s.c. into C57BL/6J mice. Tumor tissues were collected on day 13. Total RNA from tumor was prepared using the RNeasy Plus Universal Mini Kit (QIAGEN).
RNA-Seq data were processed using the TrimGalore toolkit (56), which uses Cutadapt (57) to trim low-quality bases and Illumina sequencing adapters from the 3′ end of the reads. Only reads that were 20 nt or longer after trimming were kept for further analysis. Reads were mapped to the GRCm38.p6 of the mouse genome and transcriptome (58) using the STAR RNA-Seq alignment tool (59). Reads were kept for subsequent analysis if they mapped to a single genomic location using SAMtools (60). Gene counts were compiled using the HTSeq tool (https://htseq.readthedocs.io/en/master/). Only genes that had at least 10 reads in any given library were used in subsequent analysis. Normalization and differential expression analyses were carried out using the DESeq27 Bioconductor (61) package with the R statistical programming environment. GSEA, version 10 (62), was used to identify differentially regulated pathways, and GO terms for the comparisons were used.
mtDNA depletion.
Previously published protocols were used for EthBr-induced (37) or ddC-induced (63) mtDNA depletion. Vector control, Atm-KO, and WT B16 cells were cultured in DMEM with 10% FBS. Approximately 100 ng/mL EthBr or 100 nM ddC was added to the medium for 20 days before the cells were harvested for experiments.
qRT-PCR.
Total RNA was extracted from cells using the RNeasy Mini Kit (QIAGEN) according to the manufacturer’s instructions. RNA was subjected to cDNA synthesis with random hexamer primers using SuperScript II Reverse Transcriptase (Invitrogen, Thermo Fisher Scientific). qRT-PCR was performed using the QuantiTect SYBR Green PCR Master Mix Kit (QIAGEN). Primers used for different target genes are listed in Supplemental Table 4.
Quantification of mtDNA in cytosolic extracts.
Vector control and Atm-KO B16 cells (approximately 8 × 10⁶) were divided into 2 equal aliquots. One aliquot was resuspended in roughly 500 μL of 50 μM NaOH and boiled for 30 minutes to solubilize DNA. Approximately 50 μL of 1 M Tris-HCl (pH 8.0) was added to neutralize the pH of the lysate, and the extracts served as normalization controls for total mtDNA. The second aliquot was resuspended in roughly 500 μL buffer containing 150 mM NaCl, 50 mM HEPES (pH 7.4), and 20 μg/mL digitonin. The homogenates were incubated for 10 minutes to allow selective plasma permeabilization, and then centrifuged at 980g for 3 minutes, 3 times to pellet intact cells. The first pellet was saved as the “Pel” fraction for WB analysis. The cytosolic supernatants were transferred into fresh tubes and spun at 17,000g in a microcentrifuge for 10 minutes to pellet any remaining cellular debris, yielding cytosolic preparations free of nuclear, mitochondrial, and ER contamination. DNA was then purified from these pure cytosolic fractions using the DNA Clean and Concentrator-5 kit (ZYMO Research). qPCR was performed for both whole-cell extracts and cytosolic fractions using nuclear DNA primers (Tert) and mtDNA primers (Dloop1-3, Cytb, 16S, and ND4), and the Ct values obtained for mtDNA abundance for whole-cell extracts served as normalization controls for the mtDNA values determined from the cytosolic fractions. The primers used for the different genes are listed in Supplemental Table 4.
Statistics.
Quantitative data are presented as the mean + SEM. ANOVA with Tukey’s post test (1-way ANOVA for comparisons between groups, 2-way ANOVA for comparisons of magnitude of changes between different groups) was applied to compare values among different experimental groups using GraphPad Prism (GraphPad Software). For experiments with only 2 groups, Student’s t test was used. *P < 0.05 was considered statistically significant, **P < 0.01 was considered highly significant, and ***P < 0.001 and ****P < 0.0001 were considered extremely significant. The Kaplan-Meier estimator and log-rank (Mantel-Cox) test was used for survival analysis of tumor-bearing mice.
Study approval. All animal experiments conducted in this study were approved by the IACUC of Duke University.
Author contributions
CYL, MH, and MZ designed the study. MH, MZ, XB, DP, MJ, XL, FL, and CYL conducted experiments. MH and CYL wrote the original draft of the manuscript. MH, MZ, XB, DP, MJ, and CYL wrote, reviewed, and edited the manuscript. CYL acquired funding. FL, XB, and CYL analyzed data. MH, FL, and CYL supervised the study.
Supplementary Material
Acknowledgments
This study was supported in part by the NIH (ES024015, CA208852, and CA216876, to C-YL); the Emerson Collective (to CYL); a Guangdong Basic Research Foundation Grant (2020B1515020054, to XL); and a Shenzhen Science and Technology Program Grant (JCYJ20190807154813511, to XL). We thank Michael Cook and colleagues from the Flow Cytometry Shared Resource of the Duke Cancer Institute for their expert help in characterizing the TILs. We also thank the Duke Sequencing and Genomic Technologies Shared Resource of the Duke Cancer Institute for conducting RNA-Seq analysis for our studies.
Version 1. 12/08/2020
In-Press Preview
Version 2. 02/01/2021
Electronic publication
Footnotes
Conflict of interest: CL, MH, MZ, and FL are inventors on a related patent (“Compositions and methods for enhancing cancer immune checkpoint therapy,” PCT/US2020/024032) filed by Duke University. For more information, go to: https://www.jci.org/kiosks/authors#Author_COI).
Copyright: © 2021, American Society for Clinical Investigation.
Reference information: J Clin Invest. 2021;131(3):e139333.https://doi.org/10.1172/JCI139333.
Contributor Information
Mengjie Hu, Email: Mengjie.Hu@duke.edu.
Min Zhou, Email: zmgrace@126.com.
Xuhui Bao, Email: xuhui.bao@duke.edu.
Dong Pan, Email: dong.pan@duke.edu.
Meng Jiao, Email: meng.jiao@duke.edu.
Xinjian Liu, Email: jnulxj@163.com.
Fang Li, Email: Fang.Li@duke.edu.
Chuan-Yuan Li, Email: chuan.li@duke.edu.
References
- 1.Topalian SL, et al. Safety, activity, and immune correlates of anti-PD-1 antibody in cancer. N Engl J Med. 2012;366(26):2443–2454. doi: 10.1056/NEJMoa1200690. [DOI] [PMC free article] [PubMed] [Google Scholar]
- 2.Brahmer JR, et al. Safety and activity of anti-PD-L1 antibody in patients with advanced cancer. N Engl J Med. 2012;366(26):2455–2465. doi: 10.1056/NEJMoa1200694. [DOI] [PMC free article] [PubMed] [Google Scholar]
- 3.Hamid O, et al. Safety and tumor responses with lambrolizumab (anti-PD-1) in melanoma. N Engl J Med. 2013;369(2):134–144. doi: 10.1056/NEJMoa1305133. [DOI] [PMC free article] [PubMed] [Google Scholar]
- 4.Robert C, et al. Nivolumab in previously untreated melanoma without BRAF mutation. N Engl J Med. 2015;372(4):320–330. doi: 10.1056/NEJMoa1412082. [DOI] [PubMed] [Google Scholar]
- 5.Garon EB, et al. Pembrolizumab for the treatment of non-small-cell lung cancer. N Engl J Med. 2015;372(21):2018–28. doi: 10.1056/NEJMoa1501824. [DOI] [PubMed] [Google Scholar]
- 6.Patel SP, Kurzrock R. PD-L1 expression as a predictive biomarker in cancer immunotherapy. Mol Cancer Ther. 2015;14(4):847–856. doi: 10.1158/1535-7163.MCT-14-0983. [DOI] [PubMed] [Google Scholar]
- 7.Goodman AM, et al. Tumor mutational burden as an independent predictor of response to immunotherapy in diverse cancers. Mol Cancer Ther. 2017;16(11):2598–2608. doi: 10.1158/1535-7163.MCT-17-0386. [DOI] [PMC free article] [PubMed] [Google Scholar]
- 8.Taube JM, et al. Association of PD-1, PD-1 ligands, and other features of the tumor immune microenvironment with response to anti-PD-1 therapy. Clin Cancer Res. 2014;20(19):5064–5074. doi: 10.1158/1078-0432.CCR-13-3271. [DOI] [PMC free article] [PubMed] [Google Scholar]
- 9.Cai X, et al. The cGAS-cGAMP-STING pathway of cytosolic DNA sensing and signaling. Mol Cell. 2014;54(2):289–296. doi: 10.1016/j.molcel.2014.03.040. [DOI] [PubMed] [Google Scholar]
- 10.Li XD, et al. Pivotal roles of cGAS-cGAMP signaling in antiviral defense and immune adjuvant effects. Science. 2013;341(6152):1390–1394. doi: 10.1126/science.1244040. [DOI] [PMC free article] [PubMed] [Google Scholar]
- 11.Hou F, et al. MAVS forms functional prion-like aggregates to activate and propagate antiviral innate immune response. Cell. 2011;146(3):448–461. doi: 10.1016/j.cell.2011.06.041. [DOI] [PMC free article] [PubMed] [Google Scholar]
- 12.Wang H, et al. cGAS is essential for the antitumor effect of immune checkpoint blockade. Proc Natl Acad Sci U S A. 2017;114(7):1637–1642. doi: 10.1073/pnas.1621363114. [DOI] [PMC free article] [PubMed] [Google Scholar]
- 13.Demaria O, et al. STING activation of tumor endothelial cells initiates spontaneous and therapeutic antitumor immunity. Proc Natl Acad Sci U S A. 2015;112(50):15408–15413. doi: 10.1073/pnas.1512832112. [DOI] [PMC free article] [PubMed] [Google Scholar]
- 14.Vanpouille-Box C, et al. DNA exonuclease Trex1 regulates radiotherapy-induced tumour immunogenicity. Nat Commun. 2017;8:15618. doi: 10.1038/ncomms15618. [DOI] [PMC free article] [PubMed] [Google Scholar]
- 15.Deng L, et al. STING-dependent cytosolic DNA sensing promotes radiation-induced type I interferon-dependent antitumor immunity in immunogenic tumors. Immunity. 2014;41(5):843–852. doi: 10.1016/j.immuni.2014.10.019. [DOI] [PMC free article] [PubMed] [Google Scholar]
- 16.Chiappinelli KB, et al. Inhibiting DNA methylation causes an interferon response in cancer via dsRNA including endogenous retroviruses. Cell. 2015;162(5):974–86. doi: 10.1016/j.cell.2015.07.011. [DOI] [PMC free article] [PubMed] [Google Scholar]
- 17.Roulois D, et al. DNA-demethylating agents target colorectal cancer cells by inducing viral mimicry by endogenous transcripts. Cell. 2015;162(5):961–973. doi: 10.1016/j.cell.2015.07.056. [DOI] [PMC free article] [PubMed] [Google Scholar]
- 18.Lee AK, et al. Endogenous retrovirus activation as a key mechanism of anti-tumor immune response in radiotherapy. Radiat Res. 2020;193(4):305–317. doi: 10.1667/RADE-20-00013. [DOI] [PMC free article] [PubMed] [Google Scholar]
- 19.Corrales L, et al. Direct activation of STING in the tumor microenvironment leads to potent and systemic tumor regression and immunity. Cell Rep. 2015;11(7):1018–1030. doi: 10.1016/j.celrep.2015.04.031. [DOI] [PMC free article] [PubMed] [Google Scholar]
- 20.Ramanjulu JM, et al. Design of amidobenzimidazole STING receptor agonists with systemic activity. Nature. 2018;564(7736):439–443. doi: 10.1038/s41586-018-0705-y. [DOI] [PubMed] [Google Scholar]
- 21.Chin EN, et al. Antitumor activity of a systemic STING-activating non-nucleotide cGAMP mimetic. Science. 2020;369(6506):993–999. doi: 10.1126/science.abb4255. [DOI] [PubMed] [Google Scholar]
- 22.Gajewski TF, Higgs EF. Immunotherapy with a sting. Science. 2020;369(6506):921–922. doi: 10.1126/science.abc6622. [DOI] [PubMed] [Google Scholar]
- 23.Pan BS, et al. An orally available non-nucleotide STING agonist with antitumor activity. Science. 2020;369(6506):eaba6098. doi: 10.1126/science.aba6098. [DOI] [PubMed] [Google Scholar]
- 24.Shiloh Y. ATM and related protein kinases: safeguarding genome integrity. Nat Rev Cancer. 2003;3(3):155–168. doi: 10.1038/nrc1011. [DOI] [PubMed] [Google Scholar]
- 25.Canman CE, et al. Activation of the ATM kinase by ionizing radiation and phosphorylation of p53. Science. 1998;281(5383):1677–1679. doi: 10.1126/science.281.5383.1677. [DOI] [PubMed] [Google Scholar]
- 26.Barlow C, et al. Atm-deficient mice: a paradigm of ataxia telangiectasia. Cell. 1996;86(1):159–171. doi: 10.1016/S0092-8674(00)80086-0. [DOI] [PubMed] [Google Scholar]
- 27.Batey MA, et al. Preclinical evaluation of a novel ATM inhibitor, KU59403, in vitro and in vivo in p53 functional and dysfunctional models of human cancer. Mol Cancer Ther. 2013;12(6):959–967. doi: 10.1158/1535-7163.MCT-12-0707. [DOI] [PMC free article] [PubMed] [Google Scholar]
- 28.Durant ST, et al. The brain-penetrant clinical ATM inhibitor AZD1390 radiosensitizes and improves survival of preclinical brain tumor models. Sci Adv. 2018;4(6):eaat1719. doi: 10.1126/sciadv.aat1719. [DOI] [PMC free article] [PubMed] [Google Scholar]
- 29.Petersen AJ, et al. ATM kinase inhibition in glial cells activates the innate immune response and causes neurodegeneration in Drosophila. Proc Natl Acad Sci U S A. 2012;109(11):E656–E664. doi: 10.1073/pnas.1110470109. [DOI] [PMC free article] [PubMed] [Google Scholar]
- 30.Hartlova A, et al. DNA damage primes the type I interferon system via the cytosolic DNA sensor STING to promote anti-microbial innate immunity. Immunity. 2015;42(2):332–343. doi: 10.1016/j.immuni.2015.01.012. [DOI] [PubMed] [Google Scholar]
- 31.Zhang Q, et al. Inhibition of ATM increases interferon signaling and sensitizes pancreatic cancer to immune checkpoint blockade therapy. Cancer Res. 2019;79(15):3940–3951. doi: 10.1158/0008-5472.CAN-19-0761. [DOI] [PMC free article] [PubMed] [Google Scholar]
- 32.Cong L, et al. Multiplex genome engineering using CRISPR/Cas systems. Science. 2013;339(6121):819–823. doi: 10.1126/science.1231143. [DOI] [PMC free article] [PubMed] [Google Scholar]
- 33.Chou TC. Drug combination studies and their synergy quantification using the Chou-Talalay method. Cancer Res. 2010;70(2):440–446. doi: 10.1158/0008-5472.CAN-09-1947. [DOI] [PubMed] [Google Scholar]
- 34.Chen Q, et al. Regulation and function of the cGAS-STING pathway of cytosolic DNA sensing. Nat Immunol. 2016;17(10):1142–1149. doi: 10.1038/ni.3558. [DOI] [PubMed] [Google Scholar]
- 35.Sun L, et al. Cyclic GMP-AMP synthase is a cytosolic DNA sensor that activates the type I interferon pathway. Science. 2013;339(6121):786–791. doi: 10.1126/science.1232458. [DOI] [PMC free article] [PubMed] [Google Scholar]
- 36.Wu J, et al. Cyclic GMP-AMP is an endogenous second messenger in innate immune signaling by cytosolic DNA. Science. 2013;339(6121):826–830. doi: 10.1126/science.1229963. [DOI] [PMC free article] [PubMed] [Google Scholar]
- 37.White MJ, et al. Apoptotic caspases suppress mtDNA-induced STING-mediated type I IFN production. Cell. 2014;159(7):1549–1562. doi: 10.1016/j.cell.2014.11.036. [DOI] [PMC free article] [PubMed] [Google Scholar]
- 38.Alam TI, et al. Human mitochondrial DNA is packaged with TFAM. Nucleic Acids Res. 2003;31(6):1640–1645. doi: 10.1093/nar/gkg251. [DOI] [PMC free article] [PubMed] [Google Scholar]
- 39.Ekstrand MI, et al. Mitochondrial transcription factor A regulates mtDNA copy number in mammals. Hum Mol Genet. 2004;13(9):935–944. doi: 10.1093/hmg/ddh109. [DOI] [PubMed] [Google Scholar]
- 40.West AP, et al. Mitochondrial DNA stress primes the antiviral innate immune response. Nature. 2015;520(7548):553–557. doi: 10.1038/nature14156. [DOI] [PMC free article] [PubMed] [Google Scholar]
- 41.Kawai T, et al. IPS-1, an adaptor triggering RIG-I- and Mda5-mediated type I interferon induction. Nat Immunol. 2005;6(10):981–988. doi: 10.1038/ni1243. [DOI] [PubMed] [Google Scholar]
- 42.Samstein RM, et al. Tumor mutational load predicts survival after immunotherapy across multiple cancer types. Nat Genet. 2019;51(2):202–206. doi: 10.1038/s41588-018-0312-8. [DOI] [PMC free article] [PubMed] [Google Scholar]
- 43.Zehir A, et al. Mutational landscape of metastatic cancer revealed from prospective clinical sequencing of 10,000 patients. Nat Med. 2017;23(6):703–713. doi: 10.1038/nm.4333. [DOI] [PMC free article] [PubMed] [Google Scholar]
- 44.Ambrose M, et al. Intrinsic mitochondrial dysfunction in ATM-deficient lymphoblastoid cells. Hum Mol Genet. 2007;16(18):2154–2164. doi: 10.1093/hmg/ddm166. [DOI] [PubMed] [Google Scholar]
- 45.Fang EF, et al. NAD+ Replenishment improves lifespan and healthspan in ataxia telangiectasia models via mitophagy and DNA repair. Cell Metab. 2016;24(4):566–581. doi: 10.1016/j.cmet.2016.09.004. [DOI] [PMC free article] [PubMed] [Google Scholar]
- 46.Valentin-Vega YA, et al. Mitochondrial dysfunction in ataxia-telangiectasia. Blood. 2012;119(6):1490–1500. doi: 10.1182/blood-2011-08-373639. [DOI] [PMC free article] [PubMed] [Google Scholar]
- 47.Eaton JS, et al. Ataxia-telangiectasia mutated kinase regulates ribonucleotide reductase and mitochondrial homeostasis. J Clin Invest. 2007;117(9):2723–2734. doi: 10.1172/JCI31604. [DOI] [PMC free article] [PubMed] [Google Scholar]
- 48.Sharma NK, et al. Intrinsic mitochondrial DNA repair defects in Ataxia telangiectasia. DNA Repair (Amst) 2014;13:22–31. doi: 10.1016/j.dnarep.2013.11.002. [DOI] [PMC free article] [PubMed] [Google Scholar]
- 49.Zhang R, Wang J. HuR stabilizes TFAM mRNA in an ATM/p38-dependent manner in ionizing irradiated cancer cells. Cancer Sci. 2018;109(8):2446–2457. doi: 10.1111/cas.13657. [DOI] [PMC free article] [PubMed] [Google Scholar]
- 50.Dietel M, et al. Real-world prevalence of programmed death ligand 1 expression in locally advanced or metastatic non-small-cell lung cancer: The global, multicenter EXPRESS study. Lung Cancer. 2019;134:174–179. doi: 10.1016/j.lungcan.2019.06.012. [DOI] [PubMed] [Google Scholar]
- 51.Bonneville R, et al. Landscape of microsatellite instability across 39 cancer types. JCO Precis Oncol. 2017 doi: 10.1200/PO.17.00073. [DOI] [PMC free article] [PubMed] [Google Scholar]
- 52.Meerbrey KL, et al. The pINDUCER lentiviral toolkit for inducible RNA interference in vitro and in vivo. Proc Natl Acad Sci U S A. 2011;108(9):3665–3670. doi: 10.1073/pnas.1019736108. [DOI] [PMC free article] [PubMed] [Google Scholar]
- 53.Legros F, et al. Organization and dynamics of human mitochondrial DNA. J Cell Sci. 2004;117(Pt 13):2653–2662. doi: 10.1242/jcs.01134. [DOI] [PubMed] [Google Scholar]
- 54.Wang YE, et al. Genome-wide analysis reveals coating of the mitochondrial genome by TFAM. PLoS One. 2013;8(8):e74513. doi: 10.1371/journal.pone.0074513. [DOI] [PMC free article] [PubMed] [Google Scholar]
- 55.Lee HM, et al. Sustained hypoxia modulates mitochondrial DNA content in the neonatal rat brain. Free Radic Biol Med. 2008;44(5):807–14. doi: 10.1016/j.freeradbiomed.2007.11.005. [DOI] [PMC free article] [PubMed] [Google Scholar]
- 56. Babraham Bioinformatics. TrimGalore. http://www.bioinfomatics.babraham.ac.uk/projects/trim_galore Accessed December 2, 2020.
- 57.Martin M. Cutadapt removes adapter sequences from high-throughput sequencing reads. EMBnet Journal. 2011;17:10–2. doi: 10.14806/ej.17.1.200. [DOI] [Google Scholar]
- 58.Frankish A, et al. GENCODE reference annotation for the human and mouse genomes. Nucleic Acids Res. 2019;47(D1):D766–D773. doi: 10.1093/nar/gky955. [DOI] [PMC free article] [PubMed] [Google Scholar]
- 59.Dobin A, et al. STAR: ultrafast universal RNA-seq aligner. Bioinformatics. 2013;29(1):15–21. doi: 10.1093/bioinformatics/bts635. [DOI] [PMC free article] [PubMed] [Google Scholar]
- 60.Li H, et al. The Sequence alignment/map format and SAMtools. Bioinformatics. 2009;25(16):2078–2079. doi: 10.1093/bioinformatics/btp352. [DOI] [PMC free article] [PubMed] [Google Scholar]
- 61.Love MI, et al. Moderated estimation of fold change and dispersion for RNA-seq data with DESeq2. Genome Biol. 2014;15(12):550. doi: 10.1186/s13059-014-0550-8. [DOI] [PMC free article] [PubMed] [Google Scholar]
- 62.Mootha VK, et al. PGC-1alpha-responsive genes involved in oxidative phosphorylation are coordinately downregulated in human diabetes. Nat Genet. 2003;34(3):267–273. doi: 10.1038/ng1180. [DOI] [PubMed] [Google Scholar]
- 63.Huang SY, et al. TDP1 repairs nuclear and mitochondrial DNA damage induced by chain-terminating anticancer and antiviral nucleoside analogs. Nucleic Acids Res. 2013;41(16):7793–7803. doi: 10.1093/nar/gkt483. [DOI] [PMC free article] [PubMed] [Google Scholar]
Associated Data
This section collects any data citations, data availability statements, or supplementary materials included in this article.


