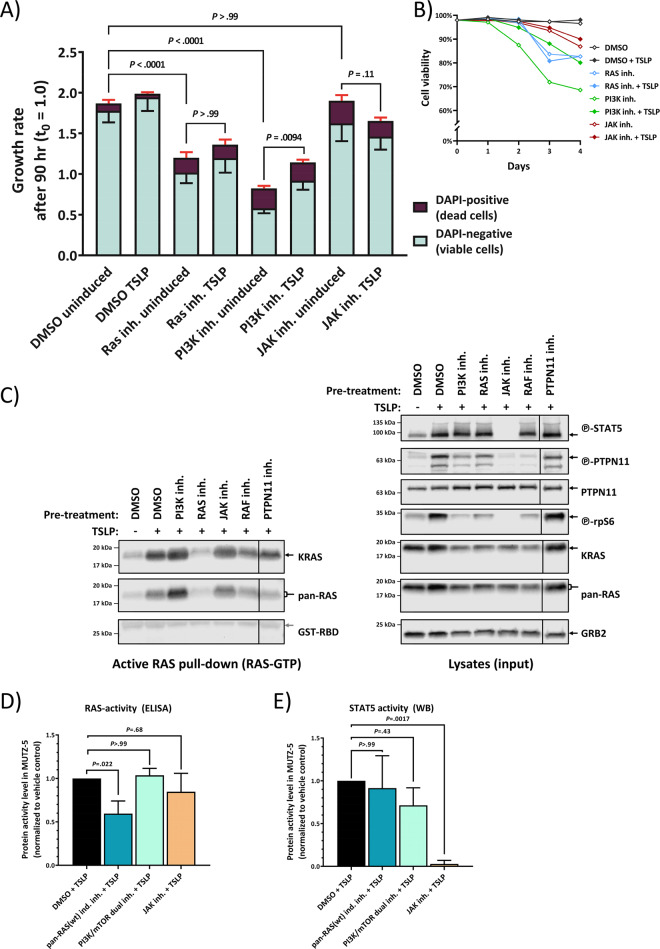
Fig. 3. Inhibition of RAS stops wt-RAS Philadelphia-like ALL cell growth in the presence of TSLP.
a MUTZ-5 cells were seeded at 6.5 × 10⁵/mL density and cultured over 4 days with either 0.5% DMSO (vehicle control), 50 µM Salirasib (indirect Pan-RAS inh.), 10 µM PI-103 (PI3K/mTOR dual inh.), or 5 µM Ruxolitinib (JAK inh.), each in absence or presence of 20 ng/mL human TSLP. Cell count and viability was determined in an NC-250 automated cell counter daily. The stacked-bar graph on the left side shows the growth rate after the 90 h timepoint, averaged from two independent experiments, each with triplicate wells. Red error bars are SD from the dead cell fraction while the black error bars show the SD of the viable cells. P values were calculated in one-way ANOVA from the total cell growth rate and adjusted in a post-hoc Bonferroni multiple comparison. Only relevant P values are shown in the graph, for a complete list see Supplementary Table S2. b The graph shows the cell viability of the experiment in a over time. c MUTZ-5 cells were pre-treated for 2 h with either 0.5% DMSO (vehicle control), 10 µM PI-103 (PI3K/mTOR dual inh.), 50 µM Salirasib (indirect pan-RAS inh.), 5 µM Ruxolitinib (JAK inh.), 50 µM Vemurafenib (Pan-Raf inh.), or 25 µM II-B08 (PTPN11 inh.), and then stimulated with 20 ng/mL human TSLP for 10 min followed by cell lysis. Each lysate sample was split up for analysis in RAS-GTP pull-down assay and for total protein signal. RAS-GTP pull-down (left) and lysate samples (right) were loaded on separate gels. An SDS-PAGE followed by WB was performed. To assess the total protein and phosphorylated protein amounts on the same PVDF-membrane, membranes were stripped and reprobed with new antibodies. Antibody-targets are labeled on the right side of each image with black arrows indicating the respective protein band. d MUTZ-5 cells were treated with 50 µM Salirasib (pan-RAS-inhibitor), 10 µM PI-103 (PI3K/mTOR dual inhibitor), or 5 µM Ruxolitinib (JAK-inhibitor) like in c after which the RAS-GTP levels were measured in ELISA. N = 3 independent experiments, bar graph shows means ± SD. e MUTZ-5 cells were treated as in d and STAT5 activity was determined via Western blot. N = 3 independent experiments, bar graph shows means ± SD. P values for d and e were calculated in one-way ANOVA and post-hoc Bonferroni multiple comparison.

