Abstract
Background
Non-obstructive azoospermia (NOA) is a disease related to spermatogenic disorders. Currently, the specific etiological mechanism of NOA is unclear. This study aimed to use integrated bioinformatics to screen biomarkers and pathways involved in NOA and reveal their potential molecular mechanisms.
Methods
GSE145467 and GSE108886 gene expression profiles were obtained from the Gene Expression Omnibus (GEO) database. The differentially expressed genes (DEGs) between NOA tissues and matched obstructive azoospermia (OA) tissues were identified using the GEO2R tool. Common DEGs in the two datasets were screened out by the VennDiagram package. For the functional annotation of common DEGs, DAVID v.6.8 was used to perform Gene Ontology (GO) and the Kyoto Encyclopedia of Genes and Genomes (KEGG) pathway enrichment analysis. In accordance with data collected from the Search Tool for the Retrieval of Interacting Genes/Proteins (STRING) database, a protein–protein interaction (PPI) network was constructed by Cytoscape. Cytohubba in Cytoscape was used to screen the hub genes. Furthermore, the hub genes were validated based on a separate dataset, GSE9210. Finally, potential micro RNAs (miRNAs) of hub genes were predicted by miRWalk 3.0.
Results
A total of 816 common DEGs, including 52 common upregulated and 764 common downregulated genes in two datasets, were screened out. Some of the more important of these pathways, including focal adhesion, PI3K-Akt signaling pathway, cell cycle, oocyte meiosis, AMP-activated protein kinase (AMPK) signaling pathway, FoxO signaling pathway, and Huntington disease, were involved in spermatogenesis. We further identified the top 20 hub genes from the PPI network, including CCNB2, DYNLL2, HMMR, NEK2, KIF15, DLGAP5, NUF2, TTK, PLK4, PTTG1, PBK, CEP55, CDKN3, CDC25C, MCM4, DNAI1, TYMS, PPP2R1B, DNAI2, and DYNLRB2, which were all downregulated genes. In addition, potential miRNAs of hub genes, including hsa-miR-3666, hsa-miR-130b-3p, hsa-miR-15b-5p, hsa-miR-6838-5p, and hsa-miR-195-5p, were screened out.
Conclusions
Taken together, the identification of the above hub genes, miRNAs and pathways will help us better understand the mechanisms associated with NOA, and provide potential biomarkers and therapeutic targets for NOA.
Keywords: Non-obstructive azoospermia (NOA), expression profiling data, functional enrichment analysis, protein–protein interactions, biomarkers
Introduction
Infertility is defined as the inability to conceive within 1 year of unprotected intercourse (1). Studies have shown that about 10–15% of couples have fertility problems, and male factors are responsible for 50% of infertility cases (2,3). The causes of male infertility are complex. Azoospermia, which causes 10–20% of male infertility cases (4), is a type of male infertility in which sperm is absent. Types of azoospermia include obstructive azoospermia (OA) and non-obstructive azoospermia (NOA) (5,6). OA is mainly caused by obstruction of the posterior reproductive tract of the testis, while NOA is caused by the dysfunction of spermatogenesis. NOA is the most severe form of male infertility, with an incidence rate of 10% (7).
Human spermatogenesis essentially occurs in three stages: spermatogenic mitosis, spermatogenic meiosis, and spermatogenesis (8). Problems at any of these stages can cause sperm production to fail. While it is possible to obtain sperm of through testicular aspiration or testicular sperm extraction via microdissection, this is not feasible for the vast majority of NOA patients (9). Furthermore, the primary mechanism regulating spermatogenesis in NOA patients remains unclear (10).
In the present study, we downloaded the expression profile datasets, GSE145467 and GSE108886, from the Gene Expression Omnibus (GEO) database. We then screened out common differentially expressed genes (DEGs) using combined GEO2R and VennDiagram package analyses. We performed Gene Ontology (GO) annotation and Kyoto Encyclopedia of Genes and Genomes (KEGG) pathway enrichment analyses of common DEGs. The protein–protein interaction (PPI) network was constructed by Cytoscape, and the hub genes were obtained using the Cytohubba plug-in of Cytoscape. In addition, potential micro RNAs (miRNAs) of hub genes were predicted by miRWalk 3.0. It is hoped the results of this study can provide insights into the molecular mechanism of NOA and identify potential biomarkers and therapeutic targets. We present our findings in accordance with the STROBE and MDAR reporting checklists (available at http://dx.doi.org/10.21037/tau-20-1029).
Methods
Microarray data source
As all the data in this study were from the GEO public database (https://www.ncbi.nlm.nih.gov/geo/), the approval of the local ethics committee was not required.
We used the keywords “non-obstructive azoospermia” and “expression profiling by array” and “Homo sapiens” in the GEO database (https://www.ncbi.nlm.nih.gov/geo/) to search the mRNA expression dataset of NOA. Through retrieval, we downloaded the GSE145467 and GSE108886 expression profile datasets. The GSE145467 dataset, which was contributed by Hodžić et al. (11), is based on the GPL4133 platform of the Agilent-014850 Whole Human Genome Microarray 4x44K G4112F (Feature Number version) and includes 10 NOA samples and 10 OA testicular samples. The GSE108886 dataset, which was contributed by Baksi et al., is based on the GPL10558 platform of the Illumina HumanHT-12 V4.0 expression beadchip which contains eight NOA samples and four OA samples (including one testicular control sample).
Screening for DEGs
The GEO2R tool (https://www.ncbi.nlm.nih.gov/geo/geo2r/) was used to screen DEGs in NOA tissues compared with matched OA tissues. The t-test and Benjamini–Hochberg method were used to calculate the P value and false discovery rate (FDR), respectively. The DEGs were screened out according to FDR <0.05 and |FC| ≥2.5. The common DEGs in the two datasets were screened out by the VennDiagram package.
GO and KEGG enrichment analysis
GO functional and KEGG pathway enrichment analysis was conducted to determine the functions of common DEGs using the Database for Annotation Visualization and Integrated Discovery (DAVID; https://david.ncifcrf.gov/). The results of GO and KEGG pathway enrichment analyses were downloaded as a TXT file for subsequent analysis. The results were visualized using R software version 3.6.2. A P value <0.05 was set to represent a statistically significant difference.
PPI network and hub gene identification
The Search Tool for the Retrieval of Interacting Genes database (STRING; https://string-db.org/cgi/input.pl) is an online tool for analyzing the PPI information. We constructed a PPI network of common DEGs using the STRING based on a minimum required interaction score of 0.7. We then used Cytoscape software v3.7.1 (https://cytoscape.org/) to visualize the PPI network derived from the STRING database. Using the cytoHubba plugin in Cytoscape, the nodes in the PPI network were ranked according to the degree calculation method (12) with the top 20 genes being considered the hub genes. GO and KEGG pathway analyses for the hub genes were performed using the WebGestalt (http://www.webgestalt.org/). A P value <0.05 was considered a statistically significant difference.
Analysis of hub genes in the NOA subgroup
The NOA samples in the GSE108886 dataset were analyzed according to its two subgroups: the non-obstructive azoospermia with meiotic arrest (NOA-MA) subgroup contains five samples, and the non-obstructive azoospermia with pre-meiotic arrest (NOA-PreMA) subgroup contains three samples. The Wilcox test was used to determine whether there were differences in the expression of hub genes between the two subgroups. A P value <0.05 was considered statistically significant.
Validation of the hub genes
To further verify the differential expression of hub genes, we downloaded the GSE9210 dataset, which contains 47 NOA samples and 11 OA samples. The expression levels of genes in this dataset have been processed by lowess-normalized natural log [Cy5/Cy3] (13). The Wilcox test was used to compare the differential expression of hub genes between the NOA and OA samples in the GSE9210 dataset. A P value <0.05 was considered a statistically significant difference.
Screening to regulate hub genes
Twenty hub genes associated with NOA were imported into the miRWalk 3.0 software (http://mirwalk.umm.uni-heidelberg.de/) to screen for the miRNAs that regulate target genes. The miRWalk 3.0 software integrated the prediction results of TargetScan, and a score >0.8 was used as the cutoff criterion. Following this, a miRNA-gene regulatory network was constructed and visualized by Cytoscape. Moreover, miRNAs which targeted more than two genes were selected.
Statistical analysis
We performed R software version 3.6.2 for statistical analysis. The Wilcox test was used to compare the two groups. A P value <0.05 was considered a statistically significant difference.
Results
Identification of DEGs in NOA
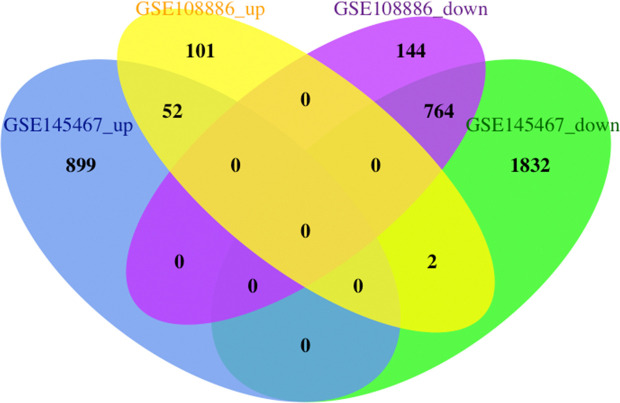
For the GSE145467 dataset, 3,549 DEGs were identified, including 951 upregulated and 2,598 downregulated genes. For the GSE108886 dataset, 1,063 DEGs were identified, including 155 upregulated and 908 downregulated genes. VennDiagram analysis was performed to determine the intersection of the two datasets of DEGs. A total of 816 common DEGs were identified, including 52 common upregulated and 764 common downregulated genes (Figure 1 and Table S1).
Figure 1.
Identification of 816 (52 upregulated and 764 downregulated) common differentially expression genes (DEGs) from GSE145467 and GSE108886 microarray profile datasets. The FDR <0.05 and |FC| ≥2.5 as the cut-off criterion. FDR, false discovery rate; FC, fold change.
GO enrichment analysis
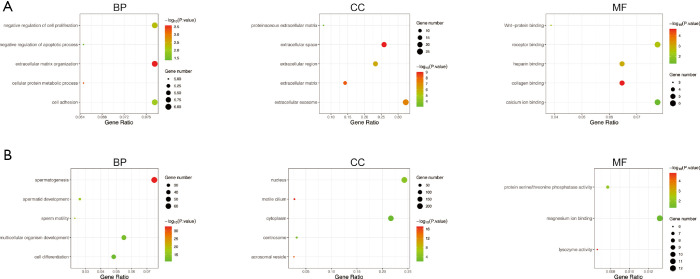
GO enrichment analysis of the common DEGs included the following three parts: biological process (BP), molecular function (MF), and cell component (CC). We imported the common DEGs into the DAVID online analysis tool for GO enrichment analysis. This showed that for BP, common upregulated DEGs were significantly associated with extracellular matrix (ECM) organization, negative regulation of cell proliferation and apoptotic process, cell adhesion, and cellular protein metabolic process. Common downregulated DEGs were significantly associated with spermatogenesis, multicellular organism development, cell differentiation, spermatid development, and sperm motility. Common upregulated DEGs that were significantly associated with CC included extracellular exosome, extracellular space, extracellular region, ECM, and proteinaceous ECM. Common downregulated DEGs that were significantly associated with CC included nucleus, cytoplasm, centrosome, motile cilium, and acrosomal vesicle. GO MF showed that common upregulated DEGs were significantly associated with receptor binding, calcium ion binding, collagen binding, heparin binding, and Wnt-protein binding. Common downregulated DEGs were significantly associated with protein serine/threonine kinase activity, magnesium ion binding, protein serine/threonine phosphatase activity, lysozyme activity, and microtubule motor activity. These results are shown in Figure 2 and Table 1.
Figure 2.
Gene ontology analysis of the common DEGs. (A) Common upregulated DEGs. (B) Common downregulated DEGs. BP, biological process; CC, cellular component; MF, molecular function; DEGs, differentially expressed genes.
Table 1. Gene ontology analysis of common upregulated and downregulated DEGs.
| Category | Term | Count | Gene ratio | P value |
|---|---|---|---|---|
| Upregulated | ||||
| BP | GO:0030198~extracellular matrix organization | 6 | 0.0775294 | 2.59E-04 |
| BP | GO:0008285~negative regulation of cell proliferation | 6 | 0.0775294 | 0.005787 |
| BP | GO:0007155~cell adhesion | 6 | 0.0775294 | 0.0105986 |
| BP | GO:0044267~cellular protein metabolic process | 5 | 0.0646078 | 3.85E-04 |
| BP | GO:0043066~negative regulation of apoptotic process | 5 | 0.0646078 | 0.04328502 |
| CC | GO:0070062~extracellular exosome | 25 | 0.3230392 | 5.98E-08 |
| CC | GO:0005615~extracellular space | 20 | 0.2584313 | 9.39E-10 |
| CC | GO:0005576~extracellular region | 18 | 0.2325882 | 6.52E-07 |
| CC | GO:0031012~extracellular matrix | 11 | 0.1421372 | 6.35E-09 |
| CC | GO:0005578~proteinaceous extracellular matrix | 6 | 0.0775294 | 8.18E-04 |
| MF | GO:0005102~receptor binding | 6 | 0.0775294 | 0.00290085 |
| MF | GO:0005509~calcium ion binding | 6 | 0.0775294 | 0.04816598 |
| MF | GO:0005518~collagen binding | 5 | 0.0646078 | 2.29E-05 |
| MF | GO:0008201~heparin binding | 5 | 0.0646078 | 0.00100954 |
| MF | GO:0017147~Wnt-protein binding | 3 | 0.0387647 | 0.00335112 |
| Downregulated | ||||
| BP | GO:0007283~spermatogenesis | 68 | 0.0747565 | 1.86E-33 |
| BP | GO:0007275~multicellular organism development | 50 | 0.054968 | 2.82E-13 |
| BP | GO:0030154~cell differentiation | 44 | 0.0483718 | 1.24E-11 |
| BP | GO:0007286~spermatid development | 24 | 0.0263846 | 1.21E-17 |
| BP | GO:0030317~sperm motility | 21 | 0.0230866 | 1.32E-17 |
| CC | GO:0005634~nucleus | 221 | 0.2429586 | 3.59E-05 |
| CC | GO:0005737~cytoplasm | 197 | 0.216574 | 0.00769222 |
| CC | GO:0005813~centrosome | 29 | 0.0318814 | 3.33E-04 |
| CC | GO:0031514~motile cilium | 25 | 0.027484 | 8.08E-18 |
| CC | GO:0001669~acrosomal vesicle | 24 | 0.0263846 | 8.40E-16 |
| MF | GO:0000287~magnesium ion binding | 12 | 0.0131923 | 0.0461689 |
| MF | GO:0004722~protein serine/threonine phosphatase activity | 7 | 0.0076955 | 0.00798661 |
| MF | GO:0003796~lysozyme activity | 6 | 0.0065962 | 1.66E-05 |
| MF | GO:0004674~protein serine/threonine kinase activity | 18 | 0.0197885 | 0.06625263 |
| MF | GO:0003777~microtubule motor activity | 6 | 0.0065962 | 0.09501651 |
GO, gene ontology; DEGs, differentially expressed genes; BP, biological process; CC, cellular component; MF, molecular function; Count, number of DEGs.
KEGG pathway enrichment analysis
The KEGG pathway of the common upregulated and downregulated DEGs was analyzed by the DAVID database. The common upregulated DEGs were mainly involved in focal adhesion, PI3K-Akt signaling pathway, glioma, ECM-receptor interaction, and protein digestion and absorption. The common downregulated DEGs were mainly involved in oocyte meiosis, glycolysis/gluconeogenesis, cell cycle, progesterone-mediated oocyte maturation, AMP-activated protein kinase (AMPK) signaling pathway, glucagon signaling pathway, metabolic pathways, protein processing in the endoplasmic reticulum, the and biosynthesis of amino acids. These results are shown in Figure 3 and Table 2.
Figure 3.
KEGG pathway enrichment analysis of the common DEGs. (A) Common upregulated DEGs. (B) Common downregulated DEGs. KEGG, Kyoto Encyclopedia of Genes and Genomes; DEGs, differentially expression genes.
Table 2. KEGG pathway analysis of common upregulated and downregulated DEGs.
| Pathway | ID | Count | Fold Enrichment | P value | Genes |
|---|---|---|---|---|---|
| Upregulated | |||||
| Focal adhesion | hsa04510 | 6 | 7.155686546 | 1.08E-03 | LAMA2, COL6A3, PDGFRA, IGF1, COL6A1, SHC1 |
| PI3K-Akt signaling pathway | hsa04151 | 6 | 4.272670807 | 9.99E-03 | LAMA2, COL6A3, PDGFRA, IGF1, COL6A1, GNG11 |
| Glioma | hsa05214 | 3 | 11.33901099 | 2.65E-02 | PDGFRA, IGF1, SHC1 |
| ECM-receptor interaction | hsa04512 | 3 | 8.471674877 | 4.52E-02 | LAMA2, COL6A3, COL6A1 |
| Protein digestion and absorption | hsa04974 | 3 | 8.375405844 | 4.62E-02 | COL6A3, CPA3, COL6A1 |
| Downregulated | |||||
| Oocyte meiosis | hsa04114 | 9 | 4.323695789 | 1.02E-03 | PPP2R1B, PGR, PLCZ1, SPDYA, MAPK1, CCNB2, PPP3R2, PTTG1, CDC25C |
| Glycolysis/gluconeogenesis | hsa00010 | 7 | 5.5713294 | 1.46E-03 | GAPDHS, LDHC, LDHAL6B, PFKP, PGAM2, PDHA2, PGK2 |
| Cell cycle | hsa04110 | 8 | 3.44036009 | 8.15E-03 | CCNB2, CDC14A, DBF4, TTK, PTTG1, CCNA1, CDC25C, MCM4 |
| Progesterone-mediated oocyte maturation | hsa04914 | 6 | 3.677626303 | 2.26E-02 | PGR, SPDYA, MAPK1, CCNB2, CCNA1, CDC25C |
| AMPK signaling pathway | hsa04152 | 7 | 3.034789185 | 2.68E-02 | PPP2R1B, CPT1B, CAB39L, PFKP, CCNA1, PPP2R2B, PPP2R3C |
| Glucagon signaling pathway | hsa04922 | 6 | 3.231853418 | 3.68E-02 | LDHC, CPT1B, LDHAL6B, PPP3R2, PGAM2, PDHA2 |
| Metabolic pathways | hsa01100 | 32 | 1.399851193 | 3.76E-02 | INPP1, LDHC, PLCZ1, KYNU, GCNT3, SGMS2, GK2, OLAH, COX7B2, NT5C1B, ACSBG2, PGAM2, TKTL2, CERS3, AZIN2, STT3B, ALDH1A2, TYMS, GALNTL5, PHOSPHO2, PDHA2, COX6B2, PRPS1L1, PCYT2, SPAM1, ADSSL1, LDHAL6B, SI, PFKP, GAPDHS, INPP4B, PGK2 |
| Protein processing in endoplasmic reticulum | hsa04141 | 8 | 2.524287877 | 3.78E-02 | HSPA1L, NGLY1, STT3B, DNAJC5B, UBQLNL, HSPA4L, UBQLN3, DNAJC5G |
| Biosynthesis of amino acids | hsa01230 | 5 | 3.703165375 | 4.46E-02 | PFKP, PGAM2, TKTL2, PRPS1L1, PGK2 |
KEGG, Kyoto Encyclopedia of Genes and Genomes; DEGs, differentially expressed genes; Count, number of DEGs.
PPI network and hub gene analysis
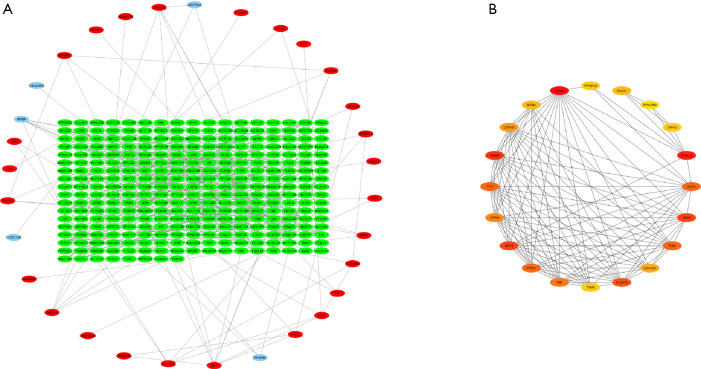
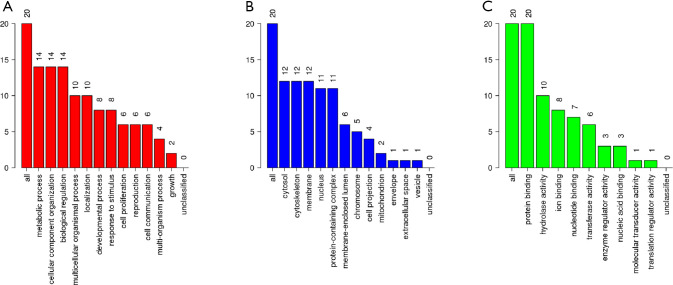
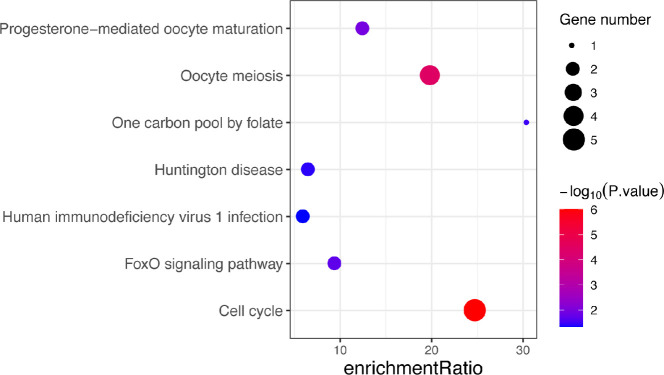
According to the STRING database, the PPI network of DEGs was constructed, with 328 nodes and 604 edges being mapped as presented in Figure 4A. The top 20 hub genes were evaluated using the Degree algorithm of the Cytohubba plug-in, as shown in Figure 4B and Table 3. GO and KEGG enrichment analyses of the 20 hub genes were performed using WebGestalt. As shown in Figure 5, the GO enrichment analysis was mainly involved in metabolic process, cellular component organization, biological regulation, cytosol, cytoskeleton, membrane, and protein binding. KEGG pathway enrichment analysis was mainly involved in cell cycle, oocyte meiosis, progesterone-mediated oocyte maturation, FoxO signaling pathway, one carbon pool by folate, and Huntington disease (Figure 6).
Figure 4.
PPI network analysis and hub genes in the protein–protein interaction network. (A) The PPI network for common DEGs. Red circle denotes common upregulated genes; green circle denotes common downregulated genes. (B) The top 20 hub genes in Degree score from the cytoHubba. Redder color indicates higher degree. PPI, protein–protein interaction; DEGs, differentially expressed genes.
Table 3. Degree values and descriptions of the top 20 hub genes.
| Rank | Gene symbol | Gene description | Degree |
|---|---|---|---|
| 1 | CCNB2 | Cyclin B2 | 25 |
| 2 | DYNLL2 | Dynein light chain LC8-type 2 | 22 |
| 3 | HMMR | Hyaluronan mediated motility receptor | 21 |
| 4 | KIF15 | Kinesin family member 15 | 20 |
| 4 | NEK2 | NIMA related kinase 2 | 20 |
| 6 | DLGAP5 | DLG associated protein 5 | 19 |
| 7 | PTTG1 | Pituitary tumor-transforming 1 | 18 |
| 7 | PLK4 | Polo like kinase 4 | 18 |
| 7 | TTK | TTK protein kinase | 18 |
| 7 | NUF2 | NUF2, NDC80 kinetochore complex component | 18 |
| 11 | PBK | PDZ binding kinase | 17 |
| 12 | CEP55 | Centrosomal protein 55 | 16 |
| 13 | CDKN3 | Cyclin dependent kinase inhibitor 3 | 15 |
| 14 | CDC25C | Cell division cycle 25C | 14 |
| 15 | DNAI1 | Dynein axonemal intermediate chain 1 | 13 |
| 15 | MCM4 | Minichromosome maintenance complex component 4 | 13 |
| 17 | DNAI2 | Dynein axonemal intermediate chain 2 | 12 |
| 17 | PPP2R1B | Protein phosphatase 2 scaffold subunit Abeta | 12 |
| 17 | TYMS | Thymidylate synthetase | 12 |
| 20 | DYNLRB2 | Dynein light chain roadblock-type 2 | 11 |
Figure 5.
GO map of 20 hub genes. (A) Biological process categories. (B) Cellular component categories. (C) Molecular function categories. GO, Gene ontology.
Figure 6.
KEGG pathway analysis of 20 hub genes. KEGG, Kyoto Encyclopedia of Genes and Genomes.
Analysis of hub genes in the NOA subgroup
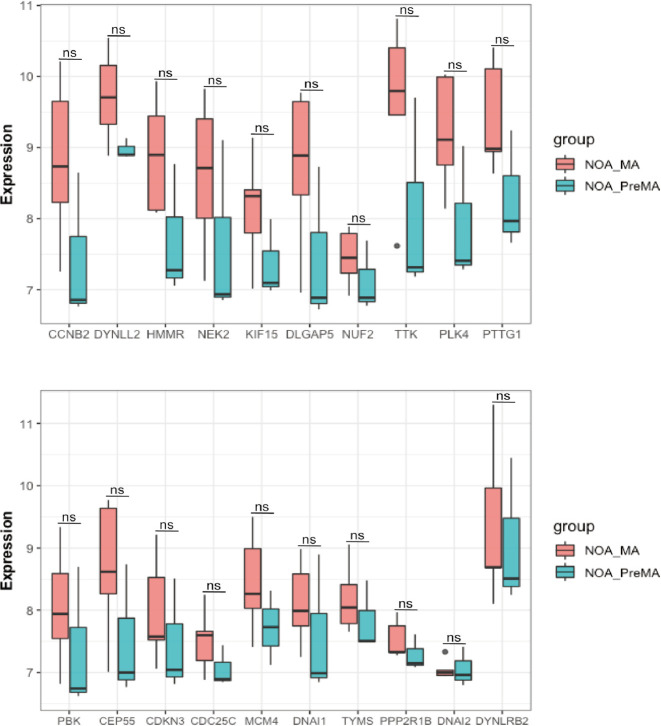
There was no statistically significant difference in the expression of the 20 hub genes between the NOA-MA and NOA-PreMA subgroups of the GSE108886 dataset (Figure 7).
Figure 7.
The differential expression level of 20 hub genes between NOA-MA and NOA-PreMA subgroups of NOA in GSE108886 dataset (*, P<0.05). NOA-MA, non-obstructive azoospermia with meiotic arrest; NOA-PreMA, non-obstructive azoospermia with pre-meiotic arrest.
Validation of the hub genes
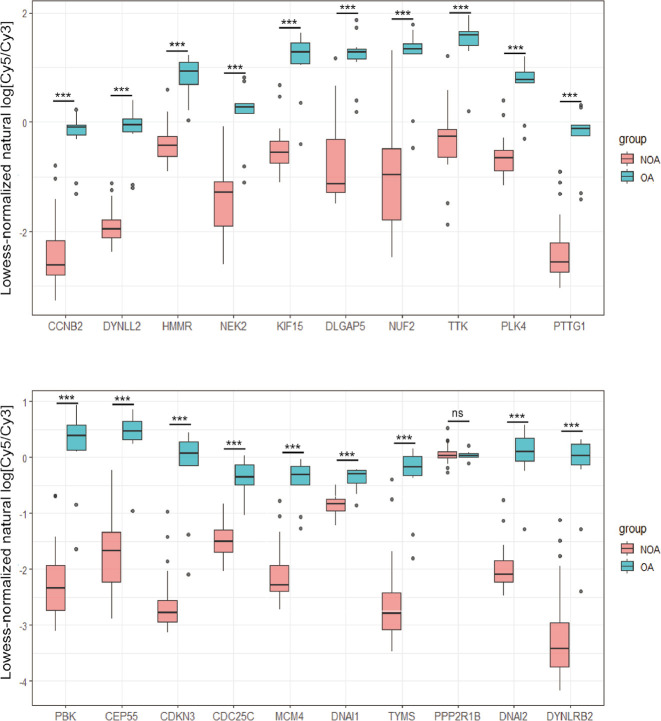
With the exception of PPP2R1B, 19 of the 20 hub genes showed lower expression in the NOA samples of GSE9210 as compared to the OA samples, which was consistent with the GSE145467 and GSE108886 datasets (Figure 8).
Figure 8.
The differential expression level of 20 hub genes between NOA and OA groups in GSE9210 dataset. (*, P<0.05, **, P<0.01, ***, P<0.001). NOA, non-obstructive azoospermia; OA, obstructive azoospermia.
Integrated network analysis of miRNA–mRNA interactions
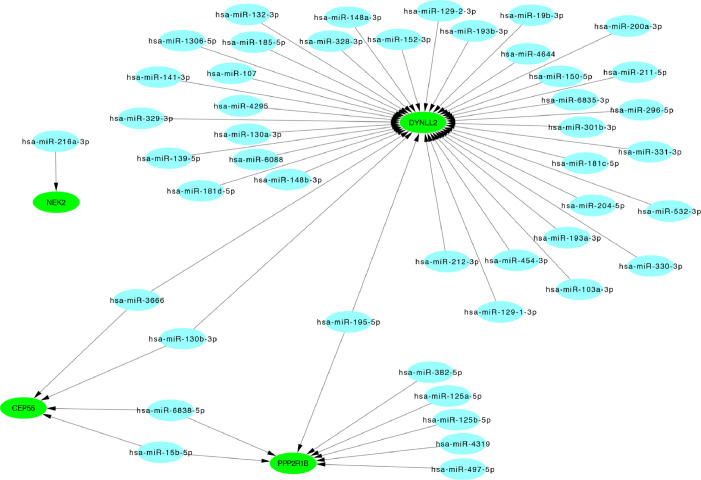
The 20 hub genes were submitted to the online tool, miRwalk 3.0. Based on the identified miRNA–mRNA pairs, we compared the interaction network containing 51 miRNA–mRNA pairs and visualized them with Cytoscape. Our analysis showed that hsa-miR-3666 and hsa-miR-130b-3p downregulated CEP55 and DYNLL2; hsa-miR-15b-5p and hsa-miR-6838-5p downregulated CEP55 and PPP2R1B; and hsa-miR-195-5p downregulated PPP2R1B and DYNLL2. The miRNA-gene regulatory network is shown in Figure 9 and Table 4.
Figure 9.
The miRNA-gene regulated network, green color: down- regulated hub genes, blue color: miRNAs.
Table 4. Hub genes and corresponded target miRNAs.
| Gene | miRNA |
|---|---|
| NEK2 | hsa-miR-216a-3p |
| CEP55 | hsa-miR-130b-3p hsa-miR-6838-5p hsa-miR-3666 hsa-miR-15b-5p |
| PPP2R1B | hsa-miR-382-5p hsa-miR-497-5p hsa-miR-125a-5p hsa-miR-6838-5p hsa-miR-15b-5p hsa-miR-195-5p hsa-miR-125b-5p hsa-miR-4319 |
| DYNLL2 | hsa-miR-193a-3p hsa-miR-148a-3p hsa-miR-139-5p hsa-miR-329-3p hsa-miR-330-3p hsa-miR-296-5p hsa-miR-19b-3p hsa-miR-129-2-3p hsa-miR-204-5p hsa-miR-4644 hsa-miR-1306-5p hsa-miR-130a-3p hsa-miR-130b-3p hsa-miR-150-5p hsa-miR-6088 hsa-miR-181c-5p hsa-miR-185-5p hsa-miR-148b-3p hsa-miR-193b-3p hsa-miR-195-5p hsa-miR-200a-3p hsa-miR-211 -5p hsa-miR-454-3p hsa-miR-331-3p hsa-miR-141-3p hsa-miR-103a-3p hsa-miR-129-1-3p hsa-miR-212-3p hsa-miR-328-3p hsa-miR-301b-3p hsa-miR-3666 hsa-miR-4295 hsa-miR-532-3p hsa-miR-152-3p hsa-miR-181d-5p hsa-miR-107 hsa-miR-132-3p hsa-miR-6835-3p |
Discussion
Spermatogenesis is a complex process, involving spermatogonial proliferation (mitosis), spermatocyte meiosis, and spermatid differentiation (14). In this study, we integrated the GSE145467 and GSE108886 datasets and utilized bioinformatics methods to identify 816 common DEGs, including 52 common upregulated and 764 common downregulated genes in NOA. GO enrichment analysis showed that common upregulated DEGs were mainly associated with ECM organization, extracellular exosome, and receptor binding. Common downregulated DEGs were mainly associated with spermatogenesis, nucleus, and protein serine/threonine kinase activity. KEGG pathway analysis showed that common upregulated DEGs were mainly involved in focal adhesion, PI3K-Akt signaling pathway, glioma, ECM-receptor interaction, and protein digestion and absorption. Common downregulated DEGs were mainly involved in oocyte meiosis, glycolysis/gluconeogenesis, cell cycle, progesterone-mediated oocyte maturation, AMPK signaling pathway, glucagon signaling pathway, metabolic pathways, protein processing in endoplasmic reticulum, and biosynthesis of amino acids. Most of the above KEGG pathways are involved in spermatogenesis (15-17). However, the two pathway names of “oocyte meiosis” and “progesterone-mediated oocyte maturation” are derived from their roles in female fertility, but genes involved in the “oocyte meiosis” pathway also play an important role in sperm meiosis (18). Similarly, we speculated that genes involved in the “progesterone-mediated oocyte maturation” pathway may also play a role in spermatogenesis. These common DEGs may, therefore, be closely related to spermatogenic disorder in NOA patients.
We then identified 20 hub genes: CCNB2, DYNLL2, HMMR, NEK2, KIF15, DLGAP5, NUF2, TTK, PLK4, PTTG1, PBK, CEP55, CDKN3, CDC25C, MCM4, DNAI1, TYMS, PPP2R1B, DNAI2, and DYNLRB2, which were all downregulated genes. Now we summarize the several hub genes that have been studied (Table 5), and then we will describe and discuss them in detail.
Table 5. Several hub genes play a functional role in spermatogenesis.
| Gene | Function | Reference |
|---|---|---|
| CCNB2 | G2/M transition in both mitosis and meiosis | Baker et al. (19) |
| HMMR | Sperm count, motility and number of sperm with normal morphology | Abu-Halima et al. (20) |
| Nek2 | G2/M phase transition of the cell cycle | Matsuoka et al. (21) |
| TTK | Mitotic checkpoint activity | Poss et al. (22) |
| PLK4 | Necessary for centriole duplication | Bettencourt-Dias et al. (23) |
| PBK | In the outer cell layer of spermatogenic tubules | Zhao et al. (24) |
| CEP55 | Maintaining stable germ cell intercellular bridges | Chang et al. (25) |
| CDC25C | G2/M phase transition of the cell cycle | Nilsson et al. (26) |
| DNAI1 | Ciliary function and ultrastructure | Escudier et al. (27) |
CCNB2 is a member of the cyclin B family, which contributes to G2/M transition in both mitosis and meiosis (19). Research has found CCNB2 to be continuously expressed in the medaka testis during the process of spermatogenesis (28). CDC25C is a member of the CDC25 family of protein phosphatases, which affects the G2/M phase transition of the cell cycle by activating CDC2 (26). One study reported that under the influence of selenite-induced oxidative stress, CDC25C was downregulated and p21 (a kinase inhibitor) increased (29). This resulted in the downregulation of the CDC2/cyclin B1 complex that regulates the G2/M phase checkpoint, thereby causing cell cycle arrest in male Balb/c mice (29). Lin et al. (30) examined the testicular messenger RNA (mRNA) transcription levels of 29 patients with NOA, including 18 patients with successful sperm extraction and 11 patients with failed sperm extraction. They found that the mRNA transcription levels of CCNB2 and CDC25C were significantly reduced in NOA patients with failed sperm extraction (30). This further indicates that CCNB2 and CDC25C might play an essential role in spermatogenesis. Hyaluronan-mediated motility receptor (HMMR), also known as receptor for hyaluronan-mediated motility (RHAMM), is a hyaluronic acid-mediated motor receptor (31). One study showed that the downregulation of HMMR is related to a decrease in sperm count, motility, and number of sperm with normal morphology (20). Meanwhile, NIMA-related kinase 2 (Nek2) is a serine/threonine kinase associated with G2/M phase transition of the cell cycle (21). In the testes of Oreochromis niloticus, Nek2 was generally found to be expressed in primary and secondary spermatocytes (21). Another study reported that Nek2 plays an important role in chromatin condensation during meiosis in male mice (32). TTK (or Mps1) is a dual specificity protein kinase with the ability to phosphorylate tyrosine, serine, and threonine. In reproductive tissues of male zebrafish, mps1zp1 mutation was found to reduce mitotic checkpoint activity, resulting in abnormal chromosomes in male germ cells, and severe developmental defects in aneuploid progeny (22). Polo-like kinases (Plks) are a conserved family of mitotic serine-threonine protein kinases that play a key role in centrosome function (33). PLK4 is a member of the Plks family and necessary for centriole duplication. In a study of PLK4 mutation, the majority of spermatids in Drosophila could not form flagella due to a lack of centrioles, while the depletion of PLK4 in human cells was also seen to induce apoptosis due to mitotic abnormalities (23). PLK4 mutations might also be associated with human Sertoli‐cell‐only syndrome (SCOS) (34,35). PDZ binding kinase (PBK) is a serine/threonine protein kinase, which was found in the outer cell layer of spermatogenic tubules by in situ hybridization, indicating that it plays an important role in the process of spermatogenesis (24). CEP55 (Centrosomal protein 55), located in the centrosomes of interphase cells, plays an important role in maintaining stable germ cell intercellular bridges during spermatogenesis and spermiogenesis in mice (25). In one study, the expression level of CEP55 in patients with maturation arrest was significantly lower than in patients with normal spermatogenesis (36). However, CEP55 overexpression causes change in the proportion of germ cells in mice, and it manifests as a Sertoli-cell-only–tubule phenotype, resulting in mouse infertility (37). Thymidylate synthase (TYMS) converts deoxyuridine monophosphate (dUMP) into deoxythymidine monophosphate (dTMP) using a 5,10-methylenetetrahydrofolate cofactor (38). The TYMS mutation has been associated with failed post-implantation development of the embryo in mice (38). DNAI1 and DNAI2 are members of the dynein intermediate chain family, and their mutations can lead to abnormalities in respiratory ciliary function and ultrastructure, which are important mechanisms of primary ciliary dyskinesia (PCD) (27). DNAI1 is also highly expressed in the testes (39). In male patients with PCD, infertility can be caused by sperm tail dysmotility (40). The DNAI1 mutation in male Drosophila has been associated with infertility caused by motile sperm (41). However, DNAI2 has not been reported in the literature with regard to spermatogenesis. Nine other hub genes, namely DYNLL2, KIF15, DLGAP5, NUF2, PTTG1, CDKN3, MCM4, PPP2R1B, and DYNLRB2, have also not been reported.
We compared the expression levels of 20 hub genes in the two subgroups (MA and PreMA) of NOA in the GSE108886 dataset and found no statistical difference. This suggests that these hub genes are not affected by NOA classification. This might have been due to the small sample size in the subgroup. A larger number of samples may be needed to confirm this.
In our study, we used WebGestalt for KEGG analysis of 20 hub genes and identified other pathways, including FoxO signaling pathway and Huntington disease. Studies have shown that these pathways are also related to spermatogenesis (42,43).
DYNLL2, CEP55, and PPP2R1B are three important target genes in the miRNA-gene regulatory network. CEP55 is described above. DYNLL2 was not involved in any KEGG pathways but could be regulated by most miRNAs, while PPP2R1B was involved in the oocyte meiosis pathway. Among these miRNAs, hsa-miR-3666, hsa-miR-130b-3p, hsa-miR-15b-5p, hsa-miR-6838-5p, and hsa-miR-195-5p have garnered the most research attention. However, these five miRNAs have not been studied in NOA, and further research is required.
A limitation in our study is that the potential miRNAs and hub genes in NOA need to be elucidated through experiments. Further research is required to verify and explore this in-depth.
Conclusions
In summary, this study involved a comprehensive bioinformatics analysis of DEGs between NOA and OA tissues, and successfully screened 20 hub genes, namely CCNB2, DYNLL2, HMMR, NEK2, KIF15, DLGAP5, NUF2, TTK, PLK4, PTTG1, PBK, CEP55, CDKN3, CDC25C, MCM4, DNAI1, TYMS, PPP2R1B, DNAI2, and DYNLRB2. We also predicted some potential miRNAs of hub genes including hsa-miR-3666, hsa-miR-130b-3p, hsa-miR-15b-5p, hsa-miR-6838-5p, and hsa-miR-195-5p. Some important pathways, including focal adhesion, PI3K-Akt signaling pathway, cell cycle, oocyte meiosis, AMPK signaling pathway, FoxO signaling pathway, and Huntington disease, are involved in spermatogenesis. Our results may provide a more detailed understanding of the molecular mechanism of NOA and offer potential therapeutic targets for its treatment.
Supplementary
The article’s supplementary files as
Acknowledgments
The authors would like to thank the staff members of the GEO database and Yu Du at the Third Affiliated Hospital of Sun Yat-sen University for providing us with technical support.
Funding: This study was funded by the National Natural Science Foundation of China (No. 81571424 & No. 81771565) and the Guangdong Basic and Applied Basic Research Foundation (No. 2019A1515010975).
Ethical Statement: The authors are accountable for all aspects of the work in ensuring that questions related to the accuracy or integrity of any part of the work are appropriately investigated and resolved. As all the data in this study were from the GEO public database, the approval of the local ethics committee was not required.
Footnotes
Reporting Checklist: The authors have completed the STROBE and MDAR reporting checklists. Available at http://dx.doi.org/10.21037/tau-20-1029
Conflicts of Interest: All authors have completed the ICMJE uniform disclosure form (available at http://dx.doi.org/10.21037/tau-20-1029). The authors have no conflicts of interest to declare.
References
- 1.Devroey P, Fauser BC, Diedrich K, et al. Approaches to improve the diagnosis and management of infertility. Hum Reprod Update 2009;15:391-408. 10.1093/humupd/dmp012 [DOI] [PMC free article] [PubMed] [Google Scholar]
- 2.Evers JL. Female subfertility. Lancet 2002;360:151-9. 10.1016/S0140-6736(02)09417-5 [DOI] [PubMed] [Google Scholar]
- 3.Sharlip ID, Jarow JP, Belker AM, et al. Best practice policies for male infertility. Fertil Steril 2002;77:873-82. 10.1016/S0015-0282(02)03105-9 [DOI] [PubMed] [Google Scholar]
- 4.Lee JY, Dada R, Sabanegh E, et al. Role of genetics in azoospermia. Urology 2011;77:598-601. 10.1016/j.urology.2010.10.001 [DOI] [PubMed] [Google Scholar]
- 5.Nicopoullos JD, Ramsay JW, Almeida PA, et al. Assisted reproduction in the azoospermic couple. BJOG 2004;111:1190-203. 10.1111/j.1471-0528.2004.00202.x [DOI] [PubMed] [Google Scholar]
- 6.Wu X, Luo C, Hu L, et al. Unraveling epigenomic abnormality in azoospermic human males by WGBS, RNA-Seq, and transcriptome profiling analyses. J Assist Reprod Genet 2020;37:789-802. 10.1007/s10815-020-01716-7 [DOI] [PMC free article] [PubMed] [Google Scholar]
- 7.Maduro MR, Lamb DJ. Understanding new genetics of male infertility. J Urol 2002;168:2197-205. 10.1016/S0022-5347(05)64355-8 [DOI] [PubMed] [Google Scholar]
- 8.Yao C, Yuan Q, Niu M, et al. Distinct Expression Profiles and Novel Targets of MicroRNAs in Human Spermatogonia, Pachytene Spermatocytes, and Round Spermatids between OA Patients and NOA Patients. Mol Ther Nucleic Acids 2017;9:182-94. 10.1016/j.omtn.2017.09.007 [DOI] [PMC free article] [PubMed] [Google Scholar]
- 9.Zhang HT, Zhang Z, Hong K, et al. Altered microRNA profiles of testicular biopsies from patients with nonobstructive azoospermia. Asian J Androl 2020;22:100-5. 10.4103/aja.aja_35_19 [DOI] [PMC free article] [PubMed] [Google Scholar]
- 10.Ferlin A, Raicu F, Gatta V, et al. Male infertility: role of genetic background. Reprod Biomed Online 2007;14:734-45. 10.1016/S1472-6483(10)60677-3 [DOI] [PubMed] [Google Scholar]
- 11.Hodžić A, Maver A, Plaseska-Karanfilska D, et al. De novo mutations in idiopathic male infertility-A pilot study. Andrology 2020. [Epub ahead of print]. doi: . 10.1111/andr.12897 [DOI] [PubMed] [Google Scholar]
- 12.Song E, Song W, Ren M, et al. Identification of potential crucial genes associated with carcinogenesis of clear cell renal cell carcinoma. J Cell Biochem 2018;119:5163-74. 10.1002/jcb.26543 [DOI] [PubMed] [Google Scholar]
- 13.Okada H, Tajima A, Shichiri K, et al. Genome-wide expression of azoospermia testes demonstrates a specific profile and implicates ART3 in genetic susceptibility. PLoS Genet 2008;4:e26. 10.1371/journal.pgen.0040026 [DOI] [PMC free article] [PubMed] [Google Scholar]
- 14.Neto FT, Bach PV, Najari BB, et al. Spermatogenesis in humans and its affecting factors. Semin Cell Dev Biol 2016;59:10-26. 10.1016/j.semcdb.2016.04.009 [DOI] [PubMed] [Google Scholar]
- 15.Lie PP, Mruk DD, Mok KW, et al. Focal adhesion kinase-Tyr407 and -Tyr397 exhibit antagonistic effects on blood-testis barrier dynamics in the rat. Proc Natl Acad Sci U S A 2012;109:12562-7. 10.1073/pnas.1202316109 [DOI] [PMC free article] [PubMed] [Google Scholar]
- 16.Tarnawa ED, Baker MD, Aloisio GM, et al. Gonadal expression of Foxo1, but not Foxo3, is conserved in diverse Mammalian species. Biol Reprod 2013;88:103. 10.1095/biolreprod.112.105791 [DOI] [PMC free article] [PubMed] [Google Scholar]
- 17.Helsel AR, Oatley MJ, Oatley JM. Glycolysis-Optimized Conditions Enhance Maintenance of Regenerative Integrity in Mouse Spermatogonial Stem Cells during Long-Term Culture. Stem Cell Reports 2017;8:1430-41. 10.1016/j.stemcr.2017.03.004 [DOI] [PMC free article] [PubMed] [Google Scholar]
- 18.Li B, He X, Zhao Y, et al. Transcriptome profiling of developing testes and spermatogenesis in the Mongolian horse. BMC Genet 2020;21:46. 10.1186/s12863-020-00843-5 [DOI] [PMC free article] [PubMed] [Google Scholar]
- 19.Baker CC, Gim BS, Fuller MT. Cell type-specific translational repression of Cyclin B during meiosis in males. Development 2015;142:3394-402. 10.1242/dev.122341 [DOI] [PMC free article] [PubMed] [Google Scholar]
- 20.Abu-Halima M, Ayesh BM, Hart M, et al. Differential expression of miR-23a/b-3p and its target genes in male patients with subfertility. Fertil Steril 2019;112:323-35.e2. 10.1016/j.fertnstert.2019.03.025 [DOI] [PubMed] [Google Scholar]
- 21.Matsuoka Y, Kobayashi T, Kihara K, et al. Molecular cloning of Plk1 and Nek2 and their expression in mature gonads of the teleost fish Nile tilapia (Oreochromis niloticus). Mol Reprod Dev 2008;75:989-1001. 10.1002/mrd.20843 [DOI] [PubMed] [Google Scholar]
- 22.Poss KD, Nechiporuk A, Stringer KF, et al. Germ cell aneuploidy in zebrafish with mutations in the mitotic checkpoint gene mps1. Genes Dev 2004;18:1527-32. 10.1101/gad.1182604 [DOI] [PMC free article] [PubMed] [Google Scholar]
- 23.Bettencourt-Dias M, Rodrigues-Martins A, Carpenter L, et al. SAK/PLK4 is required for centriole duplication and flagella development. Curr Biol 2005;15:2199-207. 10.1016/j.cub.2005.11.042 [DOI] [PubMed] [Google Scholar]
- 24.Zhao S, Dai J, Zhao W, et al. PDZ-binding kinase participates in spermatogenesis. Int J Biochem Cell Biol 2001;33:631-6. 10.1016/S1357-2725(01)00005-X [DOI] [PubMed] [Google Scholar]
- 25.Chang YC, Chen YJ, Wu CH, et al. Characterization of centrosomal proteins Cep55 and pericentrin in intercellular bridges of mouse testes. J Cell Biochem 2010;109:1274-85. 10.1002/jcb.22517 [DOI] [PubMed] [Google Scholar]
- 26.Nilsson I, Hoffmann I. Cell cycle regulation by the Cdc25 phosphatase family. Prog Cell Cycle Res 2000;4:107-14. 10.1007/978-1-4615-4253-7_10 [DOI] [PubMed] [Google Scholar]
- 27.Escudier E, Duquesnoy P, Papon JF, et al. Ciliary defects and genetics of primary ciliary dyskinesia. Paediatr Respir Rev 2009;10:51-4. 10.1016/j.prrv.2009.02.001 [DOI] [PubMed] [Google Scholar]
- 28.Mita K, Ohbayashi T, Tomita K, et al. Differential Expression of Cyclins B1 and B2 during Medaka (Oryzias latipes) Spermatogenesis. Zoolog Sci 2000;17:365-74. [DOI] [PubMed] [Google Scholar]
- 29.Kaushal N, Bansal MP. Inhibition of CDC2/Cyclin B1 in response to selenium-induced oxidative stress during spermatogenesis: potential role of Cdc25c and p21. Mol Cell Biochem 2007;298:139-50. 10.1007/s11010-006-9360-y [DOI] [PubMed] [Google Scholar]
- 30.Lin YM, Teng YN, Chung CL, et al. Decreased mRNA transcripts of M-phase promoting factor and its regulators in the testes of infertile men. Hum Reprod 2006;21:138-44. 10.1093/humrep/dei285 [DOI] [PubMed] [Google Scholar]
- 31.Kornovski BS, McCoshen J, Kredentser J, et al. The regulation of sperm motility by a novel hyaluronan receptor. Fertil Steril 1994;61:935-40. 10.1016/S0015-0282(16)56709-0 [DOI] [PubMed] [Google Scholar]
- 32.Di Agostino S, Fedele M, Chieffi P, et al. Phosphorylation of high-mobility group protein A2 by Nek2 kinase during the first meiotic division in mouse spermatocytes. Mol Biol Cell 2004;15:1224-32. 10.1091/mbc.e03-09-0638 [DOI] [PMC free article] [PubMed] [Google Scholar]
- 33.Barr FA, Sillje HH, Nigg EA. Polo-like kinases and the orchestration of cell division. Nat Rev Mol Cell Biol 2004;5:429-40. 10.1038/nrm1401 [DOI] [PubMed] [Google Scholar]
- 34.Miyamoto T, Bando Y, Koh E, et al. A PLK4 mutation causing azoospermia in a man with Sertoli cell-only syndrome. Andrology 2016;4:75-81. 10.1111/andr.12113 [DOI] [PubMed] [Google Scholar]
- 35.Miyamoto T, Minase G, Shin T, et al. Human male infertility and its genetic causes. Reprod Med Biol 2017;16:81-8. 10.1002/rmb2.12017 [DOI] [PMC free article] [PubMed] [Google Scholar]
- 36.Zhu Y, Liu J, Zhang W, et al. CEP55 may be a potential therapeutic target for non-obstructive azoospermia with maturation arrest. Nan Fang Yi Ke Da Xue Xue Bao 2019;39:1059-64. [DOI] [PMC free article] [PubMed] [Google Scholar]
- 37.Sinha D, Kalimutho M, Bowles J, et al. Cep55 overexpression causes male-specific sterility in mice by suppressing Foxo1 nuclear retention through sustained activation of PI3K/Akt signaling. FASEB J 2018;32:4984-99. 10.1096/fj.201701096RR [DOI] [PubMed] [Google Scholar]
- 38.Ching YH, Munroe RJ, Moran JL, et al. High resolution mapping and positional cloning of ENU-induced mutations in the Rw region of mouse chromosome 5. BMC Genet 2010;11:106. 10.1186/1471-2156-11-106 [DOI] [PMC free article] [PubMed] [Google Scholar]
- 39.Pennarun G, Escudier E, Chapelin C, et al. Loss-of-function mutations in a human gene related to Chlamydomonas reinhardtii dynein IC78 result in primary ciliary dyskinesia. Am J Hum Genet 1999;65:1508-19. 10.1086/302683 [DOI] [PMC free article] [PubMed] [Google Scholar]
- 40.Storm van's Gravesande K, Omran H. Primary ciliary dyskinesia: clinical presentation, diagnosis and genetics. Ann Med 2005;37:439-49. 10.1080/07853890510011985 [DOI] [PubMed] [Google Scholar]
- 41.Fatima R. Drosophila Dynein intermediate chain gene, Dic61B, is required for spermatogenesis. PLoS One 2011;6:e27822. 10.1371/journal.pone.0027822 [DOI] [PMC free article] [PubMed] [Google Scholar]
- 42.Huang P, Zhou Z, Shi F, et al. Effects of the IGF-1/PTEN/Akt/FoxO signaling pathway on male reproduction in rats subjected to water immersion and restraint stress. Mol Med Rep 2016;14:5116-24. 10.3892/mmr.2016.5880 [DOI] [PMC free article] [PubMed] [Google Scholar]
- 43.Hannan AJ, Ransome MI. Deficits in spermatogenesis but not neurogenesis are alleviated by chronic testosterone therapy in R6/1 Huntington's disease mice. J Neuroendocrinol 2012;24:341-56. 10.1111/j.1365-2826.2011.02238.x [DOI] [PubMed] [Google Scholar]
Associated Data
This section collects any data citations, data availability statements, or supplementary materials included in this article.
Supplementary Materials
The article’s supplementary files as


