FIG 8.
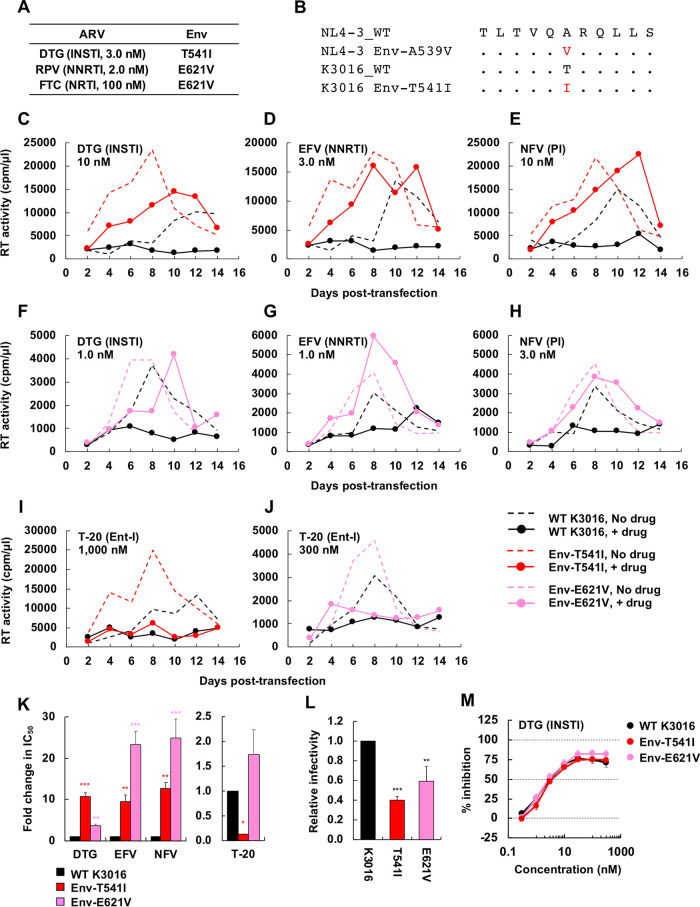
Selection for DTG resistance with the subtype C CCR5-tropic isolate K3016. (A) The SupT1huR5 T-cell line was transfected with the K3016 molecular clone in the presence of 3.0 nM DTG, 2.0 nM RPV, or 100 nM FTC. DNA was extracted from the ARV-treated cultures at the peak of replication, and Env-coding regions were sequenced, leading to the identification of the Env-T541I and Env-E621V mutations. Amino acid numbers are based on HXB2 numbering. (B) gp41 HR1 sequences around the K3016 Env-T541I mutation are shown aligned with the NL4-3 sequence. (C to J) The SupT1huR5 T-cell line was transfected with WT K3016 or the indicated Env variants in the absence of DTG, EFV, NFV, and T-20. The supernatants were collected at the indicated time points and were assayed for replication kinetics by measuring RT activity. Data are representative of at three independent experiments. (K) The SupT1huR5 T-cell line was transfected with WT K3016 or the indicated Env variants in the absence or presence of a serial dilution of DTG, EFV, or NFV (0.01 to 300 nM) or T-20 (0.1 to 3,000 nM). IC50s were calculated based on RT values at the peak of virus replication. Fold changes in IC50 relative to that of WT were calculated. (L) RT-normalized virus stocks produced from 293T cells were used to infect TZM-bl cells. Luciferase activity was measured at 48 h postinfection. (M) TZM-bl cells were exposed to 100 TCID50 of the indicated viruses in the presence of a range of DTG concentrations, and luciferase activity was measured at 48 h postinfection. Data are shown as means ± SEs from three independent experiments. ***, P < 0.001; **, P < 0.01; *, P < 0.05 by one-way ANOVA and Tukey’s multiple-comparison test.

