Abstract
This study aimed to investigate the clinical significance of cullin 3 expression in nasopharyngeal carcinoma (NPC), as well as to explore the regulatory mechanism of cullin 3 underlying the growth and metastasis of NPC cells. Our findings showed that the expression levels of cullin 3 were significantly increased in both NPC tissues and cell lines. A strong positive correlation was found between cullin 3 expression and the Ki-67-based proliferation index in NPC tissues. Moreover, cullin 3 overexpression was correlated with local relapse and distant metastasis in NPC patients. In vitro experiments showed that knockdown of cullin 3 caused a significant reduction in the proliferation of NPC cells, probably by inducing cell cycle arrest. In addition, downregulation of cullin 3 inhibited colony formation and the migratory and invasive capacities of NPC cells. The expression levels of PCNA and epithelial-to-mesenchymal transition (EMT)-related proteins were also meditated by cullin 3 in NPC cells. Based on these findings, we demonstrated that cullin 3 plays a promoting role in the malignant progression of NPC and suggest that the cullin 3-based ubiquitin proteasome pathway may be used as a promising therapeutic target for NPC.
Key words: Cullin 3, Nasopharyngeal carcinoma (NPC), Tumor progression, Prognosis, Survival
INTRODUCTION
Nasopharyngeal carcinoma (NPC) is among the most common head and neck malignancies in the southern cities of China and Asia1,2. Despite the development of treatment technologies, many NPC patients still experience an unfavorable prognosis with a high frequency of local relapse and distant metastasis due to the lack of specific clinical symptoms3,4. Hence, identifying new sensitive diagnostic or prognostic indicators is of great importance for the individualized treatment and improved prognosis of NPC patients.
Our previous study revealed that FOLR1 overexpression was closely correlated with treatment outcome and prognosis of NPC patients5, and this correlation was assumed to be related to FOLR1’s interaction with several other proteins, including cullin 3 (CUL3) (unpublished data when this article was submitted). CUL3, a key member of the cullin family of proteins, has been demonstrated to be crucial for multiple ubiquitin–protein ligase complexes, which are involved in the regulation of ubiquitination as well as the proteasomal degradation activities of target proteins6,7. Moreover, accumulating evidence has revealed that CUL3 is frequently deregulated in some human cancers, such as bladder8, breast9, prostate10, and colorectal11 cancers. For instance, Wang et al. showed that CUL3 played a promoting role in the cell proliferation of colorectal cancer through targeting methionine adenosyltransferase IIα for ubiquitylation-mediated degradation11. Recently, Martinez et al. reported that CUL3 was relevant to a poor prognosis in head and neck squamous cell carcinomas together with the Nrf2 pathway12. However, as far as we know, no research to date has investigated the clinical significance of CUL3 expression in NPC. In addition, Ki-67 is a nuclear protein that is associated with and may be necessary for cellular proliferation. During interphase, the Ki-67 protein can be exclusively detected within the cell nucleus, whereas in mitosis, most of the protein is relocated to the surface of the chromosomes. However, the correlation between the expression of CUL3 and Ki-67 has never been previously studied in NPC tissues.
In the current report, we planned to elucidate the exact role of CUL3 in NPC by exploring CUL3 expression in both NPC tissues and cells, determining the relevance between CUL3 expression and the clinical characteristics of NPC patients. Therefore, we performed a series of experimental assays to investigate its functions on the cellular biological behaviors of NPC.
MATERIALS AND METHODS
Patients and Tissue Samples
In this study, 254 paraffin-embedded NPC tissue samples were obtained for immunohistochemical analysis, and 72 paraffin-embedded normal nasopharyngeal tissues, gathered from patients who were highly suspected to have NPC but were ruled out by nasopharyngeal biopsy, were used as controls. All NPC tissues were gathered from patients who were clinically and histologically diagnosed at the Department of Otolaryngology Head–Neck Surgery, Third Xiangya Hospital, Central South University, Changsha, P.R. China, from January 2007 to December 2009. None of the patients had been given any kind of treatment before biopsies. This project was approved by the ethical review committee of Third Xiangya Hospital, Central South University. Written consent forms were gathered from all patients involved before the clinical materials were used for the current study. The clinical data of all NPC patients involved are summarized in Table 1.
Table 1.
Multivariate Survival Analysis of the Clinical Factors Associated With the Survival of NPC Patients Through the Cox Regression Model
| Variables | TSS | NDMS | NLRS | |||
|---|---|---|---|---|---|---|
| HR (95% CI) | p * | HR (95% CI) | p * | HR (95% CI) | p * | |
| Histological type | ||||||
| Differentiated versus undifferentiated | 1.669 (1.196–2.328) | 0.003 | 1.653 (1.183–2.311) | 0.003 | 1.514 (1.081–2.122) | 0.016 |
| T stage | ||||||
| T1–T2 versus T3–T4 | 3.230 (2.319–4.501) | <0.001 | 2.890 (1.988–4.201) | <0.001 | 2.913 (2.041–4.160) | <0.001 |
| N stage | ||||||
| N0–N1 versus N2–N3 | 2.410 (1.456–3.987) | 0.001 | 2.400 (1.447–3.980) | 0.001 | 2.422 (1.461–4.014) | 0.001 |
| CUL3 expression | ||||||
| Low versus high | 2.008 (1.304–3.096) | 0.002 | 1.901 (1.211–2.985) | 0.005 | 2.066 (1.337–3.195) | 0.001 |
| Ki-67 expression | ||||||
| Low versus high | 3.215 (2.066–5.000) | <0.001 | 3.247 (2.079–5.076) | <0.001 | 3.012 (1.923–4.717) | <0.001 |
TSS, tumor-specific survival; NDMS, no distant metastasis-specific survival; NLRS, no local recurrence-specific survival; HR, hazard ratio; CI, confidence interval.
Multivariate Cox proportional hazards model.
Treatment and Follow-Up
A total of 254 patients were followed up regularly after undergoing comprehensive therapy for NPC until their death or final visit. The average age of participants at diagnosis was 52 years (range: 19–82 years). By the end of December 2016, the average follow-up duration was 80 months with a range of 38 to 120 months. All patients received radiotherapy according to the severity of their disease, complying with the published guidelines. For patients who had reached stages II to IV, cisplatin-based chemotherapy was also provided. Adjustment of treatment strategies for each patient was made according to changes in their conditions during each visit.
Immunohistochemical Analysis
All paraffin-embedded tissue samples were examined for the expression of CUL3 together with Ki-67 expression, which is among the most well-established biomarkers related to tumor proliferation and progression of numerous malignancies, including NPC13–15 as the positive control, according to the protocol described previously5. The primary antibody used in immune staining was anti-CUL3 (1:200; Cat. No. 11107-1-AP; Proteintech, Rosemont, IL, USA) and anti-Ki-67 (1:400; Cat. No. 19972-1-AP; Proteintech).
The expressions of CUL3 and Ki-67 were randomly assessed by two different researchers who were blinded to our clinical data. The assessment was based on the intensity and extent of staining for CUL3 expression, which was scored as 0 (negative; 0%), 1 (low CUL3 expression; 1%–25%), 2 (moderate CUL3 expression; 26%–50%), and 3 (high CUL3 expression; 51%–75%). The staining scores for intensity and extent of every sample were multiplied to get a total score with a range of 0 to 12 points. Samples with a total score less than 4 points were determined to be low CUL3 expression, while those with a score of 4–12 points were defined as CUL3 overexpression. For the evaluation of Ki-67 expression, samples with 0%–50% positively stained cell nuclei were defined as low Ki-67 expression, and those with 51%–100% were defined as high expression.
NPC Cell Lines
All NPC cells (CNE-1, CNE-2, HNE-2, and 5-8F) were provided and maintained as described previously5, using RPMI-1640 (Gibco Life Technologies, Grand Island, NY, USA) with 10% FBS (Hyclone, Logan, UT, USA), 100 U/ml penicillin, and 100 mg/ml streptomycin in a 37°C humidified 5% CO2 incubator. The human nasopharyngeal epithelial cell line (NP69) was incubated in keratinocyte serum-free medium (Gibco) as mentioned previously5.
Real-Time RT-PCR
Real-time RT-PCR was applied three times using a SYBR Green PCR Master Mix Plus Kit (TOYOBO Life Science, Shanghai, P.R. China). PCR and data collection were conducted by EP Real-time PCR System (Eppendorf Inc., Hauppauge, NY, USA). For standardization, we used β-actin as an endogenous control. Primers used in our study were purchased from Sangon Biotech (Shanghai, P.R. China), and the sequences are as follows: CUL2, 5′-GCCCTTTGACTCCCTTTTTC-3′ (sense) and 5′-AACTAT TGCGGGTGACTTTGA-3′ (antisense); β-actin, 5′-CTCC ATCCTGGCCTCGCTGT-3′ (sense) and 5′-GCTGTCACCTTCACCGTTCC-3′ (antisense). CUL3 mRNA expression was calculated using the 2−ΔΔCT method as previously described14.
Western Blotting Analysis
Western blotting analysis was carried out according to our previous article5. Primary antibodies used are as follows: anti-CUL3 (1:2,000; Cat. No. 11107-1-AP; Proteintech), anti-proliferating cell nuclear antigen (PCNA) (1:2,000; Cat. No. 10205-2-AP; Proteintech), anti-E-cadherin (1:1,000; Cat. No. 20874-1-AP; Proteintech), anti-N-cadherin (1:1,000; Cat. No. 22018-1-AP Proteintech), anti-vimentin (1:2,000; Cat. No. 10366-1-AP; Proteintech), and anti-β-actin (1:5,000; Cat. No. 66009-1-IG; Proteintech).
Immunofluorescence Analysis
Cells were seeded into the culture wells with glass coverslips (5 × 10³ cells/well; Nest Group, Wuxi, P.R. China) and incubated for 24 h. The cells were then immobilized in 4% paraformaldehyde at ambient temperature for 30 min and permeabilized using 0.5% Triton-X for 15 min, followed by blocking with 5% BSA at 37°C for 30 min. The samples were then incubated with anti-CUL3 (1:200; Cat. No. 11107-1-AP; Proteintech) at 4°C overnight, followed by the Alexa Flour 488 (1:200; Clone ID: ab150077; Green; Abcam, Cambridge, MA, USA) secondary antibody at ambient temperature for an hour. Nuclei were stained with DAPI solution (KAGE Biotechnology, Nanjing, P.R. China). Images were obtained using the Leica confocal microscope (Leica Microsystems, Buffalo Grove, IL, USA).
Generation of Stable CUL3 Knockdown and Overexpression NPC Cells
To make stable CUL3 knockdown and overexpression cells, we used a specific CUL3 shRNA- or cDNA-encoding lentivirus to transduce NPC cells according to the manufacturer’s protocol. Nonspecific shRNA- or cDNA-encoding lentiviruses were used as negative controls. All lentiviruses used in our study were synthesized by GenePharma, Shanghai, P.R. China. The cells were then maintained under puromycin (3 μg/ml) selection in RPMI-1640 (Gibco Life Technologies) with 10% FBS (Hyclone) in a 37°C humidified 5% CO2 incubator.
Cell Counting Kit-8 (CCK8) Assay
NPC cells were planted into 96-well plates (5 × 10³ cells/well) and incubated for 24 h. CCK8 reagents (10 μl per well; Dojindo, Kyushu, Japan) were then added into the cell samples. The absorbance at 450 nm at different time points was read in an automated plate reader (BioTek, Winooski, VT, USA).
Colony Formation Assay
Cells were seeded into 6-cm-diameter culture dishes (Corning, Toledo, NY, USA) with a density of 500 cells per dish. The culture medium was substituted every 3 days. After being cultured for 21 days, colonies were immobilized in 4% paraformaldehyde for 20 min followed by staining in 1% crystal violet for 5 min. Colonies consisting of 50 cells or more were then counted under a microscope (Leica Microsystems). The formation rate of colonies = (colonies number/cell number) × 100%. Digital images of colonies were also taken.
Cell Cycle Analysis
After trypsinization, cells (1 × 10⁶ cells/ml) were fixed in 70% ethanol at −20°C for 24 h. After washing with cold PBS, PI/RNase Staining Buffer (0.5 ml/test; BD Biosciences, San Jose, CA, USA) was added into the cell samples, which needed to incubate in the dark at ambient temperature for 15 min. The stained samples were then analyzed with FACS flow cytometer (BD Biosciences). All experiments were repeated three times.
Wound Healing Assay
Cells with 10% FBS medium were planted into the two-well cell culture inserts (70 μl per well, 1 × 10⁶/ml) of the wound healing assay (Ibidi, Martinsried, Germany) and incubated for 24 h. The inserts were then removed to form a 500-μm scrape line, and serum-free medium was added before the continuation of cell incubation. Digital images of the scrape lines were obtained at different time points.
Transwell Migration and Matrigel Invasion Assays
For the migration test, the 24-well type with 8-μm pore assay (Corning Inc., Corning, NY, USA) was applied. For the invasion assay, the 24-well type with 8-μm pore Matrigel-coated Transwell plug-in components (BD Biosciences) was applied in accordance with the manufacturer’s instructions. Cells (150 μl; 1 × 10⁶ cells/ml for the migration assay and 1 × 10⁵ cells/ml for the invasion assay) in medium without serum were planted into the upper chambers of the assay, while 750 μl of medium containing 15% FBS was inserted into the lower chambers. After being incubated for 48 h, cells that transferred to the membrane’s under-surface were immobilized with methanol followed by staining with 1% crystal violet. Five random fields of migrated cells were counted in every well under a Leica microscope (Leica Microsystems), and the data were numerically averaged and recorded.
Statistical Analysis
The statistical calculation in this study was performed by the IBM SPSS Statistics (version 17.0; SPSS Inc., Chicago, IL, USA). Results from triplicate experiments were calculated as the mean ± SD. The t-test or chi-square test was applied to compare differences, as appropriate. The relevance analysis between CUL3 expression and Ki-67 expression was carried out through the Spearman’s correlation coefficient. Survival analysis was conducted based on the Kaplan–Meier model, and the intergroup variations in survival analysis were assessed by the log-rank analysis. Univariate and multivariate analyses were carried out through the Cox regression model. A statistically significant difference was set as a value of p < 0.05.
RESULTS
CUL3 Expression in Normal Nasopharyngeal and NPC Tissue Samples
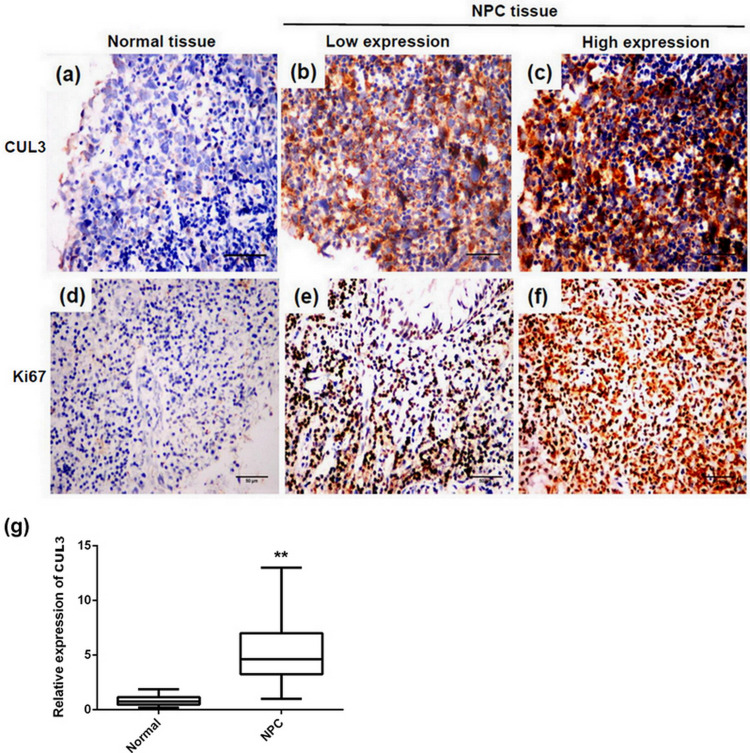
To uncover the role of CUL3 expression on NPC, we first examined both normal nasopharyngeal and NPC tissues for CUL3 expression through immunohistochemistry, together with the expression of the well-established proliferation marker Ki-67. Similar to Ki-67, CUL3 was strongly expressed in NPC tissues, while there was a weak or negative expression of CUL3 in normal nasopharyngeal tissues (Fig. 1a–f). The positive staining rate in NPC tissues (55.9%, 142/254) was significantly higher than that in the normal tissue samples (16.7%, 12/72, p < 0.001). Quantitative analysis data showed that CUL3 was significantly upregulated in NPC tissues compared with normal nasopharyngeal tissues (Fig. 1g).
Figure 1.
Representative images of immunohistochemical staining for cullin 3 (CUL3) and Ki-67 expression. (a) Expression of CUL3 in normal nasopharyngeal tissue. (b) Low expression of CUL3 in nasopharyngeal carcinoma (NPC) tissue. (c) High expression of CUL3 in NPC tissue. (d) Expression of Ki-67 in normal nasopharyngeal tissue. (e) Low expression of Ki-67 in NPC tissue. (f) High expression of Ki-67 in NPC tissue. Original magnification: 400×; scale bars: 50 μm. (g) Quantitative analysis data showed that CUL3 was significantly upregulated in NPC tissues compared with normal nasopharyngeal tissues. **Statistically significant difference.
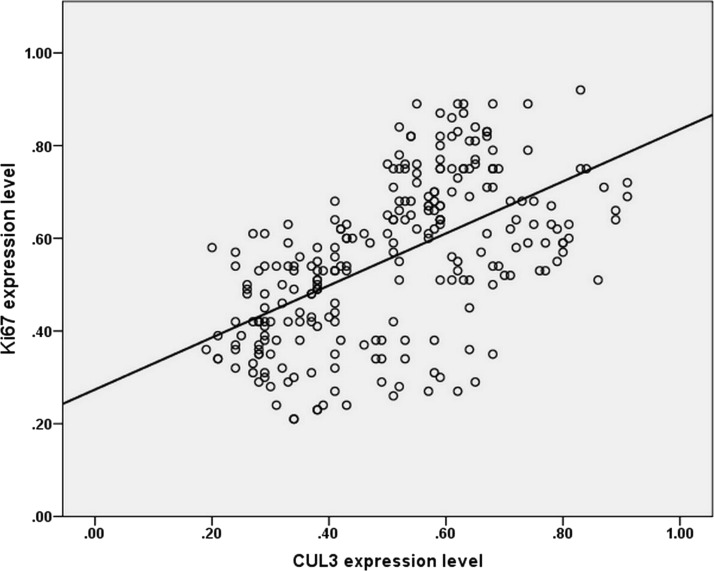
Moreover, the expression of CUL3 and Ki-67 was mainly located on the membrane and nucleus of tumor cells, respectively. In accordance with the results above, the Spearman’s correlation coefficient revealed a strong positive correlation between CUL3 overexpression and the Ki-67-based proliferation index in NPC tissues (R 2 = 0.593, p < 0.001) (Fig. 2), confirming that CUL3 may be involved in NPC cell proliferation as Ki-67 was.
Figure 2.
Relevance between CUL3 expression level and Ki-67 in nasopharyngeal carcinoma. Scatter plot with a regression line using the Spearman’s correlation coefficient revealed a strong correlation between CUL3 expression and Ki-67 expression.
Relevance Between CUL3 Expression and Various Clinical Factors of NPC
We further studied the correlation between CUL3 expression and different clinical elements. Our data showed that CUL3 overexpression was measurably relevant to histological type (p = 0.001), clinical stage (p < 0.001), T category (p < 0.001), N category (p < 0.001), distant metastasis (p < 0.001), local recurrence (p < 0.001), and the expression level of Ki-67 (p < 0.001). However, there was no statistically significant correlation between CUL3 expression and other clinical factors of NPC patients, including gender (p = 0.188) and age at diagnosis (p = 0.246).
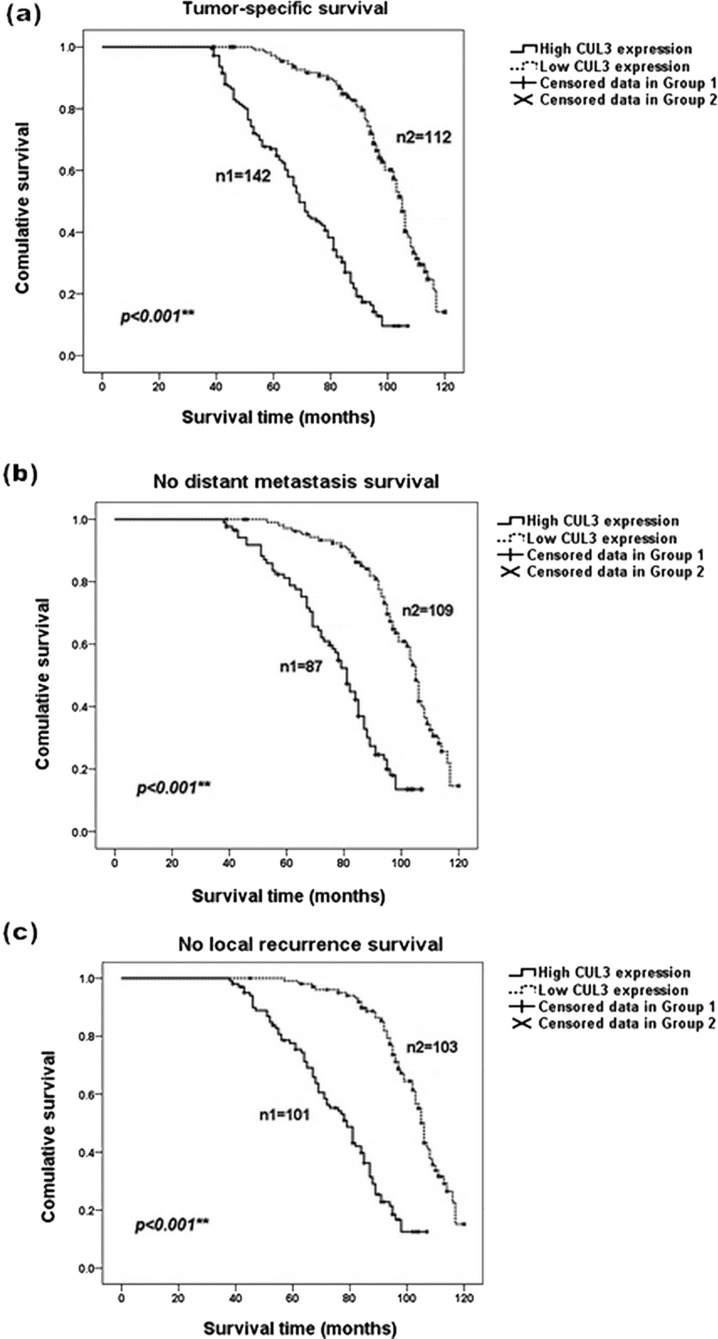
During the average follow-up time of 80 months, the mean distant metastasis, local recurrence, and tumor-specific survival (TSS) time were 58, 58, and 75 months, respectively. Survival curves based on the Kaplan–Meier analysis were plotted to illustrate the prognostic significance of CUL3 in NPC patients, which indicated that patients with a higher level of CUL3 expression in NPC tissues had a poorer TSS than those with a lower CUL3 expression (log-rank test: p < 0.001) (Fig. 3a). Furthermore, CUL3 overexpression increased the hazards of distant metastasis and local recurrence in NPC patients (log-rank test: p < 0.001) (Fig. 3b and c).
Figure 3.
Kaplan–Meier analysis revealed a reverse correlation between CUL3 expression and the survival of NPC patients. Patients with a higher level of CUL3 expression possessed a poorer overall survival and a higher risk for distant metastasis and local recurrence than those with a low expression of CUL3. (a) Tumor-specific overall survival curves according to the expression level of CUL3. (b) Survival curves showing no distant metastasis according to the expression level of CUL3. (c) Survival curves showing no local recurrence according to the expression level of CUL3. Group 1 refers to patients with a higher level of CUL3 expression, and group 2 refers to patients with a lower level of CUL3 expression. **p < 0.001.
Univariate and multivariate analyses using the Cox regression model were carried out to identify independent prognostic factors for NPC patients. Moreover, the univariate analysis revealed that the undifferentiated histological type, T category, with a high level of CUL3 and Ki-67 expression were statistically significant prognosis predictors for NPC progression (p < 0.05). However, gender, age at diagnosis, clinical stage, and N category were not statistically associated with the clinical prognosis of NPC patients (p > 0.05). In the multivariate analysis, which included all the factors in the univariate analysis, overexpression of CUL3 was still an independent risk factor for TSS [p = 0.002, hazard ratio (HR) = 2.008] (Table 1), distant metastasis-specific survival (DMSS) (p = 0.005, HR = 1.901) (Table 1), and local recurrence-specific survival (LRSS) (p = 0.001, HR = 2.066) (Table 1) for NPC patients, together with an undifferentiated histological type, more advanced stages in the T and N categories, and a higher level of Ki-67 expression.
CUL3 Expression in Different Human NPC Cells
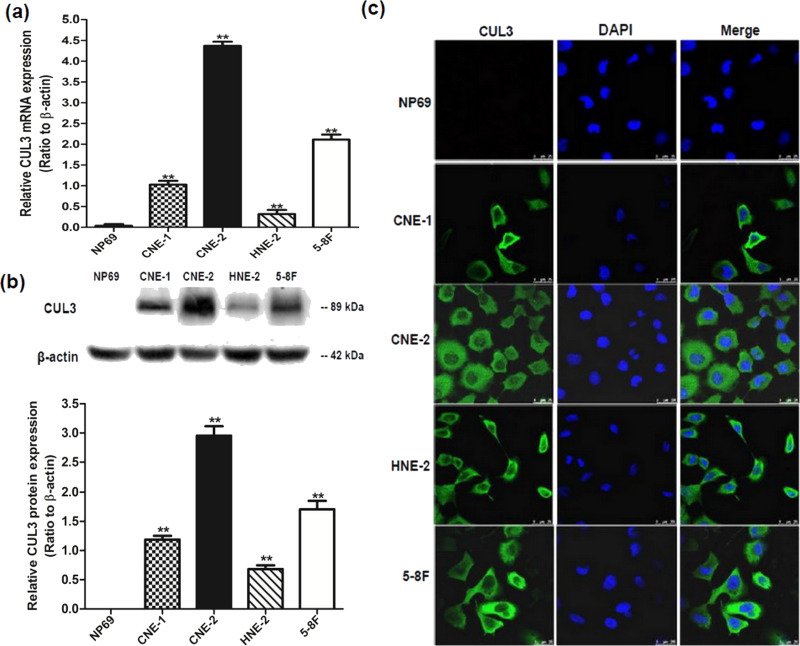
To further validate CUL3 overexpression in NPC, we investigated CUL3 expression in different NPC cell lines (CNE-1, CNE-2, HNE-2, and 5-8F), using NP69 cells as a control through real-time RT-PCR, Western blotting, and immunofluorescence analysis. All three methods revealed that CUL3 expression in NPC cells was relatively higher than that in the NP69 cells, and the highest CUL3 expression was found in CNE-2 cells, which were confirmed to be more invasive in our previous article5 (Fig. 4a–c). These findings elucidate that CUL3 is aberrantly overexpressed in various NPC cells, especially in more invasive NPC cell lines, indicating that CUL3 may play a crucial role in NPC progression.
Figure 4.
Expression level of CUL3 in different NPC cell lines. (a) Relative CUL3 mRNA expression of different NPC cell lines (CNE-1, CNE-2, HNE-2, and 5-8F). **p < 0.05 versus the NP69 cells. (b) Relative CUL3 protein expression of different NPC cell lines (CNE-1, CNE-2, HNE-2, and 5-8F). **p < 0.05 versus the NP69 cells. (c) Immunofluorescence analysis of CUL3 expression. Original magnification: 1,000×; scale bar: 25 μm.
Downregulated CUL3 Expression Decreased the Cellular Proliferation of NPC by Modulating the Cell Cycle
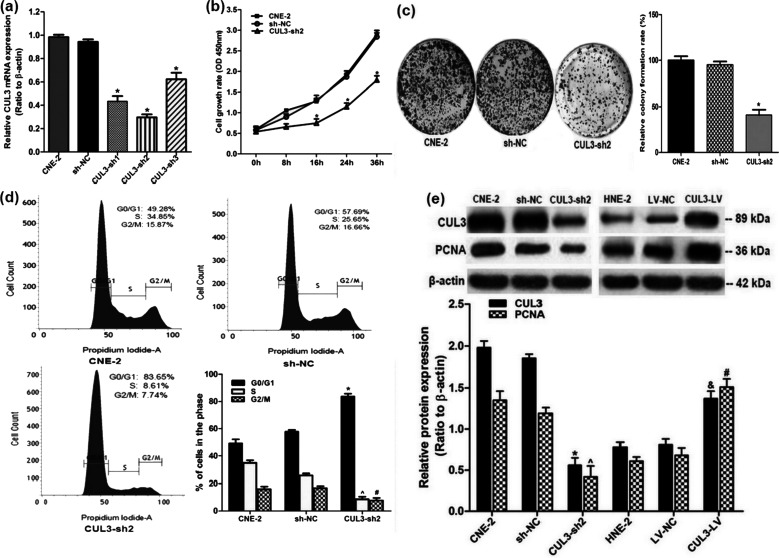
Among all the tested NPC cells, the highest CUL3 expression was found in CNE-2 cells. Therefore, CNE-2 cells were chosen to continue the investigation of the role of CUL3 in NPC. We then examined the relationship between CUL3 expression and the cellular proliferation of NPC. CNE-2 cells were first transduced with a CUL3-shRNA-encoding lentivirus to knock down CUL3 expression. The interfering efficiency was assessed through real-time RT-PCR analysis. The highest interfering efficiency was observed in CUL3-shRNA2, making it the most effective shRNA (Fig. 5a). To assess the effects of CUL3 downregulation on the proliferation of NPC cells, CCK8, colony formation, and cell cycle assays were carried out. Both the CCK8 and colony formation assays revealed that decreased CUL3 expression measurably inhibited NPC cell proliferation when compared to that of the sh-NC group (both p < 0.05) (Fig. 5b and c). Cell cycle analysis revealed that cell percentage in the G0/G1 phase increased from 49.28% to 83.65%, while that in the S phase decreased from 34.85% to 8.61% after downregulation of CUL3 expression (p < 0.05) (Fig. 5d), suggesting that CUL3 overexpression could urge NPC cells to accumulate in the S phase and thus promote NPC cell growth. Results from the Western blotting analysis confirmed that, compared to the sh-NC group, reduced CUL3 expression was followed by downregulated expression of another cell cycle-related marker, PCNA (p < 0.05) (Fig. 5e). CUL3 overexpression in HNE-2 cells was followed by increased PCNA expression (p < 0.05) (Fig. 5e). These findings suggest that CUL3 may promote proliferation of NPC cells through the regulation of the cell cycle in NPC.
Figure 5.
Knockdown of CUL3 expression decreased cellular proliferation of NPC by modulating the cell cycle. (a) Interference efficiency of CUL3 knockdown in CNE-2 cells (CNE-2, cells with no transfection; sh-NC, transfected with scrambled shRNA; CUL3-sh, transfected with CUL3-shRNA-encoding lentivirus) detected by real-time RT-PCR analysis. Highest interference efficiency of CUL3 knockdown was observed in cells transduced with CUL3-shRNA2 (CUL3-sh2). *p < 0.05 versus the sh-NC group. (b) Proliferation of CNE-2 cells after CUL3 knockdown using CUL3-sh2 was assessed by the cell counting kit-8 (CCK8) assay. *p < 0.05 versus the sh-NC group. (c) Colony formation assay in CNE-2 cells with depletion of CUL3 expression. *p < 0.05 versus the sh-NC group. (d) Cell cycle analysis in CNE-2 cells after depletion of CUL3 expression. Data are presented as mean ± SD. The same experiment was conducted in triplicate. *^p < 0.05 versus the sh-NC group. (e) Western blotting analysis of CUL3, and the PCNA expression in CUL3 knockdown CNE-2 cells and in CUL3 overexpression HNE-2 cells. *^&#p < 0.05 versus the sh-NC and LV-NC groups.
Downregulated CUL3 Expression Decreased NPC Cellular Migration and Invasion by Regulating the Epithelial-to-Mesenchymal Transition (EMT) System
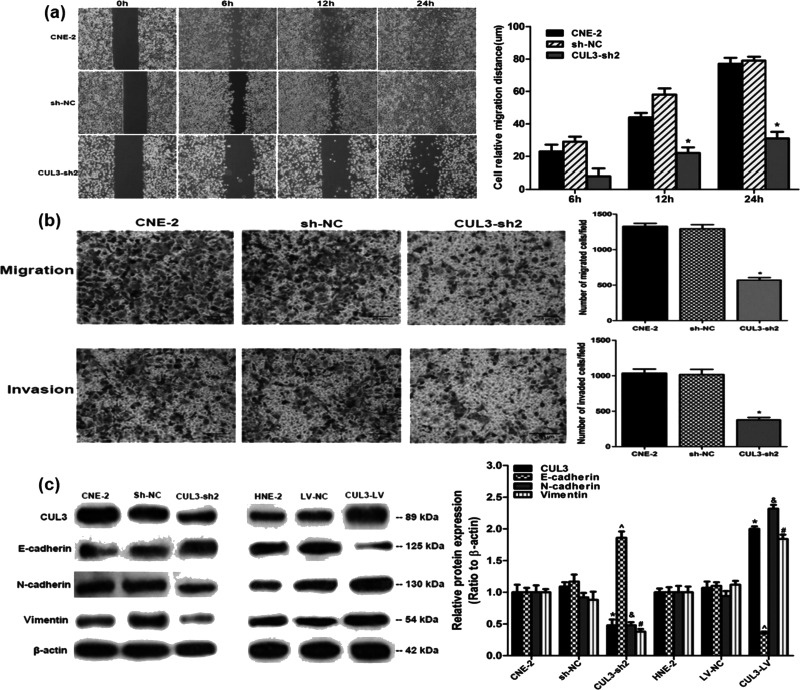
According to the relationship between CUL3 expression and NPC progression, we hypothesized that CUL3 may also correlate with the cellular migration and invasion of NPC. To confirm this point, we examined the impact of CUL3 on cellular capability for migration and invasion. The average cellular distance of wound closure at 24 h after downregulation of CUL3 expression was significantly shorter than that in the sh-NC group (31.4 ± 4.1 vs. 79.3 ± 2.4 μm, p < 0.05) (Fig. 6a). Results from the migration and invasion assays demonstrated that CUL3 knockdown could measurably decrease the migration and invasion of CNE-2 cells (both p < 0.05) (Fig. 6b). These results reveal that decreased CUL3 expression slows down the cellular migration and invasion of NPC.
Figure 6.
Knockdown of CUL3 expression using CUL3-sh2 in CNE-2 cells inhibited the cellular migration and invasion of NPC. Representative images of these experiments are shown. (a) Results from the 24-h wound healing assay in different CNE-2 cells. *p < 0.05 versus the sh-NC group. (b) Results demonstrated by the Transwell and Matrigel invasion assays in different CNE-2 cells. Original magnification: 200×; scale bar: 25 μm. *p < 0.05 versus the sh-NC group. (c) Western blotting analysis of E-cadherin, N-cadherin, and vimentin in CUL3 knockdown CNE-2 cells and in CUL3 overexpression HNE-2 cells. *^&#p < 0.05 versus the sh-NC and LV-NC groups.
Considering that multiple mechanisms may participate in cellular migration and invasion of various tumors, and the EMT system being among the most important ones15, we further examined the expression of several EMT-related genes in CUL3 knockdown and overexpression of NPC cells to uncover the mechanism of CUL3 strengthening cellular migration and invasion of NPC. Decreased CUL3 expression was followed by elevated E-cadherin expression and depleted N-cadherin and vimentin expression (all p < 0.05) (Fig. 6c). Downregulated E-cadherin expression and upregulated N-cadherin and vimentin expression were determined following CUL3 overexpression (all p < 0.05) (Fig. 6c). Taken together, we suggest that CUL3 may be a vital factor in the EMT plasticity of NPC cells, which regulates the cellular migration and invasion of NPC, though the exact mechanism remained unidentified.
DISCUSSION
Despite the encouraging advances in medical techniques, many NPC patients are still experiencing a poor prognosis after standard comprehensive therapy, which highlights the importance of accurate prognostic evaluation for NPC patients13. Though a growing number of studies have been focused on this subject, the exact mechanism remains to be determined. In the current study, NPC patients with a higher level of CUL3 expression were found to be more likely to have a poorer prognosis, including shorter survival time and a greater hazard for distant metastasis and local recurrence than those with a lower CUL3 expression. These findings demonstrate that CUL3 expression might be of clinical value for identifying a high risk for NPC progression. To our knowledge, this report is the first to directly investigate the relevance between CUL3 expression and NPC progression.
CUL3 is a member of the cullin-ring ubiquitin ligases (CRL), which is crucial for mediating protein degradation6. With the existence of numerous substrate adaptors, the CRL complex ubiquitinates different kinds of substrates and are involved in various functions of cells including cell cycle modulation, protein transportation, and stress responses, which may play critical roles in various diseases, including malignancies6,16. In this study, we carried out immunohistochemical staining to compare the CUL3 expression level between NPC and normal nasopharyngeal tissues, together with Ki-67 expression, a well-established, proliferation biomarker for NPC17–20. The results were statistically analyzed and indicated that CUL3 expression was strongly correlated with Ki-67-based proliferative activity in NPC, making it a new possible biomarker for NPC progression as is Ki-67.
In accordance with our findings, Grau et al. demonstrated that CUL3 overexpression was responsible for progression, nodal metastasis, and poor clinical outcome in bladder cancer patients8. Similarly, data collected by Huo et al. revealed that upregulation of CUL3 was linked to aggressiveness and metastasis in breast cancer21. However, there are contradictory reports with regard to the significance of CUL3 overexpression in tumor behavior and treatment outcomes in several malignant tumors. Both Wang et al.11 and Dorr et al.22 demonstrated that CUL3 served as a tumor-suppressive gene in non-small cell lung cancer22 and colorectal cancer11. Taken together, we suggested that CUL3 may play a distinct role in regulating carcinogenesis and progression in various malignances through ubiquitin-mediated degradation of different tumor suppressor genes or oncogenes, though further investigation is still needed to confirm the exact mechanism. One possible underlying cause for the decreased survival rate in CUL3-overexpressed NPC patients might be the CUL3-based ubiquitin-mediated degradation of certain critical tumor-suppressor genes in NPC cells. Another may be the direct CUL3 regulation in tumor behaviors including cellular proliferation, migration, and invasion in NPC.
Another interesting finding of the current study is that, after depletion of CUL3 expression, the proliferation of CNE-2 cells decreased measurably. Results from the flow cytometry assay suggested that CUL3 might participate in the proliferation of NPC cells by modulating cell cycle distribution together with PCNA, another cell cycle-related marker for proliferating cells23,24. In accordance with our findings, existing evidence has revealed that human cell cycle progression is strictly controlled by the ubiquitin–proteasome system and that CUL3 is essential for the correct mitotic division process25. Taken together, we suggest that CUL3 may enhance the proliferation of NPC cells by regulating cell cycle distribution through the CRL-based ubiquitin–proteasome system.
Results from the migration and invasion analyses demonstrated that decreased CUL3 expression could slow down cellular migration and invasion in NPC. As for the mechanism involved, EMT has been well established as a regulator in tumor progression, which provides mobility to cancer cells in order to achieve metastasis26,27. Accordingly, we investigated the expression level of EMT-associated biomarkers in CUL3 knockdown or overexpressed NPC cells. We found that depletion of CUL3 expression upregulated E-cadherin expression and downregulated the expression of N-cadherin and vimentin, demonstrating a potential inhibition of cellular migration and invasion in NPC. Hence, it is reasonable to speculate that CUL3 may promote NPC metastasis and progression by regulating EMT-based cellular adhesion and mobility through the ubiquitin–proteasome system, though the precise mechanism remains unidentified.
To date, application of the CUL3 inhibitor in the management of CUL3+ cancers has not been well documented, and an increasing number of genes have been explored for their relation to the tumorigenesis and progression of NPC. Therefore, we suggest a more rigorous workup regarding molecular analysis of biomarkers, including CUL3, in NPC patients to identify patients with a poor prognosis, which may help clinicians modify treatment protocols for different NPC patients. Meanwhile, further studies regarding the CUL3-based ubiquitin proteasome pathway in NPC may open new avenues for finding novel drug targets that can limit NPC progression.
Despite being a retrospective observation, which may reveal some limitations in retrieving paraffin-embedded tumor samples and cause some selection bias during the study, we believe that a sample size of 254 comparable NPC patients and a mean follow-up of 80 months are enough to explore the role of CUL3 expression on the prognosis of NPC patients. However, results from the current study still need further attention.
In conclusion, the present study elucidated that CUL3 overexpression is related to a poor patient prognosis and aggressive biological behaviors in NPC, indicating that CUL3 could act as a new possible treatment target for advanced NPC. Additional studies of the CUL3-based ubiquitin proteasome pathway may hopefully find possible drug targets that can limit NPC progression.
ACKNOWLEDGMENTS
The present study was supported by funds from the 255 Medical Project of Hunan Province (2014, G. Tan) and by the National Science Foundation for Distinguished Young Scholars of China (Grant No. 81502358).
Footnotes
The authors declare no conflicts of interest.
REFERENCES
- 1. Jemal A, Bray F, Center MM, Ferlay J, Ward E, Forman D. Global cancer statistics. CA Cancer J Clin. 2011;61(2):69–90. [DOI] [PubMed] [Google Scholar]
- 2. Chang ET, Adami HO. The enigmatic epidemiology of nasopharyngeal carcinoma. Cancer Epidemiol Biomarkers Prev. 2006;15(10):1765–77. [DOI] [PubMed] [Google Scholar]
- 3. Razak AR, Siu LL, Liu FF, Ito E, O’Sullivan B, Chan K. Nasopharyngeal carcinoma: The next challenges. Eur J Cancer 2010;46(11):1967–78. [DOI] [PubMed] [Google Scholar]
- 4. Blanchard P, Lee A, Marguet S, Leclercq J, Ng WT, Ma J, Chan AT, Huang PY, Benhamou E, Zhu G, Chua DT, Chen Y, Mai HQ, Kwong DL, Cheah SL, Moon J, Tung Y, Chi KH, Fountzilas G, Zhang L, Hui EP, Lu TX, Bourhis J, Pignon JP; MAC-NPC Collaborative Group. Chemotherapy and radiotherapy in nasopharyngeal carcinoma: An update of the MAC-NPC meta-analysis. Lancet Oncol. 2015;16(6):645–55. [DOI] [PubMed] [Google Scholar]
- 5. Li W, Tan G, Ma Y, Li H, He G. Inhibition of alpha folate receptor resulting in a reversal of taxol resistance in nasopharyngeal carcinoma. Otolaryngol Head Neck Surg. 2012;146(2):250–8. [DOI] [PubMed] [Google Scholar]
- 6. Chen HY, Chen RH. Cullin 3 Ubiquitin ligases in cancer biology: Functions and therapeutic implications. Front Oncol. 2016;6:113. [DOI] [PMC free article] [PubMed] [Google Scholar]
- 7. Genschik P, Sumara I, Lechner E. The emerging family of CULLIN3-RING ubiquitin ligases (CRL3s): Cellular functions and disease implications. EMBO J. 2013;32(17):2307–20. [DOI] [PMC free article] [PubMed] [Google Scholar]
- 8. Grau L, Luque-Garcia JL, Gonzalez-Peramato P, Theodorescu D, Palou J, Fernandez-Gomez JM, Sanchez-Carbayo M. A quantitative proteomic analysis uncovers the relevance of CUL3 in bladder cancer aggressiveness. PLoS One 2013;8(1):e53328. [DOI] [PMC free article] [PubMed] [Google Scholar]
- 9. Haagenson KK, Tait L, Wang J, Shekhar MP, Polin L, Chen W, Wu GS. Cullin-3 protein expression levels correlate with breast cancer progression. Cancer Biol Ther. 2012;13(11):1042–6. [DOI] [PMC free article] [PubMed] [Google Scholar]
- 10. Yuan WC, Lee YR, Huang SF, Lin YM, Chen TY, Chung HC, Tsai CH, Chen HY, Chiang CT, Lai CK, Lu LT, Chen CH, Gu DL, Pu YS, Jou YS, Lu KP, Hsiao PW, Shih HM, Chen RH. A cullin3-KLHL20 ubiquitin ligase-dependent pathway targets PML to potentiate HIF-1 signaling and prostate cancer progression. Cancer Cell 2011;20(2):214–28. [DOI] [PubMed] [Google Scholar]
- 11. Wang J, Zhu ZH, Yang HB, Zhang Y, Zhao XN, Zhang M, Liu YB, Xu YY, Lei QY. Cullin 3 targets methionine adenosyltransferase IIalpha for ubiquitylation-mediated degradation and regulates colorectal cancer cell proliferation. FEBS J. 2016;283(13):2390–402. [DOI] [PubMed] [Google Scholar]
- 12. Martinez VD, Vucic EA, Thu KL, Pikor LA, Lam S, Lam WL. Disruption of KEAP1/CUL3/RBX1 E3-ubiquitin ligase complex components by multiple genetic mechanisms: Association with poor prognosis in head and neck cancer. Head Neck 2015;37(5):727–34. [DOI] [PubMed] [Google Scholar]
- 13. Lee AW, Ma BB, Ng WT, Chan AT. Management of nasopharyngeal carcinoma: Current practice and future perspective. J Clin Oncol. 2015;33(29):3356–64. [DOI] [PubMed] [Google Scholar]
- 14. Livak KJ, Schmittgen TD. Analysis of relative gene expression data using real-time quantitative PCR and the 2−ΔΔCT method. Methods 2001;25(4):402–8. [DOI] [PubMed] [Google Scholar]
- 15. Serrano MJ, Ortega FG, Alvarez-Cubero MJ, Nadal R, Sanchez-Rovira P, Salido M, Rodriguez M, Garcia-Puche JL, Delgado-Rodriguez M, Sole F, García MA, Perán M, Rosell R, Marchal JA, Lorente JA. EMT and EGFR in CTCs cytokeratin negative non-metastatic breast cancer. Oncotarget 2014;5(17):7486–97. [DOI] [PMC free article] [PubMed] [Google Scholar]
- 16. Shibata T, Ohta T, Tong KI, Kokubu A, Odogawa R, Tsuta K, Asamura H, Yamamoto M, Hirohashi S. Cancer related mutations in NRF2 impair its recognition by Keap1-Cul3 E3 ligase and promote malignancy. Proc Natl Acad Sci USA 2008;105(36):13568–73. [DOI] [PMC free article] [PubMed] [Google Scholar]
- 17. Masuda M, Shinokuma A, Hirakawa N, Nakashima T, Komiyama S. Expression of bcl-2-, p53, and Ki-67 and outcome of patients with primary nasopharyngeal carcinomas following DNA-damaging treatment. Head Neck 1998;20(7):640–4. [DOI] [PubMed] [Google Scholar]
- 18. Zheng X, Hu L, Chen F, Christensson B. Expression of Ki67 antigen, epidermal growth factor receptor and Epstein-Barr virus-encoded latent membrane protein (LMP1) in nasopharyngeal carcinoma. Eur J Cancer B Oral Oncol. 1994;30B(5):290–5. [DOI] [PubMed] [Google Scholar]
- 19. Taheri-Kadkhoda Z, Magnusson B, Svensson M, Mercke C, Björk-Eriksson T. Expression modes and clinical manifestations of latent membrane protein 1, Ki-67, cyclin-B1, and epidermal growth factor receptor in nonendemic nasopharyngeal carcinoma. Head Neck 2009;31(4):482–92. [DOI] [PubMed] [Google Scholar]
- 20. Zhang J, Liu Y, Deng Y, He J, Lang J, Fan J. Ki67 and nm23 are potential prognostic markers in patients with nasopharyngeal carcinoma. Int J Clin Exp Pathol. 2016;9(6):6350–6. [Google Scholar]
- 21. Huo X, Li S, Shi T, Suo A, Ruan Z, Guo H, Yao Y. Cullin 3 promotes breast cancer cells metastasis and epithelial-mesenchymal transition by targeting BRMS1 for degradation. Oncotarget 2015;6(39):41959–75. [DOI] [PMC free article] [PubMed] [Google Scholar]
- 22. Dorr C, Janik C, Weg M, Been RA, Bader J, Kang R, Ng B, Foran L, Landman SR, O’Sullivan MG, Steinbach M, Sarver AL, Silverstein KA, Largaespada DA, Starr TK. Transposon mutagenesis screen identifies potential lung cancer drivers and CUL3 as a tumor suppressor. Mol Cancer Res. 2015;13(8):1238–47. [DOI] [PMC free article] [PubMed] [Google Scholar]
- 23. Strzalka W, Ziemienowicz A. Proliferating cell nuclear antigen (PCNA): A key factor in DNA replication and cell cycle regulation. Ann Bot. 2011;107(7):1127–40. [DOI] [PMC free article] [PubMed] [Google Scholar]
- 24. Guzinska-Ustymowicz K, Pryczynicz A, Kemona A and Czyzewska J. Correlation between proliferation markers: PCNA, Ki-67, MCM-2 and antiapoptotic protein Bcl-2 in colorectal cancer. Anticancer Res. 2009;29:3049–52. [PubMed] [Google Scholar]
- 25. Sumara I, Quadroni M, Frei C, Olma MH, Sumara G, Ricci R, Peter M. A Cul3-based E3 ligase removes Aurora B from mitotic chromosomes, regulating mitotic progression and completion of cytokinesis in human cells. Dev Cell 2007;12(6):887–900. [DOI] [PubMed] [Google Scholar]
- 26. Singh A, Settleman J. EMT, cancer stem cells and drug resistance: An emerging axis of evil in the war on cancer. Oncogene 2010;29(34):4741–51. [DOI] [PMC free article] [PubMed] [Google Scholar]
- 27. Thiery JP. Epithelial-mesenchymal transitions in development and pathologies. Curr Opin Cell Biol. 2003;15(6):740–6. [DOI] [PubMed] [Google Scholar]


