Abstract
Recent evidence suggests that dysregulation of microRNAs is associated with the development of multiple malignancies. miR-186 has been reported as a critical cancer regulator in several types of cancers. However, its functional significance and molecular mechanism underlying renal cell carcinoma (RCC) remain unknown. In this study, our results showed that miR-186 expression was dramatically downregulated in RCC tissues and cell lines compared to that in adjacent normal tissues and cell lines. Overexpression of miR-186 significantly inhibited cell growth, colony formation, and cell invasion; caused cell cycle arrest at the G0/G1 phase; and induced cell apoptosis as detected by MTT, colony formation, Transwell assay, and flow cytometry assays in RCC cells. In addition, inhibition of miR-186 expression promoted RCC cell proliferation, invasion, and cell cycle progression and reduced apoptosis. Bioinformatics analysis and luciferase reporter assay confirmed that the 3′-UTR of sentrin-specific protease 1 (SENP1) was a direct target of miR-186. A remarkably reverse correlation was observed between miR-186 and SENP1 mRNA in RCC tissues. Furthermore, immunohistochemical staining revealed that SENP1 was positively expressed in RCC specimens. Restoration of SENP1 expression could partially abrogate the inhibitory effect of miR-186 overexpression on RCC cell proliferation through activating NF-κB signaling and its downstream proteins. These data demonstrated that miR-186 acted as a novel tumor suppressor and potential therapeutic biomarker in the progression of RCC by directly targeting SENP1.
Key words: Renal cell carcinoma (RCC), miR-186, SENP1, Proliferation, Tumor suppressor
INTRODUCTION
Renal cell carcinoma (RCC) is the most common malignant tumor and is recognized as the sixth leading cause of cancer death worldwide, and the number of patients diagnosed with RCC is steadily increasing every year1. Although early localized RCC patients who received surgical resection usually have a satisfied prognosis, most patients are initially diagnosed with RCC in the advanced stages, which has already metastasized and is refractory to standard treatments2. Furthermore, advanced RCC is resistant to chemotherapy and radiotherapy; thus, emerging targeted therapies such as temsirolimus, axitinib, pazopanib, and sorafenib have been widely used to improve and prolong the survival of RCC patients3. However, these treatment strategies are not sufficient for patients with metastasis or relapse. A better understanding of the molecular pathways involved in RCC progression and metastasis is urgently needed4.
MicroRNAs (miRNAs) are classified as small noncoding RNAs and are 21–23 nucleotides in length5. They could modulate gene expression by direct binding to the complementary sites of mRNAs to promote their degradation or repress the functional protein translation from their transcripts6. A single miRNA processes various different target mRNAs and has been identified to participate in regulating many complex human diseases7. Thus, the dysregulation of miRNAs has been reported to be of particular importance and plays a crucial role during multiple tumorigenesis8. Growing studies have emphasized that miRNAs served as tumor suppressors or oncogenes in the progression and development of RCC. For instance, some miRNAs, such as miR-203a and miR-21, are overexpressed in RCC cells and contribute to cell proliferation and invasion during RCC development9,10. Some miRNAs like 148a and miR-22 have been reported to be downregulated in RCC tissues, but whose exogenous expression could dramatically suppress tumor proliferation11,12. Consequently, exploring RCC-related miRNAs will facilitate an understanding of the pathogenesis of RCC, and elucidation of their functions could achieve promising diagnosis and prognosis in RCC treatment13.
Previous studies have identified that miR-186 was associated with the suppression of cell proliferation and metastasis in different cancers, including prostate cancer, colorectal cancer, and cervical cancer14. However, whether miR-186 also functions as a tumor suppressor during RCC development still remains unknown. The purpose of this study was to explore the biological significance of miR-186 and tentatively investigate its potential mechanism during RCC progression. We observed that miR-186 expression was noticeably downregulated in RCC tissues and cell lines. Cell growth, cell cycle, and cell migration were significantly inhibited, but cell apoptosis was induced by the ectopic expression of miR-186 in RCC cells. Furthermore, we identified if the role of miR-186 as a tumor suppressor regulated NF-κB signaling in RCC progression by targeting SENP1.
MATERIALS AND METHODS
RCC Tissue Specimen Collection
Primary RCC tissue samples and corresponding adjacent normal renal tissues were obtained from 20 patients who underwent surgery in the China–Japan Union Hospital of Jilin University between September 2014 and July 2015. None of the patients had undergone chemotherapy or radiotherapy before surgery. All the tissue specimens were immediately collected for future investigation. This study was approved by the research ethics committee of China–Japan Union Hospital of Jilin University. Written informed consent was obtained from all patients before sample collection.
Cell Culture
Human RCC cell lines (786-O, A498, ACHN, Caki-1, and UMRC-3) and the normal renal cell line HK-2 were purchased from the American Type Culture Collection (ATCC; Rockville, MD, USA). All cell lines were cultured in Dulbecco’s modified Eagle’s medium (DMEM; Gibco, NY, USA) supplemented with 10% fetal bovine serum (FBS; Gibco) and 1% penicillin/streptomycin in a humidified incubator containing 5% CO2 at 37°C.
Transfection of miRNA and Plasmid
The miR-186 mimic (miR-186), a mimic negative control (mimic-NC), miR-186 inhibitor (miR-186-in), and an inhibitor negative control (inhibitor-NC) were synthesized from GenePharma (Shanghai, P.R. China). The SENP1 sequence was amplified and subcloned into the pcDNA3.1 vector (Life Technologies, Carlsbad, CA, USA); empty pcDNA vector was used as a negative control. Transfection of miRNAs or plasmid was performed using Lipofectamine 2000 (Invitrogen, Carlsbad, CA, USA) according to the manufacturer’s procedure.
Reverse Transcription Quantitative Polymerase Chain Reaction (RT-qPCR) Assay
Total RNA was extracted from tissues and cells using TRIzol reagent (Invitrogen) according to the manufacturer’s instructions. For miRNA and SENP1 reverse transcription, Prime Script RT Reagent Kit (Takara, Dalian, P.R. China) was used to synthesize cDNA. RT-qPCR analysis of miR-186 and SENP1 mRNA quantifications were performed using miRNA qPCR Detection Kit (Applied Biosystems, Carlsbad, CA, USA) and SYBR Green Master Mix (Applied Biosystems), respectively, on an ABI 7900 HT Sequence Detection System (Applied Biosystems). The U6 gene and GAPDH were used as internal controls. The relative expressions of miR-186 and SENP1 mRNA were analyzed by the 2−ΔΔCt method. The primers for SENP1 were 5′-GAC CAC TCA GCC TTC CTT CT-3′ (forward) and 5′-ACA GGC AAA ATT TCC CGC AT-3′ (reverse). The primers for GAPDH were 5′-CAG GCT GTA AAT GTC ACC GG-3′ (forward) and 5′-GAG TGG GAG CAC AGG TAA GT-3′ (reverse).
Western Blot Analysis
Tissue samples and cells were lysed using RIPA buffer (Boster, Wuhan, P.R. China). Total protein concentration was detected using a BCA Protein Assay Kit (Boster). Proteins (40 μg) were separated by 12% SDS-PAGE and transferred onto the polyvinylidene fluoride (PVDF) membranes (Bio-Rad, Carlsbad, CA, USA). Subsequently, the membranes were blocked with 5% nonfat milk for 2 h at room temperature and then incubated with the primary antibodies against SENP1, phosphorylation (p)-p65, p65, p-IκBα, IκBα, p21, MMP9, Bcl-2, cyclin D1, and GAPDH (Santa Cruz Biotechnology, Santa Cruz, CA, USA) overnight at 4°C. After rinsing, the membrane was incubated with the corresponding horseradish peroxidase (HRP)-conjugated secondary antibodies (Santa Cruz Biotechnology) for 2 h at room temperature. GAPDH was used as internal control. The bands were visualized with ECL Chemiluminescence Kit (Pierce, Rockford, IL, USA) and quantified using ImageJ software.
Immunohistochemical Staining
The clinical specimens were embedded into paraffin and cut into 5-μm-thick sections and then deparaffinized in xylol, rehydrated in gradient alcohol series. Endogenous peroxidase activity was blocked with 3% H2O2–methanol for 10 min. After rinsing, the slides were blocked with normal goat serum for 1 h to avoid nonspecific binding and then incubated with anti-human SENP1 rabbit polyclonal antibody (Santa Cruz Biotechnology) overnight at 4°C. The slides were then incubated with biotinylated goat anti-rabbit secondary antibody for 1 h and 3,3′-diaminobenzidine (DAB) solution was added for 30 s, followed by counterstaining with hematoxylin for 1 min. Immunostaining was evaluated by two independent investigators according to a scoring method described previously15.
Cell Proliferation Assay
For the 3-(4,5-dimethylthiazol-2-yl)-2-5 diphenyltetrazolium bromide (MTT) assay, 48 h after transfection, ACHN cells were seeded into a 96-well plate at a density of 3 × 10³ per well and then cultured for 96 h. MTT (5 mg/ml; Promega, Madison, WI, USA) solution was then added, and the cells were incubated for an additional 4 h. The medium was removed, and the MTT formazan was dissolved in dimethyl sulfoxide (150 μl/well). The absorbance was determined at 490 nm with a microplate reader.
For the calculation of the inhibitory concentration (IC50) value of the NF-κB inhibitor pyrrolidine dithiocarbamate (PDTC; Sigma-Aldrich, St. Louis, MO, USA), the ACHN cells were plated at a density of 1 × 10⁵ cells/well in 96-well plates. Cytotoxicity studies were performed 24 h after treating cells with various concentrations (12.5, 25, 50, 75, 100, 125, 150 nmol/L) of the PDTC using MTT assays as described above. IC50 values were determined using Microsoft Excel 2010.
Colony Formation Assay
For the colony formation assay, 48 h after transfection, 1 × 10³ ACHN cells were plated into six-well plates and incubated for 10 days. Cells were then rinsed with PBS and fixed with 4% formaldehyde for 15 min at room temperature. The cells were stained with 1% crystal violet for 10 min. The colony numbers (>50 cells) were counted randomly in five fields by an inverted microscope (Olympus, Tokyo, Japan).
Cell Cycle Assay
To assess cell cycle distribution, 1 × 10⁵ ACHN cells were plated into six-well plates and transfected with miRNAs for 36 h, and then were collected and fixed in 70% ice-cold ethanol at 4°C overnight. After rinsing, cells were stained with propidium iodide (PI; 50 mg/ml; Sigma-Aldrich) and RNase A (50 mg/ml) in the dark for 1 h at room temperature. The cell cycle distribution was analyzed by flow cytometry (BD Biosciences, San Jose, CA, USA).
Apoptosis Assay
Cell apoptosis was analyzed with Annexin-V-FITC/PI Apoptosis Detection Kit (BD Biosciences) following the manufacturer’s guideline. Thirty-six hours after transfection, the ACHN cells were collected and centrifuged at 1,500 rpm for 5 min and then suspended in the binding buffer. Annexin V-FITC (5 μl) was added into each well and incubated for 15 min in the dark at room temperature, followed by treatment with 5 μl of PI for 5 min. Cell apoptosis rate analysis was performed by flow cytometry (BD Biosciences).
Invasion Assay
The cell invasion assay was performed using Transwell chambers with an 8-μm pore size (Millipore, Temecula, MA, USA). Transfected cells (1 × 10⁵) suspended in serum-free DMEM were added into the top chamber coated with Matrigel (BD Biosciences). Then DMEM with 10% FBS was added to the bottom chamber as a chemoattractant. After incubation for 24 h at 37°C, the cells remaining in the upper chamber were slightly removed with a cotton swab. Cells that invaded to the bottom chamber were fixed with 4% paraformaldehyde for 30 min and stained with crystal violet for 20 min. Invading cells were imaged and counted in five random fields by an inverted microscope (Olympus).
Bioinformatics and Dual-Luciferase Reporter Gene Assay
The online bioinformatics database (TargetScan, http://www.targetscan.org/vert_60/) was used to predict the binding sites of miR-186. The wild-type (WT) or mutant (MU) 3′-untranslated region (3′-UTR) of SENP1 was inserted into the pGL3 vector (Promega). The RCC cells were cotransfected with WT or mutated SENP1 3′-UTR vectors and miR-186 mimic, mimic-NC, miR-186 inhibitor, or inhibitor-NC using Lipofectamine 2000 (Invitrogen). After 24 h of transfection, luciferase activity was normalized with a Renilla luciferase reference plasmid and assessed by a Dual-Luciferase Reporter Assay Kit (Promega) according to the manufacturer’s instructions.
Statistical Analysis
The data are presented as mean ± standard deviation (SD); each experiment was performed at least three times. Statistical analysis was determined by two-tailed Student’s t-test of GraphPad Prism 5.0 software (La Jolla, CA, USA). The correlation between miR-186 expression and the SENP1 mRNA expression was evaluated by Spearman’s correlation coefficient analysis. A value of p < 0.05 was considered statistically significant.
RESULTS
miR-186 Was Downregulated in RCC Tissues and Cell Lines
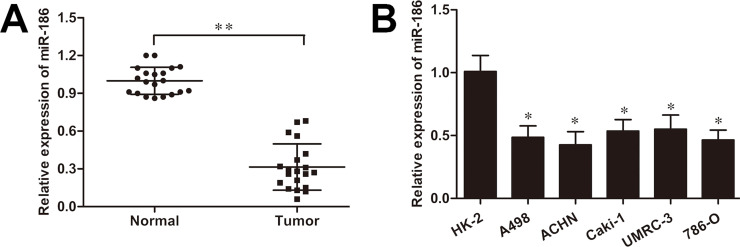
To demonstrate the function of miR-186 in the RCC progression, first the expression level of miR-186 was detected in 20 RCC tissue samples and their paired normal tissues. The RT-qPCR analysis showed that the miR-186 expression was dramatically reduced in RCC tissues compared with that in the adjacent normal tissues (p < 0.01) (Fig. 1A). Moreover, we observed that the miR-186 expression was also significantly increased in five human renal cancer cell lines (786-O, A498, ACHN, Caki-1, and UMRC-3) compared to that in the control cell line HK-2 cells (all p < 0.05) (Fig. 1B), which indicated a possible antitumor effect of miR-186 in RCC development.
Figure 1.
MicroRNA-186 (miR-186) is downregulated in renal cell carcinoma (RCC) cells and tissues. (A) Reverse transcription quantitative polymerase chain reaction (RT-qPCR) analysis of miR-186 expression in 20 paired RCC tissue samples and adjacent normal tissues. (B) Relative miR-186 expression in human RCC cell lines (786-O, A498, ACHN, Caki-1, and UMRC-3) and the control cell line HK-2. U6 was used for normalization. *p < 0.05, **p < 0.01 versus control.
miR-186 Inhibits Cell Proliferation in RCC Cells
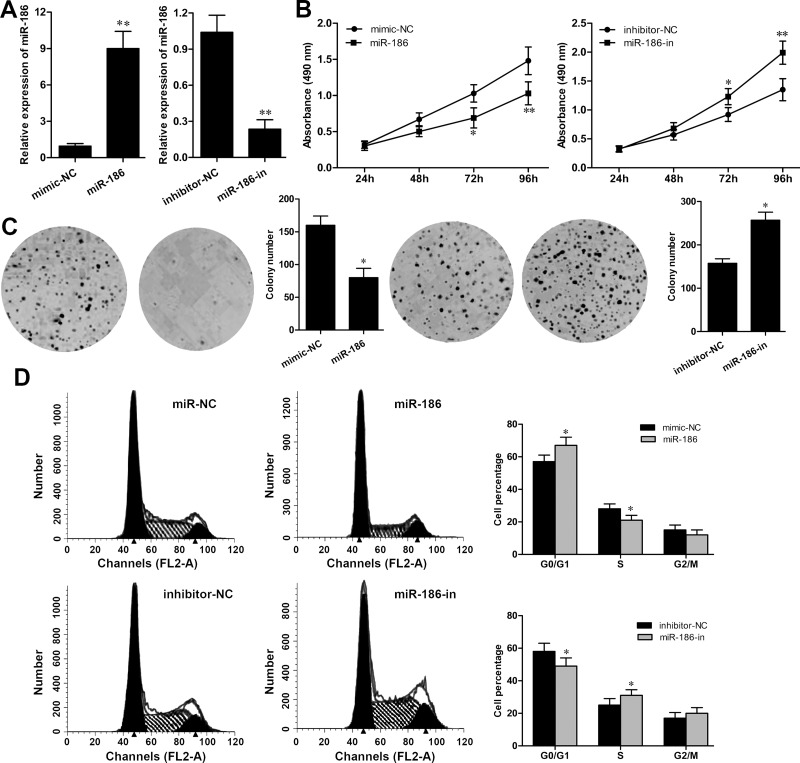
To explore the influence of miR-186 in RCC development, ACHN cells were selected and transfected with equal amounts of miR-186, mimic-NC, miR-186-in, or inhibitor-NC. The high efficiency of the transfection was evaluated after transfection for 48 h by RT-qPCR. As shown in Figure 2A, the expression of miR-186 in ACHN cells with mimic transfection was significantly upregulated (p < 0.01), whereas its expression was noticeably downregulated in the miR-186-in group (p < 0.01) (Fig. 2A). Subsequently, the MTT assay showed that the overexpression of miR-186 obviously inhibited ACHN cell growth rate (p < 0.01) and the miR-186 inhibitor significantly promoted ACHN cell growth rate (p < 0.01) (Fig. 2B). The colony formation assay also revealed that ACHN cells transfected with mimic formed decreased number of colonies compared with that in the mimic-NC group (p < 0.05). The colony formation ability of ACHN cells transfected with the miR-186 inhibitor was significantly increased when compared to that in the inhibitor-NC group (p < 0.05) (Fig. 2C). Furthermore, flow cytometry analysis of cell cycle distribution revealed that overexpression of miR-186 obviously induced G0/G1 phase arrest (p < 0.05), whereas miR-186 inhibitor transfection significantly promoted cell cycle progression by increasing the S phase in ACHN cells (Fig. 2D).
Figure 2.
miR-186 inhibits cell proliferation in RCC cells. (A) The expression of miR-186 in ACHN cells transfected with the miR-186 mimic or miR-186 inhibitor was detected by RT-qPCR. (B) Cell growth rate in ACHN cells transfected with the miR-186 mimic or miR-186 inhibitor was detected by MTT assay. (C) The number of colonies in ACHN cells transfected with the miR-186 mimic or miR-186 inhibitor was measured by colony formation assay. (D) Cell cycle distribution in ACHN cells transfected with the miR-186 mimic or miR-186 inhibitor was analyzed by flow cytometry assay. *p < 0.05, **p < 0.01 versus the NC group.
miR-186 Suppresses Invasion and Enhances Cell Apoptosis in RCC Cells
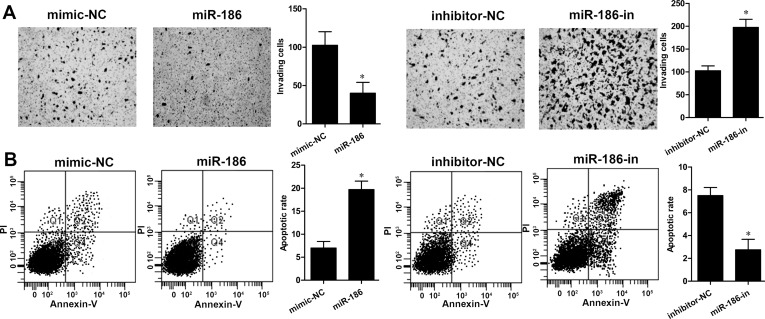
To examine whether miR-186 regulates cell invasion of RCC cells, a Transwell assay was performed. We found that overexpression of miR-186 markedly suppressed the cell invasive abilities of ACHN cells (p < 0.05), whereas inhibition of miR-186 expression enhanced ACHN cell invasion (p < 0.05) (Fig. 3A). Furthermore, the cell apoptosis assay revealed that overexpression of miR-186 significantly induced cell apoptosis in ACHN cells compared with the mimic-NC group. On the other hand, the rate of cell apoptosis was remarkably decreased in ACHN cells with miR-186-in transfection (p < 0.01) (Fig. 3B). These findings suggested that miR-186 overexpression inhibited cell invasion and induced apoptosis in ACHN cells.
Figure 3.
miR-186 suppresses invasion and enhances cell apoptosis in RCC cells. (A) Cell invasive ability of ACHN cells transfected with the miR-186 mimic or miR-186 inhibitor was determined by Transwell assay. (B) Cell apoptosis in ACHN cells transfected with the miR-186 mimic or miR-186 inhibitor was detected by flow cytometry analysis. *p < 0.05 versus the NC group.
SENP1 Is a Potential Target of miR-186
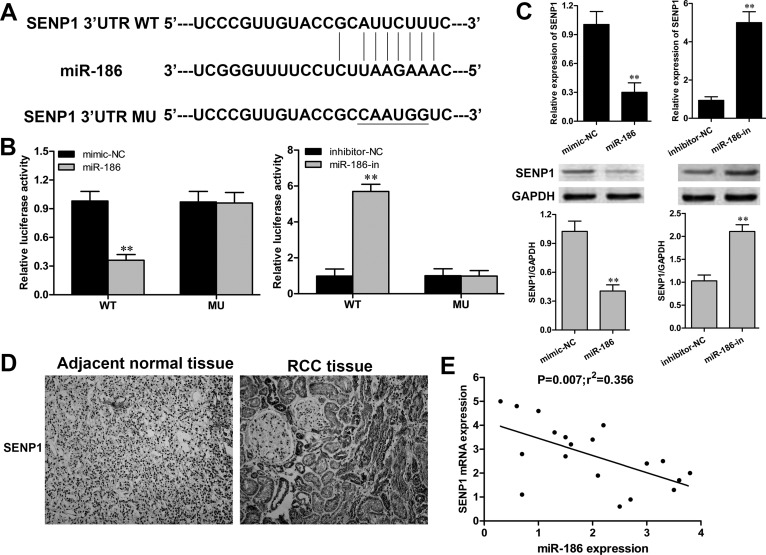
A bioinformatics method of the available database (TargetScan) was performed to predict the potential mRNA target of miR-186. The 3′-UTR of SENP1 was identified as a putative target of miR-186 (Fig. 4A). To validate the direct targeting of miR-186 on SENP1 in RCC cells, the WT or MU 3′-UTR of SENP1 was cloned into the luciferase plasmid. The luciferase reporter assay revealed that cotransfection of ACHN cells with the miR-186 mimic and SENP1 WT 3′-UTR displayed a significant reduction in luciferase activity when compared to that in the mimic-NC group (p < 0.01) (Fig. 4B). In contrast, cotransfection of ACHN cells with miR-186-in and SENP1 WT 3′-UTR showed a significant enhancement on luciferase activity (p < 0.01). Furthermore, RT-qPCR and Western blot confirmed that overexpression of miR-186 could significantly suppress SENP1 expression in ACHN cells at both the mRNA and protein levels (Fig. 4C). Accordingly, we next determined the expression of SENP1 in 20 paired RCC clinical samples. The immunohistochemical staining assay demonstrated that SENP1 was positively expressed in 80% (16/20) of the RCC tissues, whereas it was negatively expressed in all cases of adjacent normal tissues (Fig. 4D). In addition, the relationship between miR-186 and SENP1 in the RCC tissue samples was investigated using linear regression. SENP1 mRNA was reversely correlated with miR-186 in RCC tissues (p = 0.007) (Fig. 4E). These data suggested that SENP1 was a direct target of miR-186 in RCC.
Figure 4.
miR-186 targeted the 3′-untranslated region (3′-UTR) of SENP1 and downregulated its expression. (A) The predicted binding site of miR-186 in the 3′-UTR of SENP1. (B) Luciferase activity of ACHN cells cotransfected with SENP1 wild-type (WT) 3′-UTR or SENP1 mutant (MU) 3′-UTR and miR-186 mimic or miR-186 inhibitor was determined by luciferase reporter assay. (C) The expression of SENP1 in ACHN cells transfected with the miR-186 mimic or miR-186 inhibitor was detected by RT-qPCR and Western blot. (D) Immunohistochemical staining (400×) assay analysis of the expression and distribution of SENP1 in RCC tissue samples. (E) Linear regression analysis of the correlation between SENP1 mRNA and miR-186 in RCC tissue samples. **p < 0.01 versus the NC group.
Restoration of SENP1 Abolished miR-186-Mediated Inhibition on RCC Cell Tumorigenesis
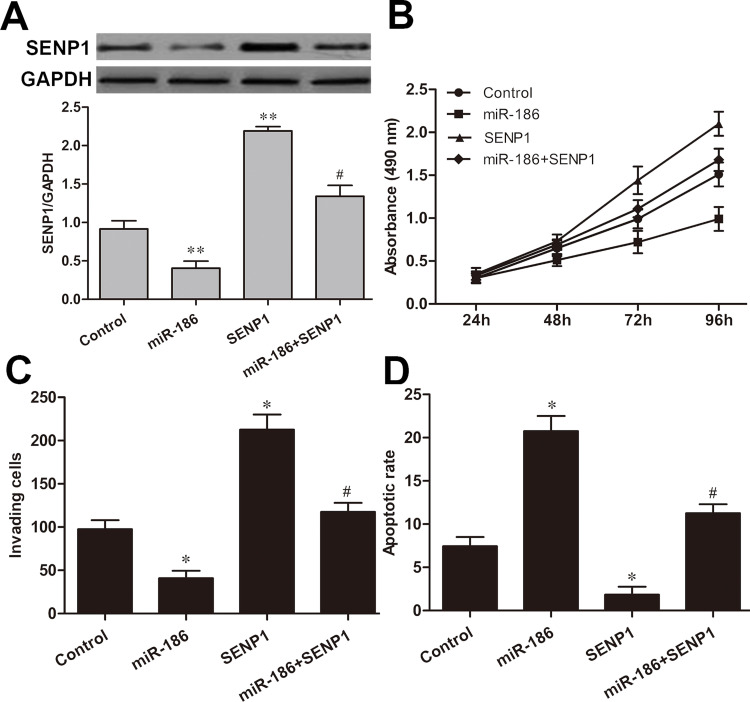
To further examine whether restoration of SENP1 in RCC cells could abrogate the inhibitory effect of miR-186 on RCC progression, we cotransfected ACHN cells with SENP1 expression plasmid and miR-186 mimic. The transfection efficiency was confirmed by Western blot analysis (Fig. 5A). Additionally, restoration of SENP1 expression significantly improved ACHN cell proliferation ability and partially abrogated inhibition of cell proliferation by miR-186 (Fig. 5B). Furthermore, we also found that restoration of SENP1 expression significantly promoted invasion and decreased apoptosis in ACHN cells (p < 0.05, respectively), but attenuated miR-186-induced inhibition of ACHN cell invasion (p < 0.05) (Fig. 5C) and miR-186-induced promotion of ACHN cell apoptosis (p < 0.05) (Fig. 5D).
Figure 5.
Restoration of SENP1 abolished the miR-186-mediated inhibition on RCC cell tumorigenesis. (A) The expression of SENP1 in ACHN cells cotransfected with the SENP1 vector and miR-186 mimic was detected by Western blot. (B) Cell proliferation of ACHN cells cotransfected with the SENP1 vector and miR-186 mimic was analyzed by MTT assay. (C) Cell invasive ability of ACHN cells cotransfected with the SENP1 vector and miR-186 mimic was measured by Transwell assay. (D) Cell apoptosis of ACHN cells cotransfected with the SENP1 vector and miR-186 mimic was determined by flow cytometry analysis. Control group: miR-NC + vector; miR-186 group: vector + miR-186; SENP1 group: miR-NC + SENP1; miR-186 + SENP1 group: miR-186 + SENP1. *p < 0.05, **p < 0.01 versus the control group; #p < 0.05 versus the miR-186 group.
miR-186 Inhibited the NF-κB Signaling Pathway via Downregulating SENP1 in RCC Cells
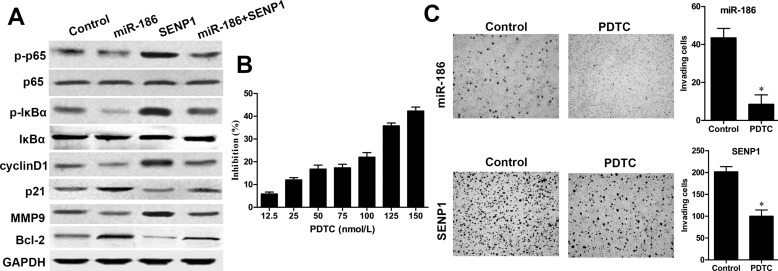
The NF-κB signaling pathway plays a critical role in RCC development, and SENP1 can positively activate NF-κB signaling16. Thus, whether miR-186 could regulate RCC progression via the NF-κB signaling pathway was determined by Western blot. We found that the expressions of p-IκBα and p-p65 levels were significantly decreased in ACHN cells with miR-186 mimic transfection when compared with those in the control group, whereas the total IκBα and p65 had no changes (Fig. 6A). On the contrary, restoration of SENP1 could reverse this inhibitory effect of p-IκBα and p-p65 caused by miR-186. Furthermore, the expressions of its downstream key proteins including cyclin D1 and MMP9 were significantly decreased, whereas p21 and Bcl-2 were significantly enhanced in ACHN cells with miR-186 mimic transfection, but partially reversed by restoration of SENP1 expression. In addition, to further evaluate whether the NF-κB signaling pathway is involved in miR-186-mediated cell invasion, Transwell assay was performed. The IC50 of the NF-κB inhibitor PDTC against ACHN cells was 228 nmol/L (Fig. 6B). ACHN cells were pretransfected with the miR-186 mimic or SENP1 vector and then treated with or without 50 μmol/L of NF-κB inhibitor PDTC (Sigma-Aldrich) for 24 h. After treatment with PDTC for 24 h, the numbers of ACHN cell invasion pretransfected with the miR-186 mimic or SENP1 vector were both remarkably decreased when compared to the control groups (p < 0.05, respectively) (Fig. 6C), indicating that the NF-κB signaling pathway plays a crucial role in the miR-186-mediated cell invasion.
Figure 6.
miR-186 inhibited the NF-κB signaling pathway via downregulating SENP1 in RCC cells. (A) The expression of key components of the NF-κB signaling pathway and its downstream factors in ACHN cells cotransfected with the SENP1 vector and miR-186 mimic was measured by Western blot analysis. Control group: miR-NC + vector; miR-186 group: vector + miR-186; SENP1 group: miR-NC + SENP1; miR-186 + SENP1 group: miR-186 + SENP1. GAPDH was used as internal control. (B) The inhibitory effect of pyrrolidine dithiocarbamate (PDTC) on ACHN cell viability was determined by MTT assay. ACHN cells were treated with different concentrations of PDTC for 24 h. (C) Invasive ability of ACHN cells pretransfected with the SENP1 vector or miR-186 mimic and treated with or without 50 nmol/L PDTC for 24 h was measured by Transwell assay. *p < 0.05 versus the control group.
DISCUSSION
Emerging evidence has declared that dysregulation of expression of miRNAs plays crucial roles in the pathological processes of RCC tumorigenesis, and multiple miRNAs are identified as suitable biomarkers for the diagnosis and prognosis of RCC patients17. Previous reports have shown that miR-186 is aberrantly expressed in various cancers. Drucker demonstrated that miR-186 is downregulated in non-small cell lung cancer and associated with chemoresistance18. Cao et al. have illustrated that miR-186 functions as a tumor suppressor on cell proliferation and invasion in human gastric cancer development19. Liu et al. suggested that downregulation of miR-186 suppresses apoptosis and promotes epithelial–mesenchymal transition in human cervical cancers14. Hua et al. reported that overexpression of miR-186 cells inhibited cell proliferation and arrested cell cycle in the G0/G1 phase during prostate cancer progression20.
In our study, we found that the expression of miR-186 was remarkably downregulated both in RCC tissue samples compared to paired normal tissues and in RCC cell lines compared to the normal renal cell line HK-2. Ectopic expression of miR-186 could dramatically suppress RCC cell growth, colony formation, and invasion; cause cell cycle at the G0/G1 phase arrest; and induce cell apoptosis. In addition, inhibition of miR-186 in RCC cells resulted in the promotion of cell proliferation and invasion, rapid cell cycle progression, and negligible apoptosis. Thus, these findings suggested that miR-186 functioned as a tumor suppressor in RCC development.
To further elucidate the molecular mechanisms by which miR-186 controls RCC biological behavior, bioinformatics algorithm TargetScan was used to identify the target of miR-186. We found that miR-186 could suppress cell proliferation by binding to the 3′-UTR of SENP1, which was a novel target for miR-186 in RCC cells. Small ubiquitin-like modifier (SUMO) is kind of ubiquitin-like protein that posttranslationally modifies the function of proteins21. Sumoylation is considered as a dynamic process and is easily reversed by a family of SUMO-specific proteases (SENPs). The SENPs could deconjugate the modified mature SUMO from their targeted proteins and thus plays a critical regulatory role in maintaining protein stability and normal physiological functions22. SUNO1/sentrin-specific protease 1 (SENP1) could particularly facilitate the maturation of SUMO1–3 by cleavage of these SUMO isoforms from modified proteins23. Recently, plenty of essential transcriptional factors and regulators such as SIRT1, p53, IκBα, and HIF-1α are proven to be the substrates of SENP1, suggesting that the function of SENP1 is involved in the cellular processes of development, mitosis, differentiation, and even carcinomas24.
SENP1 has been shown to have a pro-oncogenic role in many types of cancer. Wang et al. indicated that SENP1 is a marker of radioresistance, and modulation of SENP1 expression could inhibit proliferation of lung cancer cells25. Bawa-Khalfa et al. suggested that SENP1 exhibits carcinogenic properties by promoting androgen receptor-dependent cell proliferation and supports angiogenesis in prostate cancer26. Dong et al. clarified that SENP1 promotes cell growth via activating glycolysis in clear cell RCC27. In our study, miR-186 overexpression in RCC cells could significantly downregulate SENP1 mRNA and protein expressions. In addition, SENP1 was determined as the direct target of miR-186 in RCC cells using a luciferase report system. Correlation analysis revealed a negative association between miR-186 and SENP1 mRNA level in RCC tissues, which was further confirmed by the immunohistochemical staining of SENP1 in RCC tissues. The restoration of SENP1 expression compromised the miR-186-mediated repression of cell proliferation and invasion on RCC cells, indicating that inhibition of SENP1 is necessary for miR-186 to suppress RCC development. Therefore, SENP1 is a vital downstream target of miR-186 during the progression of RCC.
The aberrant activation of transcription factor NF-κB has been implicated in the involvement of various human cancers. NF-κB (p65) combines with IκB in the cytoplasm in its inactive form; under stimulation, IκBα is phosphorylated by IKKα/β and ubiquitination to release p6528. Afterward, activated NF-κB transcriptionally binds to a large set of target genes to promote their transcriptions and thus participate in tumor cell survival, proliferation, invasion, angiogenesis, and therapeutic resistance29. For instance, Bcl-2, as a proto-oncogene, negatively regulates cell apoptosis and has been identified to process a NF-κB binding site, which is directly regulated by p6530. Furthermore, SENP1 was observed to inhibit apoptosis and enhance cell proliferation of astroglioma and multiple myeloma cells through modulation of NF-κB signaling16. The present study showed that the ectopic expression of miR-165 repressed NF-κB signaling activation by dramatically reducing the expressions of p-p65, p-IkBα, and its downstream factors in RCC cells. Restoration of SENP1 expression partially abolished the inhibitory effect of miR-186 on NF-κB signaling activation in RCC cells. Furthermore, the NF-κB inhibitor PDTC significantly enhanced the inhibitory effect of miR-186 on RCC cell invasion and attenuated the SENP1-induced RCC cell invasion. These observations demonstrated that miR-186 inhibited NF-κB signaling and its downstream factors in RCC progression possibly through the regulation of SENP1 expression.
In summary, our results showed that miR-185 was significantly downregulated in RCC tissues and cell lines. Mechanism analysis revealed that ectopic expression of miR-186 noticeably suppressed cell proliferation and invasion, blocked G1-to-S phase transition, promoted cell apoptosis, and inhibited NF-κB signaling in RCC cells. We also identified that SENP1 was a direct target of miR-186, and SENP1 mRNA expression was reversely correlated with miR-186 in RCC tissues. All these findings highlighted the potentially crucial role of miR-186 in the diagnosis and treatment of RCC patients.
ACKNOWLEDGMENT
The authors would like to thank Dr. Yingying Liu for the valuable suggestions she provided. This work was supported by a grant [(2015) No. 512] from “Twelfth five-year” Science and Technology Research Project of Jilin Province Department Of Education Foundation and a grant (2015Q043) from Jilin province youth scientific research subject.
Footnotes
The authors declare no conflicts of interest.
REFERENCES
- 1. Moore LE, Wilson RT, Campleman SL. Lifestyle factors, exposures, genetic susceptibility, and renal cell cancer risk: A review. Cancer Invest. 2005;23(3):240–55. [DOI] [PubMed] [Google Scholar]
- 2. Ljungberg B, Campbell SC, Choi HY, Lee JE, Weikert S, Kiemeney LA. The epidemiology of renal cell carcinoma. Eur Urol. 2011;60(4):615–21. [DOI] [PubMed] [Google Scholar]
- 3. van der Veldt AA, Haanen JB, van den Eertwegh AJM, Boven E. Targeted therapy for renal cell cancer: Current perspectives. Discov Med. 2010;10(54):394–405. [PubMed] [Google Scholar]
- 4. Lee-Ying R, Heng D. Current management and future perspectives of metastatic renal cell carcinoma. Int J Urol. 2014;21(9):847–55. [DOI] [PubMed] [Google Scholar]
- 5. D’Angelo B, Benedetti E, Cimini A, Giordano A. MicroRNAs: A puzzling tool in cancer diagnostics and therapy. Anticancer Res. 2016;36(11):5571–5. [DOI] [PubMed] [Google Scholar]
- 6. Allegra A, Alonci A, Campo S, Penna G, Petrungaro A, Gerace D, Musolino C. Circulating microRNAs: New biomarkers in diagnosis, prognosis and treatment of cancer (review). Int J Oncol. 2012;41(6):1897–912. [DOI] [PubMed] [Google Scholar]
- 7. Li J, Yu Z, Li J, Sun R, Kan Q. MiR-935 promotes liver cancer cell proliferation and migration by targeting SOX7. Oncol Res. 2017;25(3):427–35. [DOI] [PMC free article] [PubMed] [Google Scholar]
- 8. Zen K, Zhang CY. Circulating microRNAs: A novel class of biomarkers to diagnose and monitor human cancers. Med Res Rev. 2012;32(2):326–48. [DOI] [PubMed] [Google Scholar]
- 9. Hu G, Lai P, Liu M, Xu L, Guo Z, Liu H, Li W, Wang G, Yao X, Zheng J, Xu Y. MiR-203a regulates proliferation, migration, and apoptosis by targeting glycogen synthase kinase-3beta in human renal cell carcinoma. Tumour Biol. 2014;35(11):11443–53. [DOI] [PubMed] [Google Scholar]
- 10. Lv L, Huang F, Mao H, Li M, Li X, Yang M, Yu X. MicroRNA-21 is overexpressed in renal cell carcinoma. Int J Biol Markers 2013;28(2):201–7. [DOI] [PubMed] [Google Scholar]
- 11. Zhang SL, Liu L. microRNA-148a inhibits hepatocellular carcinoma cell invasion by targeting sphingosine-1-phosphate receptor 1. Exp Ther Med. 2015;9(2):579–84. [DOI] [PMC free article] [PubMed] [Google Scholar]
- 12. Zhang S, Zhang D, Yi C, Wang Y, Wang H, Wang J. MicroRNA-22 functions as a tumor suppressor by targeting SIRT1 in renal cell carcinoma. Oncol Rep. 2016;35(1):559–67. [DOI] [PubMed] [Google Scholar]
- 13. Grange C, Collino F, Tapparo M, Camussi G. Oncogenic micro-RNAs and renal cell carcinoma. Front Oncol. 2014;4(1):49. [DOI] [PMC free article] [PubMed] [Google Scholar]
- 14. Liu C, Wang J, Hu Y, Xie H, Liu M, Tang H. Upregulation of kazrin F by miR-186 suppresses apoptosis but promotes epithelial-mesenchymal transition to contribute to malignancy in human cervical cancer cells. Chin J Cancer Res. 2017;29(1):45–56. [DOI] [PMC free article] [PubMed] [Google Scholar]
- 15. Li WF, Dai H, Ou Q, Zuo GQ, Liu CA. Overexpression of microRNA-30a-5p inhibits liver cancer cell proliferation and induces apoptosis by targeting MTDH/PTEN/AKT pathway. Tumour Biol. 2016;37(5):5885–95. [DOI] [PubMed] [Google Scholar]
- 16. Xia W, Tian H, Cai X, Kong H, Fu W, Xing W, Wang Y, Zou M, Hu Y, Xu D. Inhibition of SUMO-specific protease 1 induces apoptosis of astroglioma cells by regulating NF-kappaB/Akt pathways. Gene 2016;595(2):175–9. [DOI] [PubMed] [Google Scholar]
- 17. Sellitti DF, Doi SQ. MicroRNAs in renal cell carcinoma. Microrna 2015;4(1):26–35. [DOI] [PubMed] [Google Scholar]
- 18. Drucker BJ. Renal cell carcinoma: Current status and future prospects. Cancer Treat Rev. 2005;31(7):536–45. [DOI] [PubMed] [Google Scholar]
- 19. Cao C, Sun D, Zhang L, Song L. MiR-186 affects the proliferation, invasion and migration of human gastric cancer by inhibition of Twist1. Oncotarget 2016;7(48):79956–63. [DOI] [PMC free article] [PubMed] [Google Scholar]
- 20. Hua X, Xiao Y, Pan W, Li M, Huang X, Liao Z, Xian Q, Yu L. MiR-186 inhibits cell proliferation of prostate cancer by targeting GOLPH3. Am J Cancer Res. 2016;6(8):1650–60. [PMC free article] [PubMed] [Google Scholar]
- 21. Nayak A, Muller S. SUMO-specific proteases/isopeptidases: SENPs and beyond. Genome Biol. 2014;15(7):422. [DOI] [PMC free article] [PubMed] [Google Scholar]
- 22. Hay RT. SUMO-specific proteases: A twist in the tail. Trends Cell Biol. 2007;17(8):370–6. [DOI] [PubMed] [Google Scholar]
- 23. Drag M, Salvesen GS. DeSUMOylating enzymes—SENPs. IUBMB Life. 2008;60(11):734–42. [DOI] [PubMed] [Google Scholar]
- 24. Zhao J. Sumoylation regulates diverse biological processes. Cell Mol Life Sci. 2007;64(23):3017–33. [DOI] [PMC free article] [PubMed] [Google Scholar]
- 25. Wang RT, Zhi XY, Zhang Y, Zhang J. Inhibition of SENP1 induces radiosensitization in lung cancer cells. Exp Ther Med. 2013;6(4):1054–8. [DOI] [PMC free article] [PubMed] [Google Scholar]
- 26. Bawa-Khalfe T, Yang FM, Ritho J, Lin HK, Cheng J. Yeh ET. SENP1 regulates PTEN stability to dictate prostate cancer development. Oncotarget 2017;8(11):17651–64. [DOI] [PMC free article] [PubMed] [Google Scholar]
- 27. Dong B, Gao Y, Kang X, Gao H, Zhang J, Guo H, You MJ, Xue W, Cheng JYH. SENP1 promotes proliferation of clear cell renal cell carcinoma through activation of glycolysis. Oncotarget 2016;7(49):80435–49. [DOI] [PMC free article] [PubMed] [Google Scholar]
- 28. Yang Q, Wang B, Gao W, Huang S, Liu Z, Li W, Jia J. SIRT1 is downregulated in gastric cancer and leads to G1-phase arrest via NF-kappaB/Cyclin D1 signaling. Mol Cancer Res. 2013;11(12):1497–507. [DOI] [PubMed] [Google Scholar]
- 29. Lee CH, Jeon YT, Kim SH, Song YS. NF-kappaB as a potential molecular target for cancer therapy. Biofactors 2007;29(1):19–25. [DOI] [PubMed] [Google Scholar]
- 30. Catz SD, Johnson JL. Transcriptional regulation of bcl-2 by nuclear factor kappa B and its significance in prostate cancer. Oncogene 2001;20(50):7342–51. [DOI] [PubMed] [Google Scholar]


