

Abstract
Aerosols and droplets from expiratory events play an integral role in transmitting pathogens such as SARS-CoV-2 from an infected individual to a susceptible host. However, there remain significant uncertainties in our understanding of the aerosol droplet microphysics occurring during drying and sedimentation and the effect on the sedimentation outcomes. Here, we apply a new treatment for the microphysical behavior of respiratory fluid droplets to a droplet evaporation/sedimentation model and assess the impact on sedimentation distance, time scale, and particle phase. Above a 100 μm initial diameter, the sedimentation outcome for a respiratory droplet is insensitive to composition and ambient conditions. Below 100 μm, and particularly below 80 μm, the increased settling time allows the exact nature of the evaporation process to play a significant role in influencing the sedimentation outcome. For this size range, an incorrect treatment of the droplet composition, or imprecise use of RH or temperature, can lead to large discrepancies in sedimentation distance (with representative values >1 m, >2 m, and >2 m, respectively). Additionally, a respiratory droplet is likely to undergo a phase change prior to sedimenting if initially <100 μm in diameter, provided that the RH is below the measured phase change RH. Calculations of the potential exposure versus distance from the infected source show that the volume fraction of the initial respiratory droplet distribution, in this size range, which remains elevated above 1 m decreases from 1 at 1 m to 0.125 at 2 m.
Short abstract
Accurate, experimentally derived microphysical treatments of respiratory fluid droplets enable the robust modeling of sedimentation outcomes.
I. Introduction
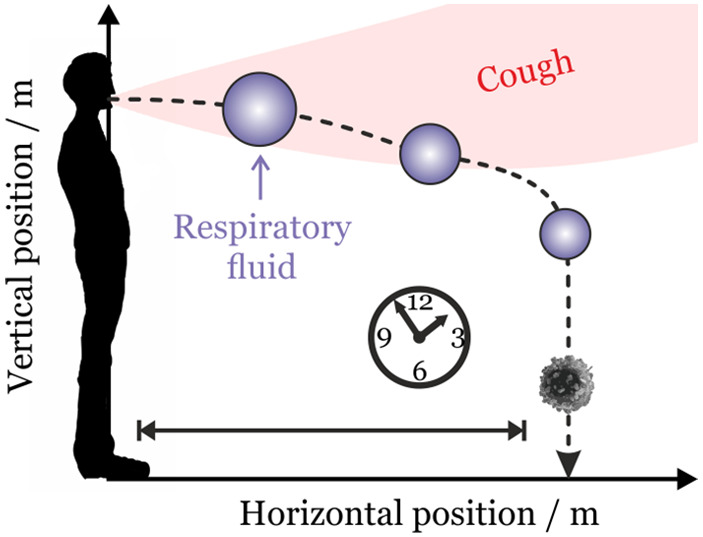
The transmission of respiratory pathogens such as SARS-CoV-2 can occur by direct (person-to-person) or indirect contact (through contaminated surfaces and fomites) and by airborne transmission.1,2 Aerosols and droplets play a crucial role in transmitting pathogens from an infected individual to a susceptible host, carrying the virus in large droplets (up to ∼500 μm) and small respirable aerosol particles (<5 μm diameter) from expiratory events including sneezing, coughing, talking, and even breathing.3,4 The transport of aerosols and droplets occurs over a distance determined by the interplay of forward momentum in an exhaled jet, droplet sedimentation, and evaporation.5−8 Beginning with Wells, and subsequently investigated by numerous authors, water droplets of order 100 μm diameter are predicted to sediment to the ground over a distance of 1–1.5 m from the average height of an adult before they completely evaporate, providing the rationale for guidelines on physical distancing.3,9,10 Water from smaller droplets can evaporate fully before sedimentation can occur, forming aerosol nuclei from any remaining involatile components which remain airborne for many minutes to hours.11
Despite the conventional delineation between droplets (particles >5 μm in diameter) and respirable aerosols (<5 μm), the exact picture is more complex, and this arbitrary threshold has been widely challenged. Most recently, Prather et al. have suggested that a more appropriate delineation between droplets and aerosols would be at 100 μm,12 a size that more appropriately reflects a change in aerodynamic behavior, the potential for inhalation, and the efficacy of nonpharmaceutical interventions such as physical distancing.13,14 Although approximately bimodal, the size distributions of small respirable particles (mass median aerodynamic diameter, MMAD, of ∼1–2 μm) and large droplets (MMAD 100 μm) are continuous with particles spanning all sizes.4,15 Indeed, we now know that over 99% of particles from an expiratory event are of respirable size already,4 dominating over the number of any aerosol nuclei formed from the evaporation of large droplets. The relative humidity (RH) in the mouth and upper respiratory tract can be very close to 100% although this may depend on disease state, and so droplets and aerosols begin their transport from the infected individual with high moisture content.15 Previous studies have suggested that particles can reduce in size by more than a factor of 2, depending on the ambient RH and the moisture content of the particles on exhalation.8 The buoyancy of the turbulent warm air cloud can lead to transport over much longer distances than previously anticipated for large droplets,5,6 and the air flow patterns in the room can lead to enhancements in the lifetime of suspended particles.8,16
Although our understanding of the transport of exhaled particles is advancing rapidly, there remain significant gaps in our knowledge of the droplet microphysics occurring during drying and sedimentation. In particular, the evaporation kinetics models are based on an assumption that the droplets are pure water or salt solution;3,5,8 there is little recognition that droplets could change phase during drying to form crystalline particles;3,17−19 and the interplay of ambient RH, drying rate, and moisture content on the final dried particle morphology is often not considered,5,9 particularly for droplets that contain a large fraction of mucins, high-molecular-weight, heavily glycosylated proteins. Not only could these microphysical properties impact the transported distance of droplets on exhalation through impacting on aerodynamic size, but they could also impact survival of viruses while airborne through influencing moisture content and particle phase. We address these uncertainties here.
II. Equilibrium Moisture Content of Respiratory Fluid Droplets
We have performed measurements of the hygroscopic response of artificial saliva and deep lung fluid (DLF) using the comparative kinetic electrodynamic balance approach on single aerosol droplets,20,21 described in detail in the Supporting Information. The artificial saliva recipe used (Table S1) is composed of a range of ionic components, with sodium chloride and potassium chloride the dominant components, a phosphate buffer, mucin, and Dulbecco’s modified Eagle’s medium (a synthetic cell culture medium that contains numerous components including amino acids, vitamins, and glucose).22 The artificial deep lung fluid recipe used (Table S1) is a complex mixture of phospholipids, cholesterol, proteins, and antioxidants.23 Although these artificial recipes do not reflect the biological complexity of real respiratory secretions, the variability between human subjects, and the possible dependence of composition on disease state, we have selected them as broadly representative of the ionic and organic components in human secretions, and to provide some clarity of the dependence of the hygroscopic response on chemical composition. We refer to these recipes directly as saliva and deep lung fluid below, although their comparability with real secretions must yet be addressed.
Using the comparative kinetic electrodynamic balance approach, hygroscopic growth curves for a water activity range from ∼0.5 up to ∼0.99 are reported in Figure 1a, along with equilibrium solution compositions (expressed as a mass fraction of solute) in Figure 1b, and compared with sodium chloride (NaCl) solution droplets. At steady state (equilibrium composition), and for droplets larger than 100 nm in diameter, the water activity in a solution droplet is equal to the environmental RH, neglecting the influence of droplet surface curvature.24 The diameter growth factor, GFd, is defined as the ratio of the wet droplet diameter at the specified RH to the dry particle diameter in the limit of no moisture content (0% RH). Using κ-Köhler theory,25 we can define the RH dependence of the equilibrium droplet diameter by
| 1 |
in the limit where surface curvature does not play a significant role in determining droplet vapor pressure, and the hygroscopic response can be represented by a single number defining the shape of the hygroscopic growth curve. It should be noted that this single-parameter treatment of hygroscopic growth is increasingly in error as the RH decreases, as is apparent in Figure 1a when a comparison is made with the comprehensive E-AIM model for aqueous sodium chloride droplets. κ values of 0.290 ± 0.01 and 0.208 ± 0.008 were inferred for artificial saliva and deep lung fluid, respectively, from the growth factors at 95% RH. As an indicator of degree of hygroscopicity, a value of 1.2 is commonly reported for NaCl solution droplets, and a value of <0.05 represents an organic aerosol of low hygroscopic growth.25
Figure 1.
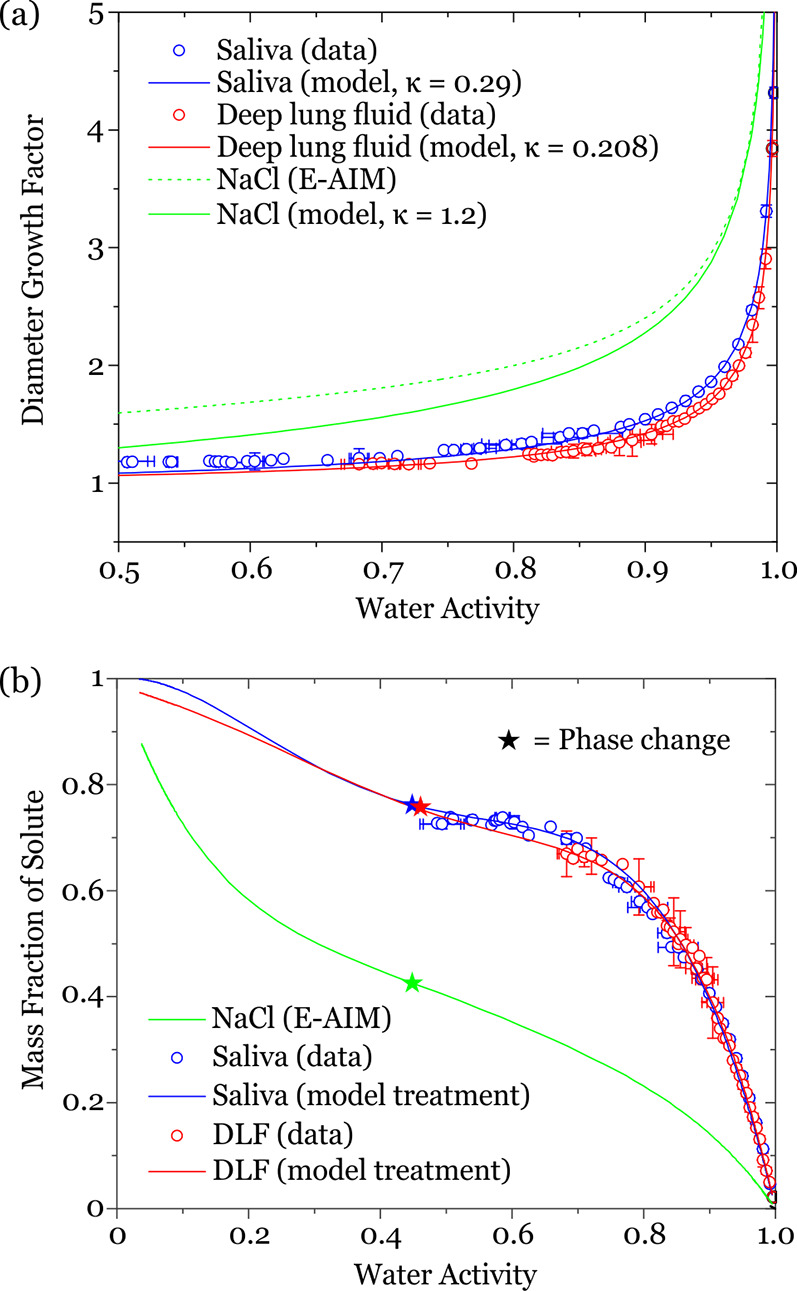
(a) Hygroscopic diameter growth curves for artificial saliva and deep lung fluid, compared with aqueous sodium chloride solution. (b) Dependence of equilibrium solution composition, represented as the variation in mass fraction of solute, on water activity, equivalent to RH. The stars indicate the water activity at which a phase change occurs.
It is clear from the model presented in Figure 1 that the saliva and deep lung fluid are considerably less hygroscopic than salt solution, with values of GFd of 1.089 ± 0.003, 1.065 ± 0.003, and 1.301 at 50% RH, respectively. Thus, if all droplets were to start at 100 μm at 99.5% RH, they would equilibrate to droplets of 28.0, 30.4, and 20.9 μm diameter at 50% RH for saliva, deep lung fluid, and salt solution, respectively. Although saliva and deep lung fluid both contain significant mass fractions of various salts (see Table S1), they are also rich in organic components and retain less water at all RH values than the corresponding pure salt solution. This is reflected in the lower reported value for the κ-parameter for saliva and deep lung fluid relative to sodium chloride. Interestingly, despite the chemical complexity of saliva and deep lung fluid, the similar fractions of organic and salt components result in closely matching hygroscopicity curves. Functional fits for the equilibrium solution compositions over the full RH range are shown in Figure 1b and are given in Table S2. These fits allow the equilibrium composition, and corresponding solution density, to be calculated down to an RH at which a phase change is observed. The mass fraction of solute (MFS) tends to 1 only at 0% RH. Indeed, the possibility that a phase change occurs can be ignored in order to estimate the compositional dependence of the respiratory aerosol down to fully dry conditions. At the phase change RH, it is possible that the particle may undergo full crystallization or partial crystallization, and the RHs of the phase change for saliva and deep lung fluid are very close to the accepted RH for crystallization of NaCl; we will return to this in Section IV.
III. Accurate Hygroscopic Response and the Impact on Sedimentation Distance
Combined with the 2-dimensional model of Xie et al. for exploring the competition between sedimentation, evaporation, and momentum,3 we can simulate the trajectories of single droplets on exhalation for speaking, coughing, and sneezing, accounting for the measured hygroscopic response of the respiratory aerosol droplets. The model allows the calculation of the evolving size, temperature, velocity, and position for a single droplet emitted into a gas phase of a given temperature and RH. Although the equations used are well-established, there are implicit assumptions that the droplet is spherical and falls within the continuum regime when interacting with the gas phase (i.e., the Knudsen number is ≪1). This means that the model calculations will become less accurate as particles depart from sphericity or transition into the free molecule regime (i.e., diameter < ∼300 nm). Unique to this study, we use our measured hygroscopic response of simulated saliva and deep lung fluid (as presented in Section II) to predict the evolving moisture content, water vapor pressure, evaporative flux, and, thus, droplet size following exhalation.
We incorporate the treatment for the buoyant respiratory jet proposed by Liu et al.26 Based on well-established jet behavior, Liu et al. provide equations for calculating the trajectory and dissipation (of velocity, temperature, and water vapor density) for a jet emitted into a gas phase. The initial jet velocity is set at 10 m/s, corresponding to a cough, unless stated otherwise. We assume that the initial moisture content is set by an RH in the mouth of 99.5% and a temperature of 308 K (35 °C),15 and that the average height of the person’s mouth is 1.6 m above the ground. We show time-dependent evaporation curves in Figure 2a for saliva droplets initially spanning 5–200 μm in diameter at 5 μm intervals, evaporating into 50% ambient RH, with equilibration requiring from <1 s for the smallest droplet to 60 s for the largest droplet.
Figure 2.
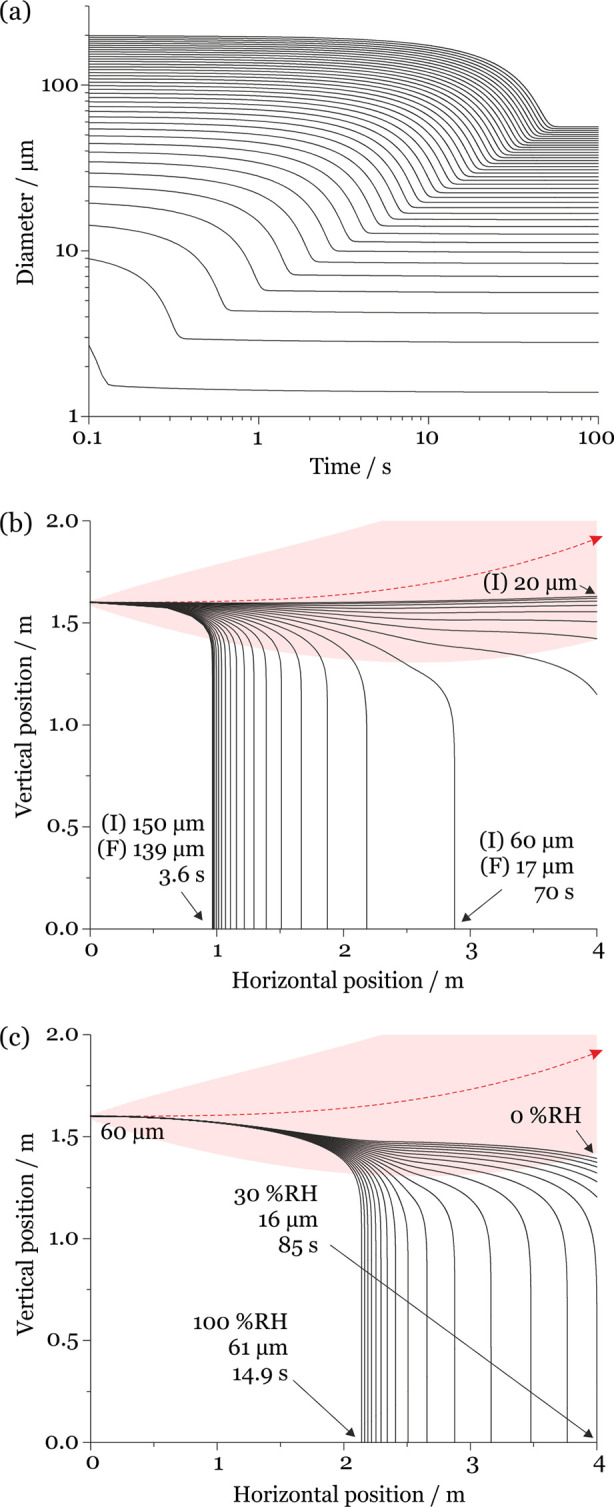
(a) Simulated evaporation time scales for saliva droplets evaporating at 293 K (20 °C) and 50% RH with initial diameters spanning 5–200 μm (5 μm intervals). (b) Comparison of the evaporation–sedimentation curves for saliva droplets 20–150 μm in initial diameter (5 μm intervals), projected by a cough at 10 m/s at 293 K and 50% RH. The trajectory of the respiratory jet is shown in red (traveling from left to right). (I) indicates the initial droplet size and (F) the size at deposition. (c) Dependence of sedimentation distance on RH for saliva droplets initially 60 μm in diameter generated by a cough at 10 m/s at 293 K and 0–100% RH (5% RH intervals). The trajectory of the respiratory jet is shown in red.
Evaporation occurs during the sedimentation of the droplets, changing the droplet mass as a function of time and leading to size-variant trajectories ( Figure 2b). For example, a droplet initially 150 μm in diameter evaporates to 139 μm in a 50% RH environment over 3.6 s before the droplet sediments to the ground, traveling a horizontal distance of 0.97 m from the source. Indeed, the droplet is not equilibrated at deposition requiring a full 30 s to reach within 5% of its final equilibrated size (42.0 μm). In other words, most of the moisture loss occurs after the droplet has deposited onto the ground. By contrast, a 60 μm diameter droplet evaporating in a 50% RH environment equilibrates to a size of 17.0 μm within 7.2 s, completing equilibration well within the 70 s it takes to sediment to the ground. This droplet travels a horizontal distance of 2.9 m from the source. Droplets with an initial diameter <60 μm do not sediment at all within the horizontal distance of 4 m from the source and fully equilibrate with the ambient RH in <7 s. These droplets shrink to around 29% of their initial diameter. Sedimentation distance is also strongly dependent on RH (see Figure 2c). At lower RH values, the droplet loses a larger fraction of moisture content and mass over a shorter time frame and therefore travels longer distances from the source.
In Figure 3a, we compare two limiting trajectories (at 100% and 0% ambient RH) for saliva, deep lung fluid, aqueous sodium chloride, and water droplets initially 70 μm in diameter. At high environmental RH (i.e., when the evaporation rate is slow), the hygroscopic response is small and does not significantly impact the droplet trajectory and sedimentation rate. By contrast, when environmental RH is low (i.e., the evaporation rate is high), the hygroscopic response is large and impacts both the sedimentation rate and droplet trajectory. The dependence of the sedimentation distance on initial droplet size and RH for saliva droplets projected from a cough at 10 m/s is shown more completely in Figure 3b. While droplets <30 μm exit the simulation window at 4 m without sedimenting, droplets larger than 100 μm sediment in under 1 m. Sedimentation distances for droplets of the intermediate size range are strongly dependent on initial droplet size and environmental RH. The dashed line indicates the initial diameter/RH combinations where the droplet reaches the 4 m distance limit of the simulations without sedimenting. Below this line (i.e., lower RH and/or smaller initial diameter), we have chosen to not place a limit on the sedimentation distance, reflecting the limitations of the model that do not include the impact of external forces such as air currents.
Figure 3.
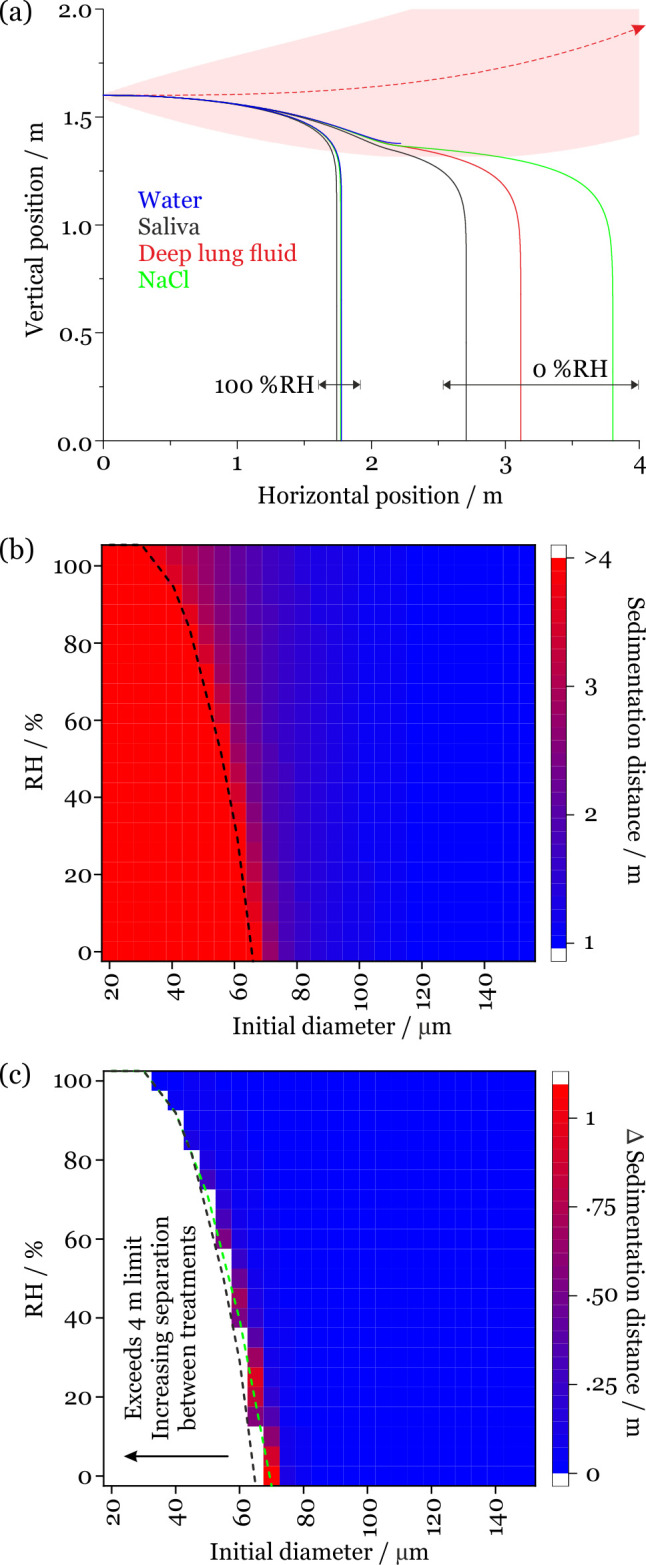
(a) Comparison of the sedimentation trajectories of droplets composed of saliva, lung fluid, sodium chloride, and pure water showing two limiting cases for droplets initially of the same size (70 μm). The trajectory of the respiratory jet is shown in red. (b) Sedimentation distance for saliva droplets projected from a cough at 10 m/s into an environment at 293 K (20 °C). The black dashed line indicates when the 4 m sedimentation limit is reached. (c) Change in sedimentation distance on assuming that the droplets are composed of sodium chloride solution rather than saliva. The dashed lines indicate when the 4 m sedimentation limit is reached for saliva (black) and NaCl (green).
The influence of the aerosol hygroscopic response on sedimentation distance is reported in Figure 3c, which reports the increase in sedimentation distance if the droplets are assumed to behave like NaCl rather than saliva. The white section in Figure 3c indicates the initial diameter/RH region where droplets composed of one or both fluids reach the 4 m limit, and no comparison of sedimentation distance is possible. The hygroscopic response has the greatest impact on sedimentation distance at low RH (when the evaporation rate is highest) and at intermediate droplet size (<80 μm). However, for larger droplet sizes and at most environmental RHs, the exact choice for the representation of the aerosol hygroscopic response has little impact on the sedimentation distance and previous models assuming aqueous sodium chloride will provide a fair approximation. Indeed, when comparing predictions assuming a droplet composed of aqueous sodium chloride to saliva, the change in sedimentation distance for most large initial droplet sizes and RHs is <0.1 m. However, it is important to note that an accurate understanding of the time-dependent moisture content may play an important role in understanding the survival of viruses and bacteria in evaporating droplets.
Although Figure 3b reports dependencies of sedimentation distance from a cough on RH and droplet size for saliva droplets, deep lung fluid droplets exhibit a similar behavior: minimal changes to sedimentation distance relative to sodium chloride droplets are observed except when the hygroscopic response occurs over a sufficiently short time compared to sedimentation (fast drying at low RH or small droplet size) to impact on the trajectory (see Figure S2). We also report simulations of the sedimentation distance for saliva droplets and deep lung fluid droplets generated by speaking at a jet speed of 5 m/s in Figures S3a and S4a, including the change in sedimentation distance from those predicted if the droplets are assumed to be composed of sodium chloride in Figures S3b and S4b. When compared with droplets generated from a cough, the lower initial momentum of droplets from speaking ensures they travel a shorter distance. Thus, there is less absolute difference in the sedimentation distances predicted when comparing different treatments of hygroscopic growth.
Time scales for sedimentation can be estimated in quiescent air and scale with the square of the radius for particles larger than 1 μm in diameter, i.e., in the continuum limit in the absence of a slip correction factor. At the terminal settling velocity, water droplets of 1 mm and 100, 10, and 1 μm diameter sediment 1 m in ∼30 ms, 3 s, 300 s, and 8 h, respectively. Of course, these sedimentation time scales are so long for small droplets that they are largely dispersed and carried by convective air currents. We report the calculated sedimentation times and the dependence on droplet diameter and RH in Figure 4 assuming the hygroscopic growth is consistent with the saliva formulation. As an example, a 100 μm initial diameter droplet takes between 6.3 and 21.9 s to sediment depending on the ambient RH. During the transport time to deposition, any pathogen in the aerosols or droplets will be exposed to UV light and the “open air” factor, potentially degrading the viability of the pathogen through the action of atmospheric oxidants or UV light. For example, time scales for degradation of SARS-CoV-2 in aerosol by UV light (the time scale for a reduction of viral load of 1 order of magnitude) have been measured to be <10 min in regions of mid-intensity UV, and <5 min in areas of high irradiance.27,28
Figure 4.
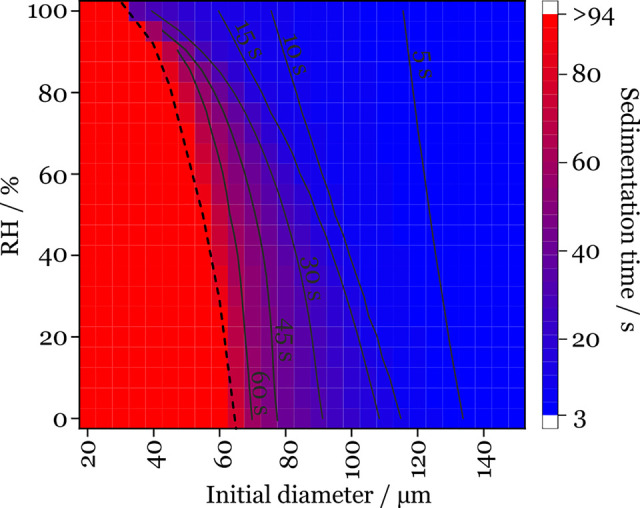
Sedimentation time scale for saliva droplets at 293 K (20 °C). The black dashed line indicates when the 4 m sedimentation limit is reached.
IV. Deposited Saliva Particles Are Mostly Solid and Nonspherical below 50% RH
Up to this point, we have assumed that the evaporating droplets remain liquid throughout the RH range, even down to full dry conditions at 0% RH in the limit of zero water content. The solubility limit of sodium chloride is surpassed as the RH decreases below 75%; in aerosol droplets, the crystallization relative humidity is 45% RH, corresponding to a supersaturation of ∼2, i.e., a solute concentration that is a factor of 2 higher than can be supported in a bulk solution.24 Such high salt concentrations are expected to play a role in the loss of viability of bacteria and the infectivity of viruses.29−31 The phase behavior of saliva and deep lung fluid droplets remains uncertain, despite their high salt contents.
In Figure 5a, we report the evaporation kinetics of deep lung fluid into an environment of varying RH using the same instrument described for our hygroscopicity measurements. As reported earlier, the droplets rapidly lose water to redress the imbalance between the starting water activity in the droplet and the surrounding environmental RH, equilibrating to a size and composition where the water vapor pressure above the droplet solution equals the partial pressure of water at a large distance from the droplet. A reduction in the RH leads to an increasing rate of evaporation and a decrease in the equilibrated size of the solution droplet, with retention of diminishing amounts of water. Once the RH is below 50%, the light scattering pattern used to estimate the droplet size becomes extremely irregular, indicating that the droplet is no longer a homogeneous sphere, and the reported size becomes noisy and unreliable. In Figure 5a, the time of onset of the disruption to the scattering pattern is identified with a star, and the noisy data points are removed. We previously demonstrated that the phase can be identified, and in this case, the particle morphology can be assigned to be nonspherical, potentially crystalline.32 Similarly, the evaporation of saliva droplets shows a phase change below 45% RH (Figure S5). SEM images of crystalline NaCl, deep lung fluid, and saliva, collected at 35% RH and 295 K, are shown in Figure 5c. The morphological differences observed in the SEM images between the dried particles of the different compositions will lead to different aerodynamic properties during sedimentation, which are not explicitly included in our modeling.
Figure 5.
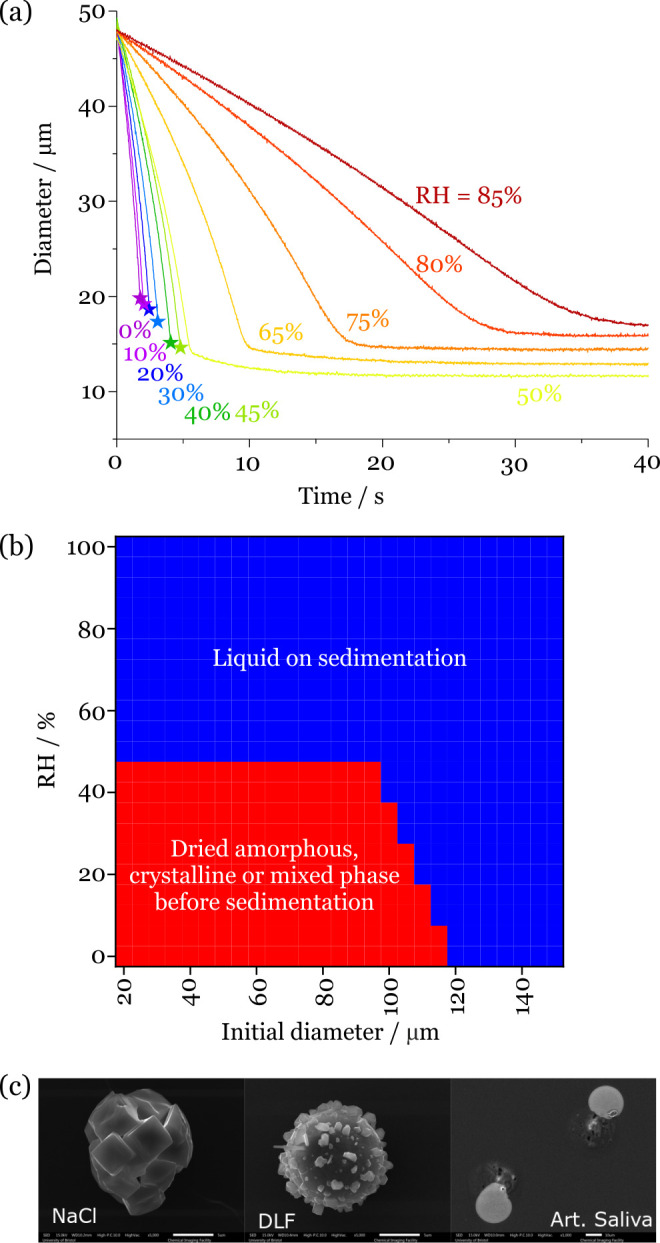
(a) Evaporation kinetics of deep lung fluid droplets with varying RH. The stars identify the onset of disruption to the light scattering pattern, indicating that a phase change has occurred to a nonspherical particle morphology. (b) Phase identification on sedimentation for deep lung fluid droplets with varying droplet size and RH from a cough at 10 m/s into an environment at 293 K (20 °C). The red bounded region indicates that droplets undergo a phase change before sedimenting onto a surface. (c) SEM images of the effloresced particles obtained from NaCl, deep lung fluid, and saliva droplets evaporated at 35% RH and 295 K. The scale bar represents 5 μm (NaCl and deep lung fluid) and 10 μm (saliva).
Based on the observation of prompt crystallization in the single droplet drying measurements, we can assume that evaporating respiratory fluid droplets undergo a phase change to a particle of nonspherical shape once they reach a water activity of 0.45. The particles could be crystalline, amorphous, or mixed phase, and it is not possible from our measurements to discriminate between these. Although there may be some inhomogeneity in the concentration profile of evaporating droplets, and the surface will increase in solute concentration more rapidly than the core,33 we do not include this in our modeling. In Figure 5b, we indicate the combinations of starting droplet size and environmental RH that lead to a phase change during the drying process before sedimentation. For all droplets <∼100 μm in diameter, the phase change occurs prior to deposition provided that the RH is below the reported phase change RH. For droplets >100 μm in diameter, phase change occurs before sedimentation only when the drying rate is sufficiently large that the solute concentration can rise sufficiently rapidly for the phase change to occur. Droplets >120 μm in diameter are unlikely to undergo a phase change before deposition, but they may be strongly supersaturated in salt and will likely form salt crystals on impact on a surface.
It could be anticipated that the high contents of mucin and surfactants in respiratory fluid droplets would lead to delayed moisture release with the droplets becoming viscous on drying or a surface film delaying water evaporation. We have seen such behavior for the drying kinetics of a wide range of high-molecular-weight systems including saccharides and triblock polymers, and the impact of this on atmospheric aerosols has long been debated.34−36 If the viscosity of a droplet rises during drying, the diffusion constant of evaporating water molecules decreases imposing a kinetic constraint on the moisture release kinetics.36 We have also demonstrated that the formation of solid condensed monolayer films on the surface of an evaporating droplet impedes water evaporation.37 In this work, we observed a small degree of kinetic limitation for deep lung fluid, as shown by the delay to reach equilibrium at 50% and 65% RH in Figure 5a, but no such limitation for saliva (Figure S5), suggesting that the diffusional time scale of water in the drying particles is typically shorter than the drying time (of order 1 s). This conclusion is consistent with a value for the viscosity that remains below 1 Pa s, the viscosity of a relatively viscous liquid (e.g., glycerol), 3 orders of magnitude more viscous than water.38,39
V. Changes in Temperature Impact Drying Rates and Sedimentation Distance
Notably, very few studies have explored the change in sedimentation distance with ambient temperature. The vapor pressure of water is strongly dependent on temperature,40 and this impacts on the compositionally dependent vapor pressure of saliva and deep lung fluid droplets. In addition, the ambient temperature also impacts on the buoyancy of the respiratory jet. At warmer temperatures, the jet is less buoyant and carries the entrained droplets greater distances. We compare droplet evaporation–sedimentation profiles for 60 μm diameter droplets at 50% RH and temperatures of 273–303 at 5 K intervals in Figure 6a. The hygroscopic response is only very weakly dependent on temperature, so we assume that the hygroscopicity measurements reported earlier are temperature invariant. At the lowest temperature, the droplet sediments ∼1.85 m from source, evaporating to an equilibrated diameter of 16.8 μm. At elevated temperature, the vapor pressure is higher, and the droplet evaporates more rapidly. This, combined with the reduced buoyancy of the respiratory jet, contributes to an increase in the sedimentation distance. At 293 K, the droplet sediments at ∼2.9 m. As an indicator of the sensitivity of the sedimentation distance to temperature, we report the change in sedimentation distance when the temperature is 303 K (30 °C) compared with 283 K (10 °C) in Figure 6b.
Figure 6.
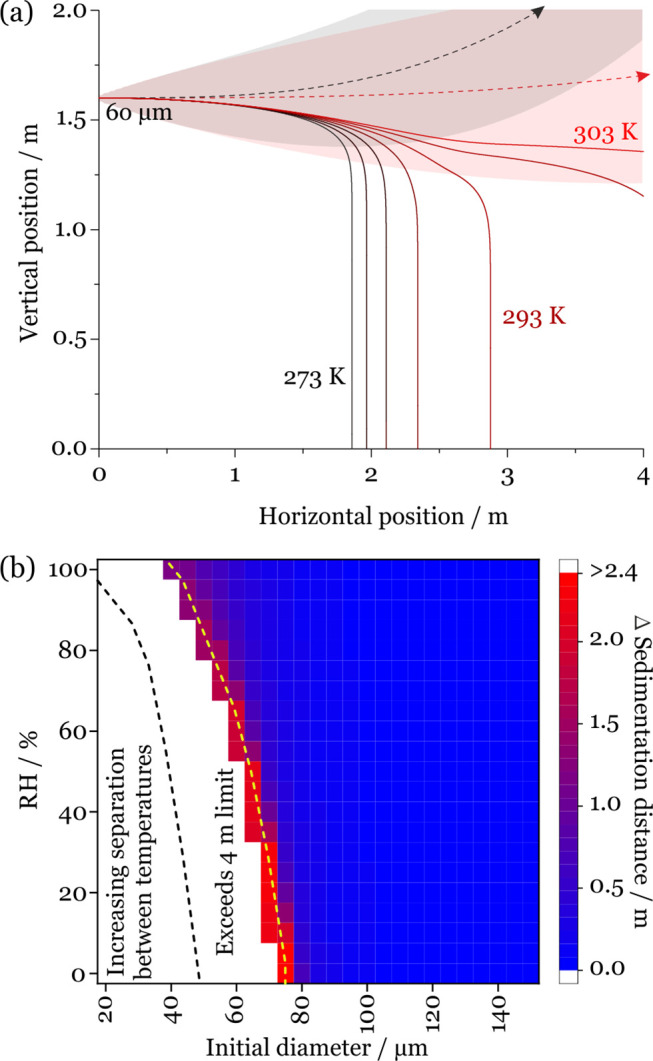
(a) Dependence of sedimentation distance on temperature for saliva droplets initially 60 μm in diameter generated by a cough at 10 m/s at 50% RH and 273–303 at 5 K intervals. The dashed lines represent the trajectory of the respiratory jet at 273 K (black) and 303 K (red). (b) Increase in sedimentation distance for saliva droplets generated by a cough when the ambient temperature increases to 303 K compared with 283 K. The region to the left of the dashed lines indicates when the 4 m limit is reached without sedimentation occurring for 283 K (black) and 303 K (yellow).
VI. Changes in Airborne Volume Fraction with Distance and Potential Exposure
Although the model has its limitations, indicative calculations of the changing fraction of the original aerosols and droplets remaining elevated from expiratory activity at varying distance can be made as well as, thus, the potential degree of exposure. It should be recognized that the model makes no attempt to represent the following: the intricacies of the dynamics of particle impaction on surfaces (in this case, the face of a susceptible individual) and the change in deposition efficiency with particle size and Stokes number; the actual area of exposed mucous membranes (i.e., the eyes, nose, and mouth); the thermal flows generated by individuals; the inhalation dynamics on inspiration; and the dose required for infection. It also only considers droplets which are initially emitted along the center of the respiratory jet (i.e., those which are anticipated to travel the furthest) and ignores any of the complexities associated with an ensemble droplet plume, such as droplet/droplet interactions. However, the model does make it possible to integrate the fraction of the droplet size distribution passing through a chosen window transverse to the exhalation jet (Figure 7a). We have explored the dependence of this fraction remaining airborne on RH, temperature, and distance, considering travel distances of 1, 1.5, 2, 2.5, 3, 3.5, and 4 m.
Figure 7.
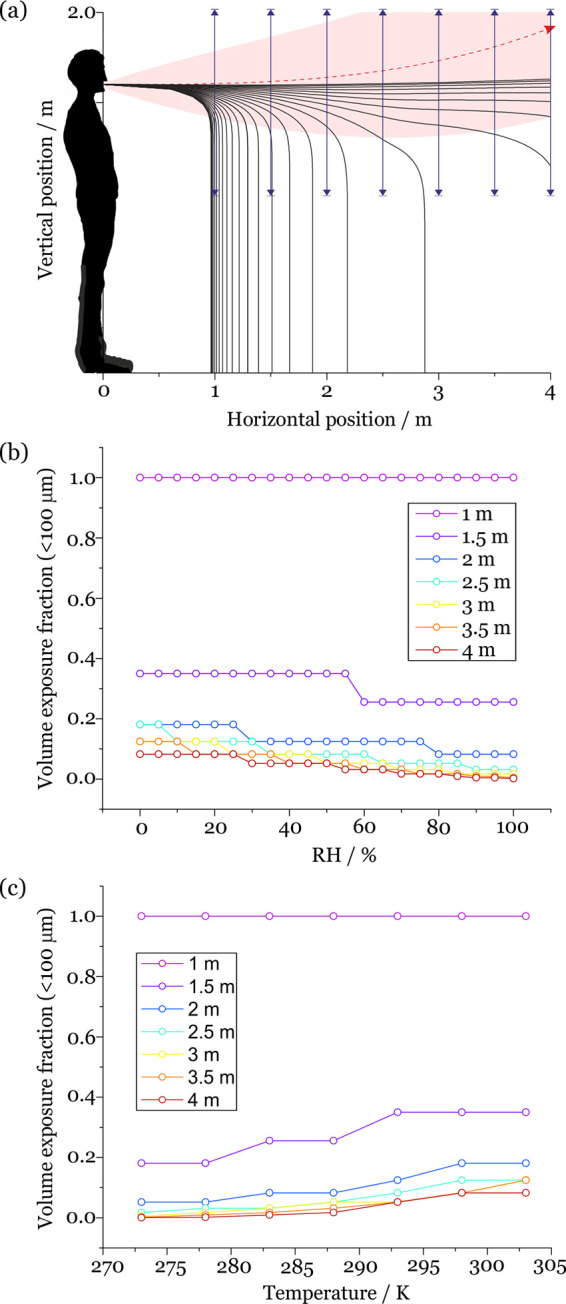
(a) Schematic of the indicative exposure calculation. The fraction of droplets and aerosols passing through the window at 1, 1.5, 2, 2.5, 3, 3.5, and 4 m is calculated. (b) RH-dependent volume exposure fraction at 1, 1.5, 2, 2.5, 3, 3.5, and 4 m for saliva droplets with an initial diameter <100 μm. These calculations are for a cough at an ambient temperature of 293 K. (c) Temperature-dependent droplet number exposure fraction at 1, 1.5, 2, 2.5, 3, 3.5, and 4 m for saliva droplets with an initial diameter <100 μm. These calculations are for a cough at an ambient RH of 50%.
More completely, using the model predictions, we identify the volume fraction of respiratory droplets in the initial diameter size range <100 μm from a cough that remain at an elevation above 1 m at each of the separation distances while varying RH and keeping temperature constant at 293 K (Figure 7b) and temperature while keeping RH constant at 50% (Figure 7c). Specifically, we divide the particle size distribution into 2 halves, those that are too large to remain airborne and have trajectories that take them below 1 m above the ground at the chosen separation distance, and those that are sufficiently small to remain elevated above 1 m. We then integrate the volume concentration distribution, determining the fraction in the volume distribution that remains elevated above 1 m where the volume fraction can be expected to provide a good estimate of the mass fraction. The size distribution reported by Johnson et al. is assumed to be the initial distribution of droplet sizes (Figure S6a).4
For droplets in the initial diameter range <100 μm generated by a cough at 293 K and at 50% RH, the maximum initial droplet sizes that pass through the windows at 1, 1.5, and 2 m are 100, 80, and 65 μm, respectively. This corresponds to volume fractions remaining elevated transiting through the window at 1, 1.5, and 2 m of 1, 0.350, and 0.125. As the RH increases, the fractional exposure decreases due to the slower evaporative flux and loss of mass, ensuring that the droplets sediment more rapidly. The fractional exposure increases with increasing temperature, due to the enhanced evaporative flux and reduced jet buoyancy. At 2 m of separation, the corresponding fraction in number concentration remaining elevated is 0.834 (Figure S6b). This demonstrates the dominant contribution to the volume distribution of the relatively small number of larger droplets compared to more numerous smaller droplets. Indeed, these fractions are qualitatively consistent with the recent computational fluid dynamics models reported by Chen et al.7 Although Chen et al. considered the fluid dynamics more accurately, our focus is to study the more accurate representation of the microphysical properties of the evolving aerosols.
VII. Conclusions
Here, we present a new, empirically derived treatment for the evaporation of respiratory fluid droplets and apply a simple 2-dimensional respiratory droplet evaporation/sedimentation/momentum model to assess the impact on sedimentation outcomes. The droplet mass (calculated from the size and density) is the dominant factor controlling the sedimentation time and, hence, the distance carried by the respiratory jet. We identify regimes where evaporation and the factors governing evaporation have negligible or dramatic impacts on the sedimentation outcomes. For initial droplet diameters above 100 μm, the ambient conditions (RH and temperature) and representation of the composition/hygroscopic response have little impact on the sedimentation distance, and previous models assuming aqueous sodium chloride will provide a fair representation. Below 100 μm, and particularly below 80 μm, the increased settling time means that evaporation plays a significant role in influencing the size and compositional changes that occur during the sedimentation process. Under these circumstances the application of an appropriate microphysical treatment and correct specification of the ambient conditions are crucial to accurately assess sedimentation distance and time. Failure to account for the composition can lead to sedimentation distance differences >1 m and beyond, under dryer conditions. Likewise, increasing the ambient temperature from 283 to 303 K can increase the sedimentation distance by well above 2 m. Very small aerosol droplets, where surface curvature is an important influence on vapor pressure and, thus, on evaporation rate (i.e., ∼<100 nm), are not considered in this work. These are smaller in dimension than the SARS-CoV-2 virus and unlikely to present a route for effective viral transmission.
A saliva droplet with an initial diameter of 100 μm emitted by a cough will take between 6.3 and 21.9 s to sediment depending on the ambient RH. Providing that the RH is below the phase change RH, this provides enough time for the droplet to undergo a phase change prior to sedimenting. Indeed, this is the case for all initial diameters below 100 μm. It is important to note that an accurate understanding of the phase and time-dependent moisture content may play an important role in understanding the survival of viruses and bacteria in evaporating droplets.41
In terms of potential exposure, we calculated the fraction of droplets below 100 μm from a measured respiratory droplet distribution that remain elevated above 1 m at regular separation distances between 1 and 4 m. We show that the fraction in the initial volume distribution decreases from 1 to 0.125 as the separation distance is increased from 1 to 2 m under typical ambient conditions.
We acknowledge the limitations of the study for accurately calculating the trajectories of very small (<∼300 nm) or nonspherical aerosols. We do not account for the dynamic complexities within an ensemble droplet plume, nor the deposition dynamics for droplets impacting on a susceptible person. We also recognize that the artificial recipes used here may not reflect the complexity, variability, or disease state dependence of real respiratory secretions, and this will be addressed in a future publication.
Acknowledgments
This work was supported by the University of Bristol and the Elizabeth Blackwell Institute for Health Research. B.R.B. is supported by the Natural Environment Research Council (NE/P018459/1). S.E.S.M. is supported by the European Research Council (ERC-COG: 648239).
Supporting Information Available
The Supporting Information is available free of charge at https://pubs.acs.org/doi/10.1021/acscentsci.0c01522.
Experimental methods, artificial saliva formulation, artificial deep lung fluid formulation, droplet evaporation/sedimentation model parametrization, and extended results (PDF)
The authors declare no competing financial interest.
Notes
Data Accessibility: Data are available at the University of Bristol data repository, data.bris, at 10.5523/bris.3kmjloe9687rx2a0gyppw6nxdp.
Supplementary Material
References
- Asadi S.; Bouvier N.; Wexler A. S.; Ristenpart W. D. The Coronavirus Pandemic and Aerosols : Does COVID-19 Transmit via Expiratory Particles ?. Aerosol Sci. Technol. 2020, 54 (6), 635–638. 10.1080/02786826.2020.1749229. [DOI] [PMC free article] [PubMed] [Google Scholar]
- Tellier R.; Li Y.; Cowling B. J.; Tang J. W. Recognition of Aerosol Transmission of Infectious Agents: A Commentary. BMC Infect. Dis. 2019, 19 (1), 1–9. 10.1186/s12879-019-3707-y. [DOI] [PMC free article] [PubMed] [Google Scholar]
- Xie X.; Li Y.; Chwang A. T. Y.; Ho P. L.; Seto W. H. How Far Droplets Can Move in Indoor Environments – Revisiting the Wells Evaporation–Falling Curve. Indoor Air 2007, 17 (3), 211–225. 10.1111/j.1600-0668.2007.00469.x. [DOI] [PubMed] [Google Scholar]
- Johnson G. R.; Morawska L.; Ristovski Z. D.; Hargreaves M.; Mengersen K.; Chao C. Y. H.; Wan M. P.; Li Y.; Xie X.; Katoshevski D.; Corbett S. Modality of Human Expired Aerosol Size Distributions. J. Aerosol Sci. 2011, 42 (12), 839–851. 10.1016/j.jaerosci.2011.07.009. [DOI] [PMC free article] [PubMed] [Google Scholar]
- Bourouiba L. Turbulent Gas Clouds and Respiratory Pathogen Emissions: Potential Implications for Reducing Transmission of COVID-19. JAMA 2020, 323 (18), 1837–1838. 10.1001/jama.2020.4756. [DOI] [PubMed] [Google Scholar]
- Bourouiba L.; Dehandschoewercker E.; Bush J. W. M. Violent Expiratory Events: On Coughing and Sneezing. J. Fluid Mech. 2014, 745, 537–563. 10.1017/jfm.2014.88. [DOI] [Google Scholar]
- Chen W.; Zhang N.; Wei J.; Yen H. L.; Li Y. Short-Range Airborne Route Dominates Exposure of Respiratory Infection during Close Contact. Build. Environ. 2020, 176 (April), 106859. 10.1016/j.buildenv.2020.106859. [DOI] [Google Scholar]
- Nicas M.; Nazaroff W. W.; Hubbard A. Toward Understanding the Risk of Secondary Airborne Infection: Emission of Respirable Pathogens. J. Occup. Environ. Hyg. 2005, 2 (3), 143–154. 10.1080/15459620590918466. [DOI] [PMC free article] [PubMed] [Google Scholar]
- Zayas G.; Chiang M. C.; Wong E.; MacDonald F.; Lange C. F.; Senthilselvan A.; King M. Cough Aerosol in Healthy Participants: Fundamental Knowledge to Optimize Droplet-Spread Infectious Respiratory Disease Management. BMC Pulm. Med. 2012, 12, 11. 10.1186/1471-2466-12-11. [DOI] [PMC free article] [PubMed] [Google Scholar]
- WELLS W. F. ON AIR-BORNE INFECTION*. Am. J. Epidemiol. 1934, 20 (3), 611–618. 10.1093/oxfordjournals.aje.a118097. [DOI] [Google Scholar]
- Klompas M.; Baker M. A.; Rhee C. Airborne Transmission of SARS-CoV-2: Theoretical Considerations and Available Evidence. JAMA - Journal of the American Medical Association 2020, 324, 441–442. 10.1001/jama.2020.12458. [DOI] [PubMed] [Google Scholar]
- Prather K.; Marr L.; Schooley R.; McDiarmid M.; Wilson M.; Milton D. Airborne Transmission of SARS-CoV-2. Science (Washington, DC, U. S.) 2020, 370, 303–304. 10.1126/science.abf0521. [DOI] [PubMed] [Google Scholar]
- Prather K. A.; Wang C. C.; Schooley R. T. Reducing Transmission of SARS-CoV-2. Science (Washington, DC, U. S.) 2020, 368, 1422–1424. 10.1126/science.abc6197. [DOI] [PubMed] [Google Scholar]
- Morawska L.; Cao J. Airborne Transmission of SARS-CoV-2: The World Should Face the Reality. Environ. Int. 2020, 139 (April), 105730. 10.1016/j.envint.2020.105730. [DOI] [PMC free article] [PubMed] [Google Scholar]
- Morawska L.; Johnson G. R.; Ristovski Z. D.; Hargreaves M.; Mengersen K.; Corbett S.; Chao C. Y. H.; Li Y.; Katoshevski D. Size Distribution and Sites of Origin of Droplets Expelled from the Human Respiratory Tract during Expiratory Activities. J. Aerosol Sci. 2009, 40 (3), 256–269. 10.1016/j.jaerosci.2008.11.002. [DOI] [PMC free article] [PubMed] [Google Scholar]
- Noakes C. J.; Beggs C. B.; Sleigh P. A.; Kerr K. G. Modelling the Transmission of Airborne Infections in Enclosed Spaces. Epidemiol. Infect. 2006, 134 (5), 1082–1091. 10.1017/S0950268806005875. [DOI] [PMC free article] [PubMed] [Google Scholar]
- Baldelli A.; Boraey M. A.; Nobes D. S.; Vehring R. Analysis of the Particle Formation Process of Structured Microparticles. Mol. Pharmaceutics 2015, 12 (8), 2562–2573. 10.1021/mp500758s. [DOI] [PubMed] [Google Scholar]
- Baldelli A.; Power R. M.; Miles R. E. H.; Reid J. P.; Vehring R. Effect of Crystallization Kinetics on the Properties of Spray Dried Microparticles. Aerosol Sci. Technol. 2016, 50 (7), 693–704. 10.1080/02786826.2016.1177163. [DOI] [Google Scholar]
- Baldelli A.; Vehring R. Control of the Radial Distribution of Chemical Components in Spray-Dried Crystalline Microparticles. Aerosol Sci. Technol. 2016, 50 (10), 1130–1142. 10.1080/02786826.2016.1216941. [DOI] [Google Scholar]
- Rovelli G.; Miles R. E. H.; Reid J. P.; Clegg S. L. Accurate Measurements of Aerosol Hygroscopic Growth over a Wide Range in Relative Humidity. J. Phys. Chem. A 2016, 120 (25), 4376–4388. 10.1021/acs.jpca.6b04194. [DOI] [PubMed] [Google Scholar]
- Marsh A.; Miles R. E. H.; Rovelli G.; Cowling A. G.; Nandy L.; Dutcher C. S.; Reid J. P. Influence of Organic Compound Functionality on Aerosol Hygroscopicity: Dicarboxylic Acids, Alkyl-Substituents, Sugars and Amino Acids. Atmos. Chem. Phys. 2017, 17, 5583–5599. 10.5194/acp-17-5583-2017. [DOI] [Google Scholar]
- Woo M. H.; Hsu Y. M.; Wu C. Y.; Heimbuch B.; Wander J. Method for Contamination of Filtering Facepiece Respirators by Deposition of MS2 Viral Aerosols. J. Aerosol Sci. 2010, 41 (10), 944–952. 10.1016/j.jaerosci.2010.07.003. [DOI] [PMC free article] [PubMed] [Google Scholar]
- Hassoun M.; Royall P. G.; Parry M.; Harvey R. D.; Forbes B. Design and Development of a Biorelevant Simulated Human Lung Fluid. J. Drug Delivery Sci. Technol. 2018, 47, 485–491. 10.1016/j.jddst.2018.08.006. [DOI] [PMC free article] [PubMed] [Google Scholar]
- Krieger U. K.; Marcolli C.; Reid J. P. Exploring the Complexity of Aerosol Particle Properties and Processes Using Single Particle Techniques. Chem. Soc. Rev. 2012, 41 (19), 6631–6662. 10.1039/c2cs35082c. [DOI] [PubMed] [Google Scholar]
- Petters M. D.; Kreidenweis S. M. A Single Parameter Representation of Hygroscopic Growth and Cloud Condensation Nucleus Activity. Atmos. Chem. Phys. 2007, 7 (2), 1961–1971. 10.5194/acp-7-1961-2007. [DOI] [Google Scholar]
- Liu L.; Wei J.; Li Y.; Ooi A. Evaporation and Dispersion of Respiratory Droplets from Coughing. Indoor Air 2017, 27 (1), 179–190. 10.1111/ina.12297. [DOI] [PubMed] [Google Scholar]
- Schuit M.; Ratnesar-Shumate S.; Yolitz J.; Williams G.; Weaver W.; Green B.; Miller D.; Krause M.; Beck K.; Wood S.; Holland B.; Bohannon J.; Freeburger D.; Hooper I.; Biryukov J.; Altamura L. A.; Wahl V.; Hevey M.; Dabisch P. Airborne SARS-CoV-2 Is Rapidly Inactivated by Simulated Sunlight. J. Infect. Dis. 2020, 222, 564–571. 10.1093/infdis/jiaa334. [DOI] [PMC free article] [PubMed] [Google Scholar]
- Ratnesar-shumate S.; Williams G.; Green B.; Krause M.; Holland B.; Wood S.; Bohannon J.; Boydston J.; Freeburger D.; Hooper I.; Beck K.; Yeager J.; Altamura L. A.; Biryukov J.; Yolitz J.; Schuit M.; Wahl V.; Hevey M.; Dabisch P. Simulated Sunlight Rapidly Inactivates SARS-CoV-2 on Surfaces. J. Infect. Dis. 2020, 222 (52281), 214–222. 10.1093/infdis/jiaa274. [DOI] [PMC free article] [PubMed] [Google Scholar]
- Marr L. C.; Tang J. W.; Van Mullekom J.; Lakdawala S. S. Mechanistic Insights into the Effect of Humidity on Airborne Influenza Virus Survival, Transmission and Incidence. J. R. Soc., Interface 2019, 16 (150), 20180298. 10.1098/rsif.2018.0298. [DOI] [PMC free article] [PubMed] [Google Scholar]
- Fernandez M. O.; Thomas R. J.; Garton N. J.; Hudson A.; Haddrell A.; Reid J. P. Assessing the Airborne Survival of Bacteria in Populations of Aerosol Droplets with a Novel Technology. J. R. Soc., Interface 2019, 16 (150), 20180779. 10.1098/rsif.2018.0779. [DOI] [PMC free article] [PubMed] [Google Scholar]
- Lin K.; Marr L. C. Humidity-Dependent Decay of Viruses, but Not Bacteria, in Aerosols and Droplets Follows Disinfection Kinetics. Environ. Sci. Technol. 2020, 54, 1024–1032. 10.1021/acs.est.9b04959. [DOI] [PubMed] [Google Scholar]
- Haddrell A.; Rovelli G.; Lewis D.; Church T.; Reid J. Identifying Time-Dependent Changes in the Morphology of an Individual Aerosol Particle from Its Light Scattering Pattern. Aerosol Sci. Technol. 2019, 53 (11), 1334–1351. 10.1080/02786826.2019.1661351. [DOI] [Google Scholar]
- Gregson F. K. A.; Robinson J. F.; Miles R. E. H.; Royall C. P.; Reid J. P. Drying Kinetics of Salt Solution Droplets: Water Evaporation Rates and Crystallization. J. Phys. Chem. B 2019, 123, 266–276. 10.1021/acs.jpcb.8b09584. [DOI] [PubMed] [Google Scholar]
- Song Y. C.; Ingram S.; Arbon R. E.; Topping D. O.; Glowacki D. R.; Reid J. P. Transient Cavity Dynamics and Divergence from the Stokes-Einstein Equation in Organic Aerosol. Chem. Sci. 2020, 11, 2999–3006. 10.1039/C9SC06228A. [DOI] [PMC free article] [PubMed] [Google Scholar]
- Rovelli G.; Song Y. C.; MacLean A. M.; Topping D. O.; Bertram A. K.; Reid J. P. Comparison of Approaches for Measuring and Predicting the Viscosity of Ternary Component Aerosol Particles. Anal. Chem. 2019, 91 (8), 5074–5082. 10.1021/acs.analchem.8b05353. [DOI] [PubMed] [Google Scholar]
- Reid J. P.; Bertram A. K.; Topping D. O.; Laskin A.; Martin S. T.; Petters M. D.; Pope F. D.; Rovelli G. The Viscosity of Atmospherically Relevant Organic Particles. Nat. Commun. 2018, 9 (1), 956. 10.1038/s41467-018-03027-z. [DOI] [PMC free article] [PubMed] [Google Scholar]
- Davies J. F.; Miles R. E. H.; Haddrell A. E.; Reid J. P. Influence of Organic Films on the Evaporation and Condensation of Water in Aerosol. Proc. Natl. Acad. Sci. U. S. A. 2013, 110 (22), 8807–8812. 10.1073/pnas.1305277110. [DOI] [PMC free article] [PubMed] [Google Scholar]
- Power R. M.; Reid J. P. Probing the Micro-Rheological Properties of Aerosol Particles Using Optical Tweezers. Rep. Prog. Phys. 2014, 77 (7), 074601. 10.1088/0034-4885/77/7/074601. [DOI] [PubMed] [Google Scholar]
- Power R. M.; Simpson S. H.; Reid J. P.; Hudson A. J. The Transition from Liquid to Solid-Like Behaviour in Ultrahigh Viscosity Aerosol Particles. Chem. Sci. 2013, 4 (6), 2597–2604. 10.1039/c3sc50682g. [DOI] [Google Scholar]
- Davies J. F.; Miles R. E. H.; Haddrell A. E.; Reid J. P. Temperature Dependence of the Vapor Pressure and Evaporation Coefficient of Supercooled Water. J. Geophys. Res. - Atmos. 2014, 119, 10931–10940. 10.1002/2014JD022093. [DOI] [Google Scholar]
- Otero Fernandez M.; Thomas R. J.; Oswin H.; Haddrell A. E.; Reid J. P. Transformative Approach to Investigate the Microphysical Factors Influencing the Airborne Transmission of Pathogens. Appl. Environ. Microbiol. 2020, 86 (23), e01543-20. 10.1128/AEM.01543-20. [DOI] [PMC free article] [PubMed] [Google Scholar]
Associated Data
This section collects any data citations, data availability statements, or supplementary materials included in this article.