

Abstract
Background
Ticks puncture the skin of their hosts and secrete saliva, containing antiplatelet proteins, into the blood. Here, we studied disagregin, a potent platelet‐inhibiting protein derived from the salivary glands of Ornithodoros moubata, an African soft tick. Whereas conventional αIIbβ3 antagonists contain an Arg‐Gly‐Asp (RGD) sequence for platelet integrin binding, disagregin contains an Arg‐Glu‐Asp (RED) sequence, hypothesizing a different mode of inhibitory action.
Objectives
We aimed to compare the inhibitory effects of disagregin and its RGD variant (RGD‐disagregin) on platelet activation and to unravel the molecular basis of disagregin‐αIIbβ3 integrin interactions.
Methods
Disagregin and RGD‐disagregin were synthesized by tert‐butyloxycarbonyl –based solid‐phase peptide synthesis. Effects of both disagregins on platelet aggregation were assessed by light transmission aggregometry in human platelet‐rich plasma. Whole‐blood thrombus formation was investigated by perfusing blood over collagen I with and without tissue factor at a high wall‐shear rate (1000 s−1) in the presence of disagregin, RGD‐disagregin, or eptifibatide.
Results
Disagregin showed inhibition of collagen‐ and ADP‐induced platelet aggregation with half maximal inhibitory concentration values of 64 and 99 nM, respectively. This resembled the complete antiaggregatory effect of eptifibatide. Multiparameter assessment of thrombus formation showed highly suppressed platelet adhesion and aggregate formation with both disagregins, in contrast to eptifibatide treatment, which incompletely blocked aggregation under flow. Fibrin formation under flow was delayed by both disagregin and RGD‐disagregin (P < .01) and eptifibatide (P < .05).
Conclusions
Both αIIbβ3‐blocking disagregins have a strong potential to suppress collagen‐tissue factor–mediated platelet adhesion, thrombus formation, and fibrin formation. Both disagregins can be seen as potential new αIIbβ3 inhibitors.
Keywords: blood coagulation, synthetic chemistry techniques, platelet activation, platelet aggregation inhibitors, ticks
Essentials.
Tick saliva contains antiplatelet and anticoagulant proteins.
Tick disagregin was chemically synthesized and tested using whole‐blood thrombus formation.
Disagregin caused suppressed platelet adhesion and aggregate formation.
Fibrin formation under flow is delayed by the addition of disagregin and RGD‐disagregin.
1. INTRODUCTION
Ticks are hematophagous parasites that collect blood by puncturing the skin of their hosts. This vascular puncturing leads to blood exposure to vascular collagens, which induces primary hemostasis by platelet adhesion and aggregation to produce a platelet plug or thrombus, initially arresting the bleeding. 1 Interaction of integrin receptor αIIbβ3 with fibrinogen accomplishes the formation of platelet aggregates and thrombi. In addition, vascular puncturing also leads to blood contact with subendothelial tissue factor (TF), initiating secondary hemostasis, which via the extrinsic coagulation pathway triggers thrombin generation and fibrin clot formation to stabilize the platelet plug. 1 To suppress primary and secondary hemostatic pathways of their hosts to enable continuation of feeding, ticks secrete saliva that contains a rich mixture of antiplatelet and anticoagulant proteins. 2
Ticks of the Argasidae family are so‐called soft ticks equipped with a soft, leathery shield. A prominent member of this family, Ornithodoros moubata, produces the protein disagregin in its salivary glands. 3 This 6.9 kDa protein acts as an antihemostatic agent by binding to the αIIbβ3 integrin on platelets and preventing platelet aggregation. 3 Upon activation (inside‐out signaling), integrin αIIbβ3 is known to change from a closed to an open conformation, making its binding sites for fibrinogen accessible. Disagregin belongs to the disintegrins, which are nonenzymatic, 6‐10 kDa, cysteine‐rich proteins, originally described in viper venom. 4 Disintegrins generally expose an Arg‐Gly‐Asp (RGD) or Lys‐Gly‐Asp (KGD) sequence, allowing specific binding to the activated integrins, thereby inhibiting binding of fibrinogen to activated platelets. 3 , 14 Interestingly, disagregin lacks an RGD sequence but instead contains an Arg‐Glu‐Asp (RED) sequence, suggesting a different mode of action. One of the clinically approved αIIbβ3 inhibitors is eptifibatide, a cyclic heptapeptide found in snake venom. 15 It contains a KGD sequence in which the lysine is modified into a homo‐arginine that increases specificity for the receptor. 16
In this study, we investigated whether (i) a chemically synthesized peptide, based on the tick‐derived integrin antagonist disagregin, interferes with platelet activation, and (ii) the action mechanism is unique due to the absence of an RGD sequence. Therefore, both native disagregin (referred to as disagregin) and an E15G variant (referred to as RGD‐disagregin) were synthesized by solid‐phase peptide synthesis and native chemical ligation. Subsequently, we revealed the effects of the synthesized proteins on human platelet adhesion, aggregation, and ensuing fibrin formation.
2. MATERIALS AND METHODS
Full methods are described in the supplemental information.
2.1. Molecular docking and molecular dynamics simulations
A homology model of disagregin was constructed by using the SWISS‐MODEL WebServer 17 with bovine pancreatic trypsin inhibitor (BPTI K15R/R17D variant) in complex with human mesotrypsin serving as template (chain B of the PDB code 3P95). Molecular docking of disagregin and αIIbβ3 was conducted by using the protein‐protein docking module implemented in the HADDOCK WebServer. 18 As in our previous work, 19 the binding pose of disagregin with αIIbβ3, which gives the lowest binding free energy (indicating the most thermodynamically favorable conformation) was selected for further investigation of binding and interaction between different disagregin variants (RED‐, RGD‐, [RAD], and AAA‐disagregin) with the αIIbβ3 integrin. Then, these complexes were subjected to molecular dynamics (MD) simulations for 20 ns by using standard parameters and protocols as previously reported. 19 , 20 The binding free energy (BFE) between αIIbβ3 and the different disagregin variants was computed by applying the molecular mechanics/generalized Born surface area (GB model = 5) method. MD simulations and BFE calculations were performed by using the AMBER16 program, University of California, San Francisco.
2.2. Peptide synthesis
All peptide fragments were manually synthesized using tert‐butyloxycarbonyl (Boc)‐based solid‐phase peptide synthesis on a 0.25‐mmol scale on 4‐(hydroxymethyl)phenylacetamidomethyl‐polystyrene resin, as described previously (Table S1; Figure 2A). 21 , 22 Instead of 2‐(1H‐benzotriazole‐1‐yl)‐1,1,3,3‐tetramethyluronium hexafluorophosphate, 2‐(6‐chloro‐1H‐benzotriazol‐1‐yl)‐1,1,3,3‐tetramethylaminium hexafluorophosphate (Peptides International, Louisville, KY, USA) was used as a coupling reagent. Sequences of peptide fragments are shown in Table S1.
Figure 2.
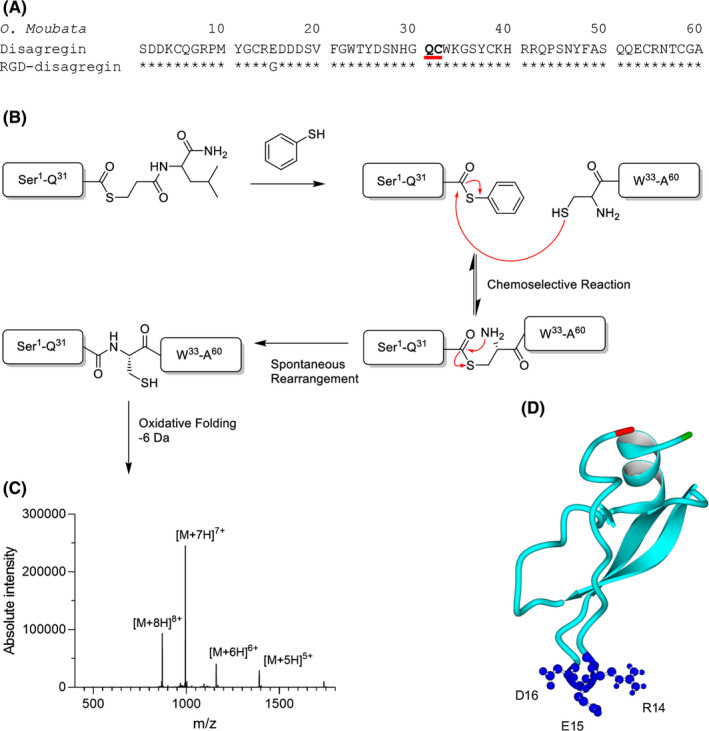
A, Amino acid sequence of disagregin (top) and RGD‐disagregin (bottom) where the latter only has an E15G mutation. Bold and underlined amino acids show ligation site. B, Thioester peptide‐COSR reacts with an N‐cysteine‐peptide to form a trans thioester. Spontaneous rearrangement through a five‐membered ring intermediate leads to the formation of a native peptide bond at the site of ligation. C, Electrospray ionization spectrum of folded disagregin. D, Predicted structure of disagregin
Peptide fragments were deprotected and cleaved by anhydrous hydrogen fluoride (HF, GHC Gerling, Holz & Co, Handels GmbH, Hamburg, Germany) treatment for 1 hour at 0°C using 4% p‐cresol as a scavenger. After HF cleavage, peptide products were precipitated and washed with ice‐cold diethylether, dissolved in aqueous acetonitrile and lyophilized. 22 Crude products were analyzed on a Waters (Milford, MA, USA, and Etten‐Leur, The Netherlands) ultra‐high‐performance liquid chromatography–mass spectrometry (UPLC‐MS) XEVO‐G2QToF system.
Native chemical ligation and oxidative folding was performed as described previously (Figure 2B). 22 , 23 , 24 After completion of folding, the proteins were purified by semipreparative high‐performance liquid chromatography (HPLC), analyzed by UPLC‐MS, and lyophilized.
2.3. Light transmission aggregometry
Platelet‐rich plasma (PRP) was collected by centrifuging whole blood at 240 g for 15 minutes. Platelet‐poor plasma (PPP) was collected by centrifuging whole blood for 10 minutes at 2200 g twice. Platelet count in PRP was adjusted to 250 × 109/L with autologous PPP. Samples of PRP were preincubated with indicated concentrations of disagregin, RGD‐disagregin or eptifibatide for 2 minutes at 37°C. Platelets were then activated with P2Y1 and P2Y12 receptor‐targeting Me‐S‐ADP (5 µM; SantaCruz Biotechnology, CA, USA) or glycoprotein VI–targeting collagen (1 µg/mL; Nycomed Pharma, Munich, Germany). Optical density changes from citrated PRP were measured under constant stirring by a Chronolog aggregometer (Havertown, PA, USA) for 10 minutes at 37°C. 25
2.4. Shear‐induced platelet adhesion and thrombus formation on a collagen‐coated surface
Glass coverslips (24 × 60 mm, Thermo Fisher, Breda, The Netherlands) were degreased with 2M HCl in 50% ethanol and washed with dH2O. The coverslips were then coated with a collagen I microspot (1 µL each, 50 µg/mL; Takeda Austria GmbH, Austria).
Following earlier described procedures, coated coverslips were mounted onto a transparent parallel‐plate flow chamber (height, 50 µm; width, 3.0 mm; length, 30 mm; Maastricht flow chamber). 26 Blood samples were preincubated with disagregin (1 µM or 100 nM), RGD‐disagregin (1 µM or 100 nM), or eptifibatide (1 µM) for 5 minutes before the experiment. The samples were then recalcified in the presence of D‐phenylalanyl‐prolyl‐arginyl chloromethyl ketone (40 µM; PPACK; Calbiochem, Burlington, MA, USA) with 7.5 mM CaCl2 and 3.75 mM MgCl2. Blood was perfused through the microfluidic chambers at a wall‐shear rate of 1000 s‐1. After 3.5 minutes, the thrombi were stained for platelet activation with a mixture of fluorescein isothiocyanate (FITC)‐labeled fibrinogen monoclonal antibody (mAb; 1:100, F0111; Dako, Santa Clara, CA, USA), AF647‐labeled anti‐P‐selectin mAb (1.25 µg/mL; BioLegend, San Diego, CA, USA) and AF568‐annexin A5 (0.25 µg/mL; Invitrogen by Thermo Fisher, Breda, The Netherlands) during a 2‐minute perfusion (all in rinse buffer, containing 4‐(2‐hydroxyethyl)‐1‐piperazineethanesulfonic acid (HEPES) buffer pH 7.45 supplemented with 0.1% glucose, 0.1% bovine serum albumin, 2 mM CaCl2 and 1 U/mL heparin). After 2 minutes of stasis, a perfusion with rinse buffer was started to remove unbound label. Subsequently, representative bright‐field and tricolor fluorescence images were taken. After the experiment, the bright‐field and fluorescence images were blindly analyzed for parameters using FIJI software.
2.5. Collagen/TF‐induced formation of platelet‐fibrin thrombi in flowed whole blood
Clean and degreased coverslips were coated with 2 microspots (5 mm center‐to‐center distance; 1 µL of 50 µg/mL collagen‐I). After 1 hour of incubation and a washing step with saline, the downstream microspot was co‐coated with TF (1 µL of 500 pM), similarly as described elsewhere. 27 Before the experiment, citrated‐anticoagulated blood samples were preincubated with disagregin (100 nM, 1 µM), RGD‐disagregin (100 nM, 1 µM) or eptifibatide (1 µM) for 5 minutes. Subsequently, the samples were supplemented with 3,3′‐dihexyloxacarbocyanine iodide (DiOC6; platelet membrane label, 0.5 µg/mL; AnaSpec, Fremont, CA, USA), AF568‐annexin A5 (staining phosphatidylserine [PS]‐exposing platelets, 1:200; Invitrogen) and AF647 human fibrinogen (1:200, Molecular Probes by Thermo Fisher, Breda, The Netherlands).
During the flow, the blood was continuously recalcified with a coagulation mix consisting of 63 mM CaCl2, 32 mM MgCl2 in modified HEPES buffer pH 7.45 via a y‐shaped dual‐inlet tube at a volume ratio of 10:1, as described. 27 Blood was perfused at a wall‐shear rate of 1000 s‐1 for 14 minutes. To evaluate the kinetics of thrombus and fibrin formation, bright‐field and fluorescent microscopic images were taken, and bright‐field images were taken from each microspot at 2‐minute intervals. One representative image per time point was taken from both collagen I and collagen I/TF microspot to analyze parameters. Images were blindly analyzed for the parameters in Table S3.
2.6. Quantitative image analysis
End point and time series of bright‐field and fluorescence microscopic images were analyzed using scripts written in the open‐access program FIJI, as described before. 28 The following output parameters were used (Table S3): percentages of surface area coverage of platelet deposition (P1), PS exposure (P2), and thrombus surface area coverage (P3). Bright‐field images were furthermore scored for thrombus morphology (P4) as follows: 0, no or few adhered platelets; 1, multiple single adhered platelets; 2, platelet monolayer; 3, small aggregates; 4, medium‐size aggregates; and 5, large aggregates. 26 , 27 , 28 , 29 Thrombus multilayer (P5) and thrombus contraction (P6) were scored from 0 to 3. 28 The following fibrin parameters were used: fibrinogen or fibrin deposition (P7), fibrin formation (P8) scored from 0 to 3. Times to fibrin formation were measured in minutes and subtracted (P9).
To compare all parameters between conditions, average values were uniformly scaled over a range from 0 to 10 and heat maps were generated, as appropriate. Using the scaled values, subtraction was conducted to visualize the difference between control and treatment. In heat maps with fibrin formation, times to first fibrin formation were subtracted from 14 minutes. 27
2.7. Cell toxicity
Cell proliferation was measured in real time using the xCELLigence System (ACEA Biosciences, San Diego, CA, USA). EA.hy926 cells (15 000 cells per well) were seeded in a 96‐xCELLigence‐well plate. After 24 hours, different compounds were added in the well and proliferation was followed for 6 days (144 hours).
2.8. Statistical analysis
Data are presented as medians ± interquartile ranges. Statistical significance between groups was determined using a Kruskal‐Wallis test with Dunn’s correction for multiple comparisons. Prism 8.0 (GraphPad Software, La Jolla, CA, USA) was used for statistical analyses. A P value <.05 was considered as statistically significant.
3. RESULTS
3.1. Docking and molecular dynamics simulations of different compounds with the αIIbβ3 integrin
Molecular docking of disagregin into the binding pocket of αIIbβ3 revealed that the binding mode of disagregin is quite similar to the co‐crystallized structure of eptifibatide in complex with αIIbβ3 (Protein Data Bank code 2VDN). The homo‐Arg residue of eptifibatide interacted with Asp224 of the αIIb domain (Figure 1A), whereas the Arg residue of the RED motif established H‐bonds with Tyr190 and Asp232 of the αIIb domain (Figure 1B). The Gly and Asp residues of eptifibatide formed H‐bonds mainly with residues from the β3 domain, that is, Tyr122, Ser123, Arg214, Asn215, and Arg216 (Figure 1A). Similar interactions between the Glu and Asp residues (RED motif) of disagregin were observed. The Glu residue interacted with Arg214 and also with the side chain of Tyr166 of the β3 domain, and the Asp residue exhibited electrostatic interactions with the Ca atom located in the β3 domain (Figure 1B).
Figure 1.
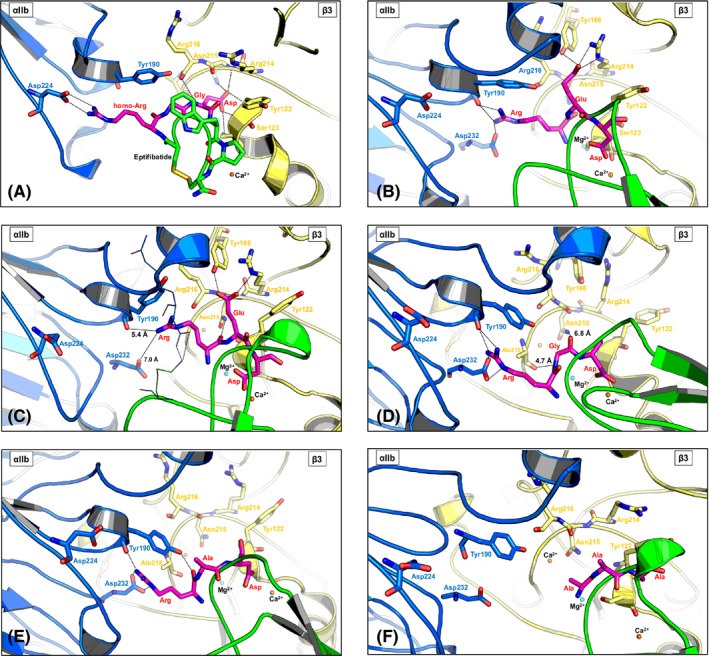
Molecular docking and molecular dynamics (MD) simulation with disagregin and different variants (RGD‐, RAD‐, and AAA‐disagregin). For all figures, the same colors were used to display αIIb (blue), β3 (yellow), inhibitors (eptifibatide and disagregin variants in green and magenta), and the key motif (magenta sticks). H‐bonds are displayed in dashed lines. A, X‐ray structure of αIIbβ3 in complex with eptifibatide (2VDN ‐ re‐refinement of αIIbβ3 headpiece bound to eptifibatide). Eptifibatide interacts with residues from both the αIIb and β3 domain. B, Molecular docking of disagregin (green) with αIIbβ3. The RED motif (magenta sticks) of disagregin binds to αIIbβ3 in a similar way as the homo‐Arg‐Gly‐Asp motif of eptifibatide, and this RED motif of disagregin can interact with residues from both the αIIb and β3 domain. C, The complex between disagregin and αIIbβ3 after MD simulation (20 ns). The RED motif (magenta sticks) of disagregin still fits into the binding pocket of αIIbβ3 and still exhibits interactions (H‐bonds or electrostatic interactions) with residues from both αIIb and β3 domain. D, The complex between RGD‐disagregin and αIIbβ3 after MD simulation (20 ns). E, The complex between RAD‐disagregin and αIIbβ3 after MD simulation (20 ns). F, The complex between AAA‐disagregin and αIIbβ3 after MD simulation (20 ns)
The derived docking complex of disagregin and αIIbβ3 was further subjected to MD simulations to investigate the stability of disagregin at the binding pocket of αIIbβ3. The last snapshot of the MD simulations showed that the RED motif of disagregin stably remained in the binding pocket of αIIbβ3 (Figure 1C). Although the side chain of the Arg residue of the RED motif was quite flexible, resulting in losing H‐bonds with Tyr190 and Asp232 of the αIIb domain, the electrostatic interactions between the side chain of the Arg residue with these residues were still detected. Moreover, the backbone atom of the Arg residue formed an additional H‐bond with the side chain of Asn215 of the β3 domain. The interactions between the Glu and Asp residues with integrin αIIbβ3 were conserved as in the starting structure before running MD simulations. Mutation of RED to RGD led to an increased flexibility of the RGD motif, which allowed the Arg residues to form stable H‐bonds with Tyr190 and Asp232 of the αIIb domain (Figure 1D). Due to the lacking side chain, the Gly residue could not establish H‐bonds with Tyr166 and Arg214 of the β3 domain as found in the Glu residue (RED motif). However, the backbone atoms of the Gly residue exhibited electrostatic interactions with Asn215 and Ala218 of the β3 domain (Figure 1D). The interaction between the Asp residue and the Ca atom was still observed in the simulation with RGD‐disagregin.
To prove the importance of RED/RGD motif of disagregin for binding to αIIbβ3, we also generated complexes between RAD‐ and AAA‐disagregin with αIIbβ3. For RAD‐disagregin (Figure 1E), only interactions between the Arg residue and Tyr190 and Asp232 of the αIIb domain were found, whereas the Ala residue could not establish any interactions with any residues of αIIbβ3. The RAD motif was quite flexible during the simulation, resulting in losing the interactions between the Asp residue and the Ca atom. In the case of AAA‐disagregin, the derived results demonstrated that the AAA motif cannot form any interactions with αIIbβ3 (Figure 1F).
The BFEs of these disagregin variants (RED‐, RGD‐, RAD, and AAA‐disagregin) with αIIbβ3 are in agreement with experimental results and point out the essential roles of RED/RGD motif for binding to αIIbβ3 (Table S2). The BFE value of RGD‐disagregin (−21 kcal/mol) was slightly lower than disagregin (−15 kcal/mol), which supported the experiments showing that RGD‐disagregin exhibited a slightly better inhibitory activity than disagregin. A dramatically significant reduction of BFE values of RAD‐ and AAA‐disagregin with αIIbβ3 (−8 and 8 kcal/mol for RAD‐ and AAA‐disagregin, respectively) indicated the importance of the RED/RGD sequence for binding with αIIbβ3. Especially, the positive BFE value of AAA‐disagregin with αIIbβ3 implied an unfavorable binding of this variant with αIIbβ3.
3.2. Peptide synthesis
Disagregin and RGD‐disagregin were successfully synthesized with Boc‐based solid‐phase peptide synthesis and native chemical ligation (Figure 2A, B). Due to oxidative folding problems with other variants, we chose to continue experiments with disagregin and RGD‐disagegin. Purity was verified by HPLC analysis and mass spectrometry (Figure 2C). HPLC chromatograms demonstrated a single UV absorbance peak for both proteins (Figure S1). The measured monoisotopic mass of disagregin (6951.1) and RGD‐disagregin (6879.4) corresponded well with their calculated monoisotopic masses, 6950.9 Da and 6878.9 Da, respectively (Figure S2). The predicted structure of disagregin is shown in Figure 2D.
3.3. Inhibition of platelet aggregation by disagregins
To probe the ability of the synthesized disagregin and RGD‐disagregin to abrogate αIIbβ3‐dependent platelet aggregation, light transmission aggregometry was performed using PRP. After preincubation with different concentrations of disagregin, RGD‐disagregin or eptifibatide, the platelets were activated with intermediate doses of agonists. Eptifibatide was used as a control. In response to ADP or collagen, disagregin inhibited aggregation with half maximal inhibitory concentration (IC50) values of 99 nM and 64 nM, respectively (Figure 3A, B). For further comparison of the disagregins, two relevant concentrations were chosen: 100 nM (~IC50) and 1 µM (~10× IC50). At the higher concentration of 1 µM, disagregin was strongly effective in both ADP (P < .01) and collagen‐activated aggregation (P < .05), comparable to eptifibatide (Figure 3C, D). At this concentration, RGD‐disagregin inhibited aggregation with ADP (P < .05) and collagen (P < .01). The lower dose of RGD‐disagregin (P < .01), but not of disagregin, significantly reduced platelet aggregation with collagen (Figure 3D).
Figure 3.
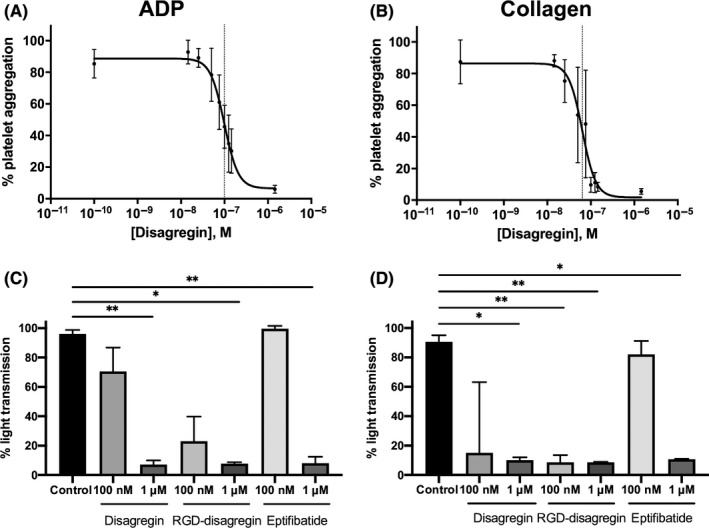
Suppression by disagregin, RGD‐disagregin, and eptifibatide of agonist‐induced platelet aggregation. Human platelet‐rich plasma was preincubated with indicated concentrations of disagregin, RGD‐disagregin or eptifibatide for 2 minutes, after which platelet aggregation was measured with 5 μM ADP or 1 μg/mL collagen. A, Effect of disagregin on ADP‐induced platelet aggregation. Calculated half maximal inhibitory concentration (IC50) for disagregin 99 nM (n = 10). B, Effect of disagregin on collagen‐induced platelet aggregation. Calculated IC50 for disagregin 64 nM (n = 10). C, D, Quantified maximal platelet aggregation (% light transmission change) with disagregin, RGD‐disagregin, or eptifibatide (1 μM or 100 nM) in response to stimulation with ADP (C) or collagen (D). Data are presented as medians ± interquartile ranges. *P < .05, **P < .01
3.4. Assessment of whole‐blood platelet aggregation and thrombus formation under flow
To further investigate the observed antiaggregatory effect of disagregin, a multiparameter assay of collagen‐dependent thrombus formation in whole blood under arterial flow conditions was performed. 26 This test has previously been shown to detect the absence of flow‐dependent platelet aggregation in patients with Glanzmann thrombasthenia, lacking integrin αIIbβ3, 28 or with leukocyte adhesion deficiency III syndrome, defective αIIbβ3 activation. 29 For this assay, citrate‐anticoagulated blood was preincubated with disagregin, RGD‐disagregin or eptifibatide, and subsequently recalcified in the presence of PPACK and flowed at a high shear rate (1000 s‐1) over collagen I microspots. After 3.5 minutes of flow, bright‐field and fluorescence microscopic images were collected to measure P‐selectin expression (AF647‐labeled anti–P‐selectin mAb), platelet procoagulant activity (AF568‐annexin A5) and activated integrins by fibrinogen binding (FITC‐labeled fibrinogen mAb). Representative stills after 3.5 minutes are shown in Figure 4A. In control condition, medium aggregates were formed of contracted platelets, exposing P‐selectin as well as PS, with activated integrins. In the presence of 1‐µM disagregin or RGD‐disagregin, the formation of multilayered thrombi and contracted thrombi was strongly suppressed (P < .05), resulting in single platelets adhesion. In contrast, the low concentration of both disagregins and 1 µM eptifibatide still showed the presence of multilayered and contracted thrombi (Figure 4A, B, C). Both PS exposure and P‐selectin expression were partially decreased in all conditions compared to control; however, it has not reached significance (Figure 4A). In the presence of disagregin (1 µM), fibrinogen binding was no longer observed, indicative of abolished integrin activation (P < .05) (Figure 4D). Table S4 shows the significant decrease in morphological score, multilayer score, contraction score, and integrin activation by the addition of disagregin and RGD‐disagregin (Table S4).
Figure 4.
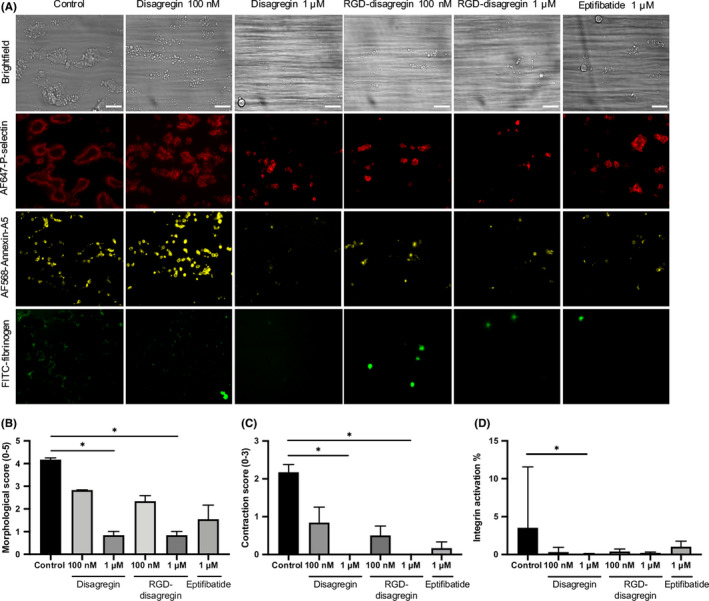
Effect of (RGD‐)disagregin on microspot‐induced whole‐blood thrombus formation. Citrated blood was preincubated with disagregin or RGD‐disagregin, recalcified with D‐phenylalanyl‐prolyl‐arginyl chloromethyl ketone (PPACK), and then flowed through a microfluidic chamber at wall‐shear rate of 1000 s‐1. After 3.5 minutes, thrombi were stained with AF647‐labeled anti‐P‐selectin monoclonal antibody (mAb), AF568‐annexin A5, and fluorescein isothiocyanate–labeled fibrinogen mAb. Eptifibatide was used as a reference integrin agonist. A, Representative bright‐field and fluorescence microscopic images from collagen I microspots after 3.5 minutes of flow. Bars = 20 μm. Note dose‐dependent reduction of platelet adhesion, platelet aggregation, P‐selectin, phosphatidylserine exposure, and integrin activation (measured by fibrinogen binding) with indicated inhibitors. B, Decreased morphological score with various integrin inhibitors. C, Decreased contraction score with various integrin inhibitors. D, Decreased integrin activation with various integrin inhibitors. Data are presented as medians ± interquartile ranges. *P < .05
3.5. Time‐dependent assessment of platelet‐fibrin thrombus formation under flow
Subsequently, we established how the disagregins affected flow‐dependent thrombus formation in the presence of coagulation triggered by TF, that is, when thrombin and fibrin are generated. Therefore, a previously validated multiparameter test was used, in which whole blood is perfused at a high shear rate over collagen I and collagen I/TF microspots. Series of microscopic images were collected in real time to measure platelet deposition (DiOC6 label), platelet procoagulant activation (AF568‐annexin A5) and fibrin formation (AF647‐fibrinogen label, with threshold setting above fibrinogen fluorescence). 27 In the control samples, at the 10‐minute time point, large aggregates were formed of contracted platelets, showing massive PS exposure and fibrin formation (Figure 5A). In the presence of 1 µM disagregin, only single platelets adhered, which did neither aggregate nor displayed PS exposure or fibrin formation (3.3% PS exposure for control and 0.5% for 1 µM disagregin) and fibrin formation (31% for control compared to 1% in the presence of 1 µM disagregin). The lower concentration of 100 nM disagregin partially suppressed platelet aggregate and fibrin formation, while PS exposure was still abolished. Overall, the addition of 1 µM or 100 nM RGD‐disagregin resulted in similar effects compared to disagregin at the same concentrations. Remarkably, the addition of 1 µM eptifibatide showed less inhibition in suppressing PS exposure and fibrin formation than disagregin at the same dose (not significant). This was also observed by measurement of the times to first fibrin formation. Whereas 1 µM disagregin or RGD‐disagregin delayed time to fibrin from 5 to 12‐13 minutes (P < .01), 1 µM eptifibatide only partially delayed to 10 minutes (Figure 5B).
Figure 5.
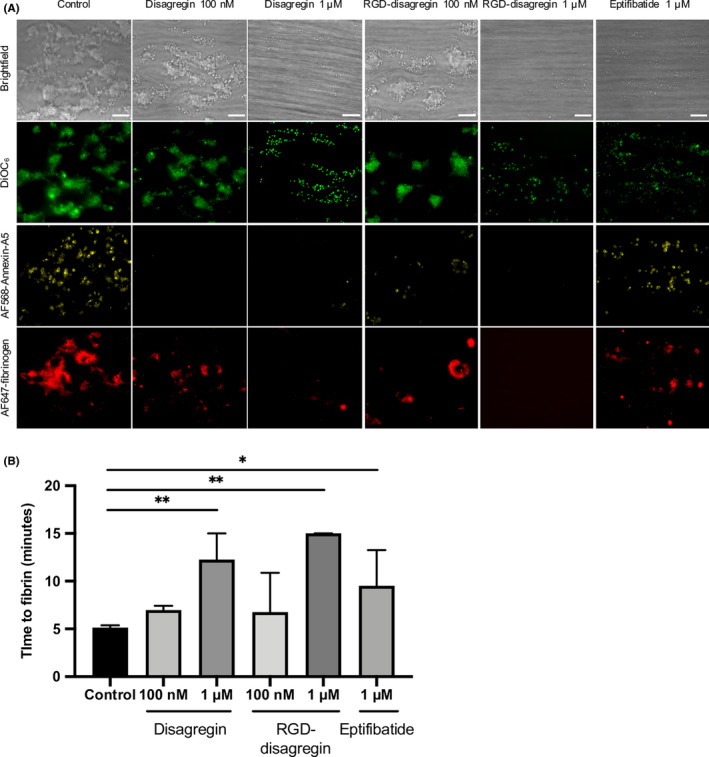
Similar impairments in platelet‐fibrin thrombus formation by disagregin and RGD‐disagregin. Citrated blood was prelabeled with 3,3′‐dihexyloxacarbocyanine iodide, AF568‐annexin A5, and AF647 human fibrinogen. Samples were preincubated with disagregin or RGD‐disagregin, recalcified with CaCl2 and MgCl2, and then flowed through a microfluidic chamber at a wall‐shear rate of 1000 s‐1. Eptifibatide was used as a reference integrin agonist. A, Representative bright‐field and fluorescence microscopic images from collagen I/tissue factor microspots after 10 minutes of flow. Bars = 20 μm. Note dose‐dependent reduction of platelet adhesion, absence of platelet aggregation, and delay of fibrin formation with indicated inhibitors. B, Delayed time to first fibrin formation under flow with various integrin inhibitors. Data are presented as medians ± interquartile ranges. *P < .05, **P < .01
To quantitatively compare the effects of integrin inhibitors on all scaled parameters over time (Table S3), subtraction heat maps were constructed for the spots containing collagen I and collagen I/TF (Figure 6A, B). As before, we distinguished between platelet adhesion parameters (P1‐2), thrombus parameters (P3‐6), and fibrin parameters (P7‐9). 27 Remarkably, the lower dose of 100 nM disagregins only moderately reduced and delayed all parameters, with RGD‐disagregin being slightly more effective than disagregin. On the other hand, the higher dose of 1 µM disagregin or RGD‐disagregin effectively suppressed all thrombus (and platelet aggregation) parameters, and inhibited fibrin formation on the TF microspots. Eptifibatide at 1 µM showed a similar inhibitory pattern but overall was less effective. Note that on collagen I only microspots, the amounts of fibrin formed were already low in the absence of inhibitors. Taken together, these results indicated that RGD‐disagregin is similarly active as disagregin in abrogating platelet adhesion, aggregation, and fibrin formation under flow conditions.
Figure 6.
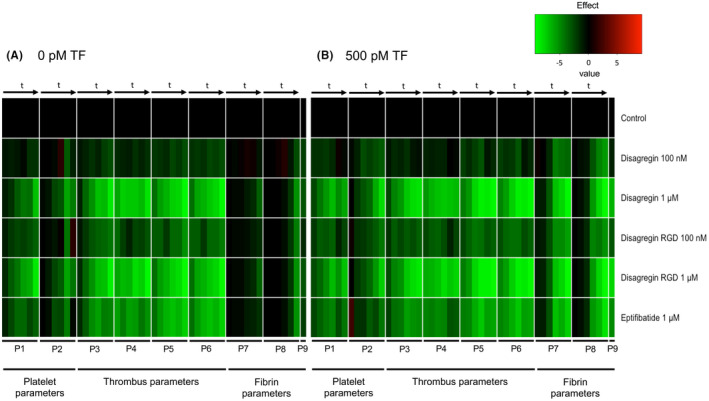
Time‐dependent sustained effects of platelet‐aggregation inhibitors on platelet, thrombus, and fibrin parameters under coagulating conditions. Citrated blood was preincubated with indicated concentrations of disagregin, RGD‐disagregin, or eptifibatide. Blood perfusion was performed under continuous recalcification over collagen I microspots with or without tissue factor (TF) at a shear rate of 1000 s‐1. Data of thrombus parameters (P1‐9) were obtained from real‐time microscopic images taken at 2, 4, 6, 8, 10, 12, 14 minutes (t arrows). For coding, see Table S3. Mean values were univariate scaled per parameter (scale 0‐10). Data of P1‐9 without addition (control) were set at 0 for reference. A, Subtraction heat map after scaling representing effects of inhibitors on thrombus and fibrin formation without TF. B, Subtraction heat map after scaling representing effects of inhibitors on thrombus and fibrin formation with TF. Color scale from green to black to red: light green represents lower than control, black represents same as control. Time to fibrin formation (P9) subtracted. Data are means of n = 5 blood samples
3.6. Cell proliferation with the addition of different compounds
Cell proliferation studies were performed to determine if the disagregins have toxic effects on endothelial cells (EA.hy926) (Figure S3). In this cell line used, the disagregins did not show obvious toxic effects, in that proliferation of cells was maintained by the addition of disagregin, RGD‐disagregin, or eptifibatide.
4. DISCUSSION
In this study, the inhibitory effects of disagregin and RGD‐disagregin were investigated by light transmission aggregometry and whole‐blood thrombus formation under flow conditions. We confirmed that disagregin and RGD‐disagregin inhibited platelet aggregation stimulated by ADP or collagen. While our reported light transmission aggregometry IC50 value for disagregin was similar to a previous study, we used chemically synthesized peptides instead of salivary gland extracts from ticks, confirming that chemically synthesized disagregin inhibits equally well as tick disagregin, indicating that the functional influence of posttranslational modifications of both proteins on platelet aggregation is minimal. 3
In this article, we have taken advantage of chemically synthesized peptides enabling rapid production on a large scale and incorporation or deletion of amino acids in a site‐specific way to investigate antiplatelet activities. This ability will open the door to future preclinical studies. 30 Since the antibody abciximab and eptifibatide are at limited use for kidney failure patients, a synthesized small peptide offers a clear advantage for a targeted and antidote‐sensitive way to (temporarily) suppress platelet function after administration of the drug. 31
Various integrin antagonists expose an RGD sequence for specific binding to these activated receptors. RAD‐containing compounds are often used as control, which do not bind to activated integrins. 32 In this article, there is no difference in antiplatelet effects between disagregin and RGD‐disagregin. Disagregin has a negatively charged side chain (glutamate), and RGD‐disagregin does not have a side chain (glycine). Remarkably, a bulky acid group does not influence the antiplatelet effects. Although disintegrins bind to the αIIbβ3 and other integrin receptors via their exposed RGD sequence, the presence of this tripeptide sequence is not a prerequisite for the antagonistic integrin activity. Disintegrins containing similar to RGD sequences, such as hRGD, KGD, or RED, to bind integrins have been described, but barbourin is one of the few natural proteins that selectively binds the αIIbβ3 receptor and does not have an RGD‐like sequence. 33 , 34
Our in silico molecular docking and molecular dynamics simulations revealed that disagregin binds to αIIbβ3 in a similar way as eptifibatide. The RED/RGD sequence of disagregin and RGD‐disagregin, respectively, interacts with residues from both the αIIb and β3 domain and also with the Ca atom. Mutation of RED/RGD‐disagregin to RAD‐ or AAA‐disagregin resulted in losing interactions and consequently significantly reduced BFE with αIIbβ3. Taken together, these results demonstrated that the RED/RGD sequence is the key motif for interacting with αIIbβ3 and thus responsible for the antiplatelet function of disagregin.
Multiparameter assessment of whole‐blood thrombus formation on collagen I surfaces indicated less platelet adhesion by the addition of the inhibitors and no aggregate formation in the presence of disagregin or RGD‐disagregin. A previous study by van Geffen et al 28 showed a comparable result when testing blood of patients with Glanzmann thrombasthenia, showing single‐platelet adhesion and platelet monolayer. Ex vivo whole‐blood thrombus formation was also tested in mouse blood, showing similar results (data not shown).
Disagregin and RGD‐disagregin showed more inhibition compared to eptifibatide in our experiments in vitro. Harder et al 35 showed LTA IC50 values ranging from 132 to 264 nM for eptifibatide. However, in our hands, it appeared that high concentrations of eptifibatide did not delay the time to fibrin formation as potently as the disagregins. Importantly, if disagregin would inhibit platelet adhesion, aggregation, and fibrin formation in vivo as well, a lower dose of disagregin could be administered compared to eptifibatide in preclinical studies.
Cell proliferation studies pointed to the absence of strong toxic effects (Figure S3). However, more toxicity research in other cell lines is necessary to conclude that in vivo studies can be performed without expected toxicity.
Research is necessary to further modify the reversible binding ability of disagregin to the αIIbβ3 integrin receptor and to design the best selective protein sequence for a dose‐controllable antagonist.
A limitation of this study might be the use of labeled fibrinogen to detect fibrin in our experiments. However, we decreased the contribution of fibrinogen to the fibrin signal by threshold settings and bright‐field images were used to confirm fluorescent fibers. 36 , 37 With labeled fibrinogen we prevent the underestimation of fibrin because of poor permeation of an antibody in the thrombus. 38
Taken together, we conclude that disagregin and RGD‐disagregin are potential αIIbβ3 integrin inhibitors by inhibiting platelet adhesion, aggregation, and fibrin formation.
RELATIONSHIP DISCLOSURE
The authors declare no conflicts of interest.
AUTHOR CONTRIBUTIONS
DLK performed and analyzed the experiments and wrote the manuscript. MN performed flow experiments and wrote parts of the manuscript. KW performed the in silico studies. SLNB performed flow assays and helped with analysis of flow data. JWMH devised the in vitro experiments and edited the manuscript. TMH devised and analyzed experiments and edited the manuscript. ID designed chemical protein synthesis, analyzed experiments, and wrote and edited the manuscript.
Supporting information
Supplementary Material
ACKNOWLEDGMENTS
We gratefully acknowledge Wouter Aarts for support with peptide synthesis. This work was supported by Netherlands Organization for Scientific Research (NWO) Grants VIDI 723.013.009 and Aspasia 0.15.010.005 (to ID) and in part by the Van de Laar Foundation on Biochemistry of Cardiovascular Disease (to DLK).
van den Kerkhof DL, Nagy M, Wichapong K, et al. Inhibition of platelet adhesion, thrombus formation, and fibrin formation by a potent αIIbβ3 integrin inhibitor from ticks. Res Pract Thromb Haemost.2021;5:231–242. 10.1002/rth2.12466
Handling Editor: Prof. Yotis Senis.
DATA AVAILABILITY STATEMENT
All authors read the manuscript and approved for submission to RPTH
REFERENCES
- 1. Versteeg HH, Heemskerk JW, Levi M, Reitsma PH. New fundamentals in hemostasis. Physiol Rev. 2013;93(1):327–58. [DOI] [PubMed] [Google Scholar]
- 2. Hovius JW, Levi M, Fikrig E. Salivating for knowledge: potential pharmacological agents in tick saliva. PLoS Medicine. 2008;5(2):e43. [DOI] [PMC free article] [PubMed] [Google Scholar]
- 3. Karczewski J, Endris R, Connolly TM. Disagregin is a fibrinogen receptor antagonist lacking the Arg‐Gly‐Asp sequence from the tick Ornithodoros moubata. J Biol Chem. 1994;269(9):6702–8. [PubMed] [Google Scholar]
- 4. Assumpcao TC, Ribeiro JM, Francischetti IM. Disintegrins from hematophagous sources. Toxins (Basel). 2012;4(5):296–322. [DOI] [PMC free article] [PubMed] [Google Scholar]
- 5. Kalantzi KI, Tsoumani ME, Goudevenos IA, Tselepis AD. Pharmacodynamic properties of antiplatelet agents: current knowledge and future perspectives. Expert Rev Clin Pharmacol. 2012;5(3):319–36. [DOI] [PubMed] [Google Scholar]
- 6. Keller PM, Waxman L, Arnold BA, Schultz LD, Condra C, Connolly TM. Cloning of the cDNA and expression of moubatin, an inhibitor of platelet aggregation. J Biol Chem. 1993;268(8):5450–6. [PubMed] [Google Scholar]
- 7. Mans BJ, Coetzee J, Louw AI, Gaspar AR, Neitz AW. Disaggregation of aggregated platelets by apyrase from the tick, Ornithodoros savignyi (Acari: Argasidae). Exp Appl Acarol. 2000;24(4):271–82. [DOI] [PubMed] [Google Scholar]
- 8. Mans BJ, Gaspar AR, Louw AI, Neitz AW. Apyrase activity and platelet aggregation inhibitors in the tick Ornithodoros savignyi (Acari: Argasidae). Exp Appl Acarol. 1998;22(6):353–66. [DOI] [PubMed] [Google Scholar]
- 9. Ribeiro JM, Endris TM, Endris R. Saliva of the soft tick, Ornithodoros moubata, contains anti‐platelet and apyrase activities. Comp Biochem Physiol A Comp Physiol. 1991;100(1):109–12. [DOI] [PubMed] [Google Scholar]
- 10. Wang X, Coons LB, Taylor DB, Stevens SE Jr, Gartner TK. Variabilin, a novel RGD‐containing antagonist of glycoprotein IIb‐IIIa and platelet aggregation inhibitor from the hard tick Dermacentor variabilis. J Biol Chem. 1996;271(30):17785–90. [DOI] [PubMed] [Google Scholar]
- 11. Waxman L, Connolly TM. Isolation of an inhibitor selective for collagen‐stimulated platelet aggregation from the soft tick Ornithodoros moubata. J Biol Chem. 1993;268(8):5445–9. [PubMed] [Google Scholar]
- 12. Ribeiro JM, Makoul GT, Robinson DR. Ixodes dammini: evidence for salivary prostacyclin secretion. J Parasitol. 1988;74(6):1068–9. [PubMed] [Google Scholar]
- 13. Ribeiro JM, Makoul GT, Levine J, Robinson DR, Spielman A. Antihemostatic, antiinflammatory, and immunosuppressive properties of the saliva of a tick, Ixodes dammini. J Exp Med. 1985;161(2):332–44. [DOI] [PMC free article] [PubMed] [Google Scholar]
- 14. Karczewski J, Connolly TM. The interaction of disagregin with the platelet fibrinogen receptor, glycoprotein IIb‐IIIa. Biochem Biophys Res Commun. 1997;241(3):744–8. [DOI] [PubMed] [Google Scholar]
- 15. Schror K, Weber AA. Comparative pharmacology of GP IIb/IIIa antagonists. J Thromb Thrombolysis. 2003;15(2):71–80. [DOI] [PubMed] [Google Scholar]
- 16. Hashemzadeh M, Furukawa M, Goldsberry S, Movahed MR. Chemical structures and mode of action of intravenous glycoprotein IIb/IIIa receptor blockers: a review. Exp Clin Cardiol. 2008;13(4):192–7. [PMC free article] [PubMed] [Google Scholar]
- 17. Arnold K, Bordoli L, Kopp J, Schwede T. The SWISS‐MODEL workspace: a web‐based environment for protein structure homology modelling. Bioinformatics. 2006;22(2):195–201. [DOI] [PubMed] [Google Scholar]
- 18. van Zundert GCP, Rodrigues J, Trellet M, Schmitz C, Kastritis PL, Karaca E, et al. The HADDOCK2.2 web server: user‐friendly integrative modeling of biomolecular complexes. J Mol Biol. 2016;428(4):720–5. [DOI] [PubMed] [Google Scholar]
- 19. Eckardt V, Miller MC, Blanchet X, Duan R, Leberzammer J, Duchene J, et al. Chemokines and galectins form heterodimers to modulate inflammation. EMBO Rep. 2020;21(4):e47852. [DOI] [PMC free article] [PubMed] [Google Scholar]
- 20. Miller MC, Cai C, Wichapong K, Bhaduri S, Pohl NLB, Linhardt RJ, et al. Structural insight into the binding of human galectins to corneal keratan sulfate, its desulfated form and related saccharides. Sci Rep. 2020;10(1):15708. [DOI] [PMC free article] [PubMed] [Google Scholar]
- 21. Schnolzer M, Alewood P, Jones A, Alewood D, Kent SB. In situ neutralization in Boc‐chemistry solid phase peptide synthesis. Rapid, high yield assembly of difficult sequences. Int J Pept Protein Res. 1992;40(3–4):180–93. [DOI] [PubMed] [Google Scholar]
- 22. Hackeng TM, Griffin JH, Dawson PE. Protein synthesis by native chemical ligation: expanded scope by using straightforward methodology. Proc Natl Acad Sci U S A. 1999;96(18):10068–73. [DOI] [PMC free article] [PubMed] [Google Scholar]
- 23. Denisov SS, Heinzmann ACA, Vajen T, Vries MHM, Megens RTA, Suylen D, et al. Tick saliva protein evasin‐3 allows for visualization of inflammation in arteries through interactions with CXC‐type chemokines deposited on activated endothelium. Bioconjug Chem. 2020;31(3):948–55. [DOI] [PMC free article] [PubMed] [Google Scholar]
- 24. Dawson PE, Muir TW, Clark‐Lewis I, Kent SB. Synthesis of proteins by native chemical ligation. Science. 1994;266(5186):776–9. [DOI] [PubMed] [Google Scholar]
- 25. Gilio K, Munnix IC, Mangin P, Cosemans JM, Feijge MA, van der Meijden PE, et al. Non‐redundant roles of phosphoinositide 3‐kinase isoforms alpha and beta in glycoprotein VI‐induced platelet signaling and thrombus formation. J Biol Chem. 2009;284(49):33750–62. [DOI] [PMC free article] [PubMed] [Google Scholar]
- 26. de Witt SM, Swieringa F, Cavill R, Lamers MM, van Kruchten R, Mastenbroek T, et al. Identification of platelet function defects by multi‐parameter assessment of thrombus formation. Nat Commun. 2014;5:4257. [DOI] [PMC free article] [PubMed] [Google Scholar]
- 27. Brouns SLN, van Geffen JP, Campello E, Swieringa F, Spiezia L, van Oerle R, et al. Platelet‐primed interactions of coagulation and anticoagulation pathways in flow‐dependent thrombus formation. Sci Rep. 2020;10(1):11910. [DOI] [PMC free article] [PubMed] [Google Scholar]
- 28. van Geffen JP, Brouns SLN, Batista J, McKinney H, Kempster C, Nagy M, et al. High‐throughput elucidation of thrombus formation reveals sources of platelet function variability. Haematologica. 2019;104(6):1256–67. [DOI] [PMC free article] [PubMed] [Google Scholar]
- 29. Nagy M, Mastenbroek TG, Mattheij NJA, de Witt S, Clemetson KJ, Kirschner J, et al. Variable impairment of platelet functions in patients with severe, genetically linked immune deficiencies. Haematologica. 2018;103(3):540–9. [DOI] [PMC free article] [PubMed] [Google Scholar]
- 30. Chandrudu S, Simerska P, Toth I. Chemical methods for peptide and protein production. Molecules. 2013;18(4):4373–88. [DOI] [PMC free article] [PubMed] [Google Scholar]
- 31. Van Tuyl JS, Newsome AS, Hollis IB. Perioperative bridging with glycoprotein IIb/IIIa inhibitors versus cangrelor: balancing efficacy and safety. Ann Pharmacother. 2019;53(7):726–37. [DOI] [PubMed] [Google Scholar]
- 32. Schraa AJ, Kok RJ, Berendsen AD, Moorlag HE, Bos EJ, Meijer DK, et al. Endothelial cells internalize and degrade RGD‐modified proteins developed for tumor vasculature targeting. J Control Release. 2002;83(2):241–51. [DOI] [PubMed] [Google Scholar]
- 33. Dennis MS, Henzel WJ, Pitti RM, Lipari MT, Napier MA, Deisher TA, et al. Platelet glycoprotein IIb‐IIIa protein antagonists from snake venoms: evidence for a family of platelet‐aggregation inhibitors. Proc Natl Acad Sci U S A. 1990;87(7):2471–5. [DOI] [PMC free article] [PubMed] [Google Scholar]
- 34. Scarborough RM, Rose JW, Hsu MA, Phillips DR, Fried VA, Campbell AM, et al. Barbourin. A GPIIb‐IIIa‐specific integrin antagonist from the venom of Sistrurus m. barbouri. J Biol Chem. 1991;266(15):9359–62. [PubMed] [Google Scholar]
- 35. Harder S, Klinkhardt U, Graff J, Westrup D, Kirchmaier CM, Glusa E, et al. In vitro dose response to different GPIIb/IIIa‐antagonists: inter‐laboratory comparison of various platelet function tests. Thromb Res. 2001;102(1):39–48. [DOI] [PubMed] [Google Scholar]
- 36. Cosemans JM, Schols SE, Stefanini L, de Witt S, Feijge MA, Hamulyak K, et al. Key role of glycoprotein Ib/V/IX and von Willebrand factor in platelet activation‐dependent fibrin formation at low shear flow. Blood. 2011;117(2):651–60. [DOI] [PMC free article] [PubMed] [Google Scholar]
- 37. Thomassen S, Mastenbroek TG, Swieringa F, Winckers K, Feijge MAH, Schrijver R, et al. Suppressive role of tissue factor pathway inhibitor‐alpha in platelet‐dependent fibrin formation under flow is restricted to low procoagulant strength. Thromb Haemost. 2018;118(3):502–13. [DOI] [PMC free article] [PubMed] [Google Scholar]
- 38. Berny MA, Munnix IC, Auger JM, Schols SE, Cosemans JM, Panizzi P, et al. Spatial distribution of factor Xa, thrombin, and fibrin(ogen) on thrombi at venous shear. PLoS One. 2010;5(4):e10415. [DOI] [PMC free article] [PubMed] [Google Scholar]
Associated Data
This section collects any data citations, data availability statements, or supplementary materials included in this article.
Supplementary Materials
Supplementary Material
Data Availability Statement
All authors read the manuscript and approved for submission to RPTH