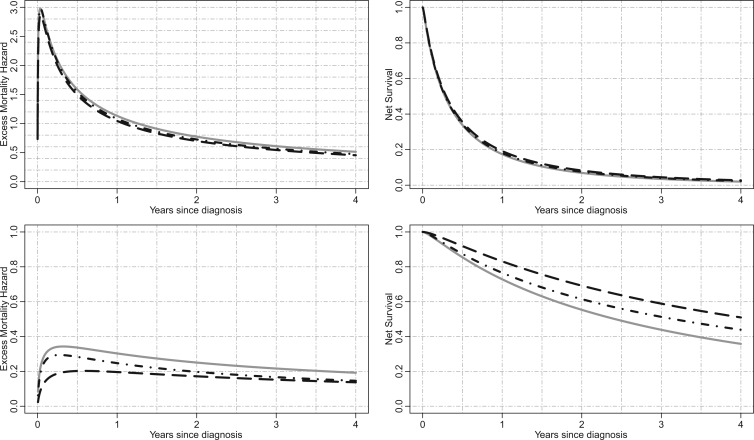
Fig. 3.
Illustration for lung cancer patients: Excess mortality hazard (left panels) and the corresponding net survival (right panels) for men aged 70 years at diagnosis, with Income Deprivation score equals to 0.1 (i.e. least deprived), without Cardiovascular comorbidity nor COPD, and with stage IV cancer at diagnosis (upper panels) or stage II cancer at diagnosis (lower panels). M1=solid grey lines, M2=dot-dashed black lines, M3=long-dashed black lines.

