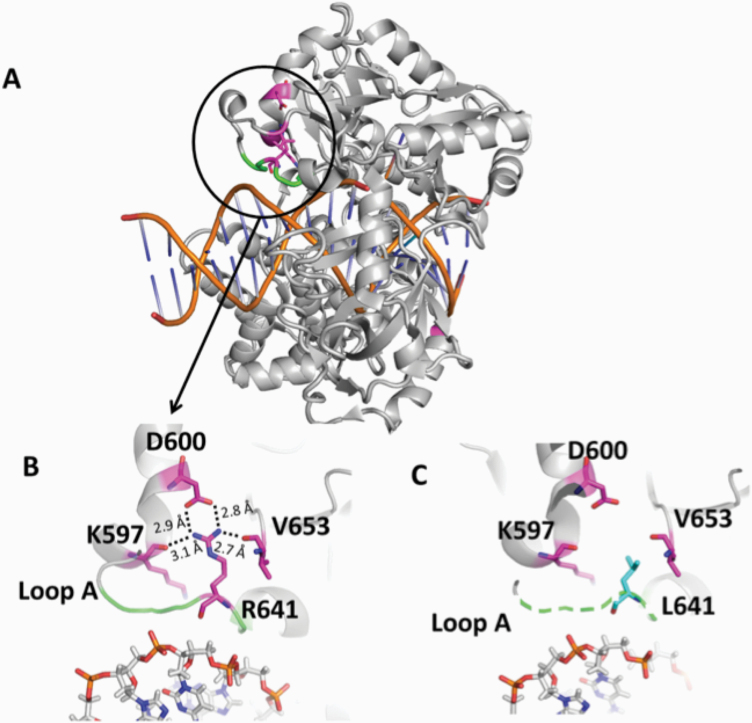
Figure 7.
Structure model of LIG1 with R641L identified in LIG1 deficiency syndrome. (A) Ribbon diagram showing LIG1 encircling a nicked DNA duplex (orange). Arg641 (magenta) shown as sticks is located in Loop A (green). (B) Arg641 (R641) interacts with K597, D600 and V653, and (C) the replacement of Arg641 with Leu (L641) disrupts the interaction and destabilises Loop A (shown in dotted green line). All residues are shown as sticks. Positive and negative potentials are shown in blue and red, respectively.

