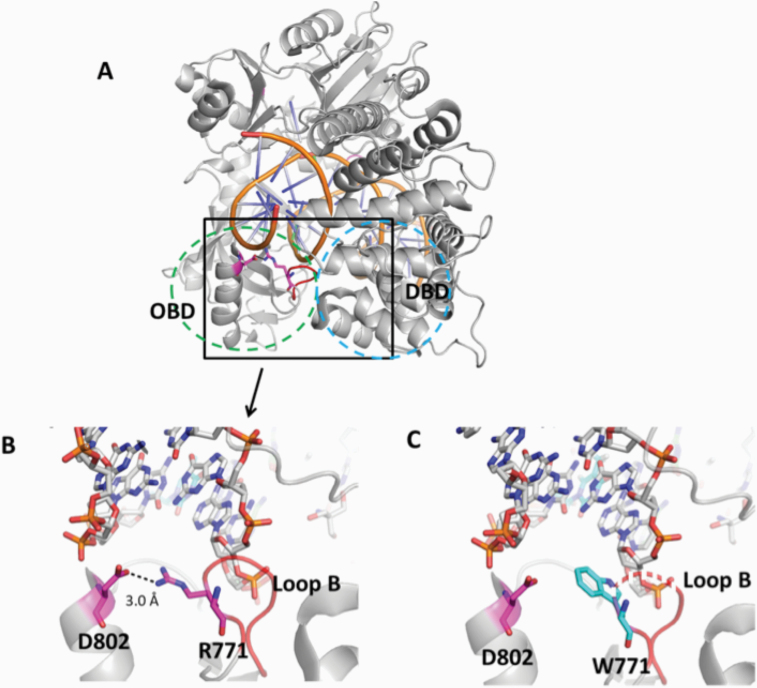
Figure 8.
Structure model of LIG1 with R771W identified in LIG1 deficiency syndrome. (A) Ribbon diagram showing LIG1 encircling a nicked DNA duplex (orange). Arg771 (magenta) shown as sticks is located in Loop B (red) that resides in the OBD domain (green dotted circle) and interacts with the DBD (blue dotted circle). (B) Arg771 (R771) interacts with D802 (magenta) to stabilise the loop B, and (C) replacement of Arg771 with Trp (cyan, W771) disrupts this interaction and destabilises Loop B (shown in dotted red line). All residues are shown as sticks. Positive and negative potentials are shown in blue and red, respectively.

