

Abstract
Background
Conventional pressure support ventilation (PSP) is triggered and cycled off by pneumatic signals such as flow. Patient-ventilator asynchrony is common during pressure support ventilation, thereby contributing to an increased inspiratory effort. Using diaphragm electrical activity, neurally controlled pressure support (PSN) could hypothetically eliminate the asynchrony and reduce inspiratory effort. The purpose of this study was to compare the differences between PSN and PSP in terms of patient-ventilator synchrony, inspiratory effort, and breathing pattern.
Methods
Eight post-operative patients without respiratory system comorbidity, eight patients with acute respiratory distress syndrome (ARDS) and obvious restrictive acute respiratory failure (ARF), and eight patients with chronic obstructive pulmonary disease (COPD) and mixed restrictive and obstructive ARF were enrolled. Patient-ventilator interactions were analyzed with macro asynchronies (ineffective, double, and auto triggering), micro asynchronies (inspiratory trigger delay, premature, and late cycling), and the total asynchrony index (AI). Inspiratory efforts for triggering and total inspiration were analyzed.
Results
Total AI of PSN was consistently lower than that of PSP in COPD (3% vs. 93%, P = 0.012 for 100% support level; 8% vs. 104%, P = 0.012 for 150% support level), ARDS (8% vs. 29%, P = 0.012 for 100% support level; 16% vs. 41%, P = 0.017 for 150% support level), and post-operative patients (21% vs. 35%, P = 0.012 for 100% support level; 15% vs. 50%, P = 0.017 for 150% support level). Improved support levels from 100% to 150% statistically increased total AI during PSP but not during PSN in patients with COPD or ARDS. Patients’ inspiratory efforts for triggering and total inspiration were significantly lower during PSN than during PSP in patients with COPD or ARDS under both support levels (P < 0.05). There was no difference in breathing patterns between PSN and PSP.
Conclusions
PSN improves patient-ventilator synchrony and generates a respiratory pattern similar to PSP independently of any level of support in patients with different respiratory system mechanical properties. PSN, which reduces the trigger and total patient's inspiratory effort in patients with COPD or ARDS, might be an alternative mode for PSP.
Trial Registration
ClinicalTrials.gov, NCT01979627; https://clinicaltrials.gov/ct2/show/record/NCT01979627.
Keywords: Conventional pressure support ventilation, Inspiratory effort, Mechanical ventilation, Neurally controlled pressure support, Patient-ventilator synchrony
Introduction
Pressure support ventilation is the most widely used partial mode of assistance that minimizes the patient's work of breathing in the patient with respiratory failure due to different pathologies. During conventional pressure support ventilation, the ventilator is triggered from a pneumatic signal generated by the patient effort that is measured in the ventilatory circuit, that is, as flow or pressure,[1] and it is cycled off when the inspiratory flow falls to a predetermined fraction of the peak inspiratory flow, the cycling-off criteria.[2] Ideally, the ventilator trigger and cycling should coincide with the beginning and end of the patient's inspiratory effort.[3] However, it has been demonstrated that patient-ventilator asynchrony is common during pressure support ventilation,[4,5] thereby contributing to an increased work of breathing and an increased duration of mechanical ventilation.[6]
Neurally adjusted ventilatory assistance (NAVA) uses the electrical activity of the diaphragm (EAdi) to trigger and cycle inspiratory assistance and provide it in proportion to the patient's effort.[7–10] Studies have shown that NAVA improves patient-ventilator interactions[11–16] and decreases the effort to trigger the ventilator when compared with pressure support ventilation with pneumatic triggering and cycling off (PSP).[17] However, NAVA is characterized by a lower rate of pressurization than PSP.[18] It has been demonstrated that a lower pressurization rate was associated with higher indexes of patient effort and a higher dyspnea level during PSP.[19] To overcome the lower rate of pressurization during NAVA, a specific NAVA setting has been proposed to generate EAdi controlled pressure support (PSN), which consists of the NAVA level at the maximum level, while limiting peak airway pressure (Pawpeak) by adjusting the upper pressure limit.[18,20,21]
A study showed that PSN improves patient-ventilator synchrony in chronic obstructive pulmonary disease (COPD) patients with restrictive acute respiratory failure (ARF) and intrinsic positive end-expiratory pressure (PEEPi) ≥5 cmH2O.[20] Due to the different time constants of patients with different respiratory system mechanical properties, which will interfere with cycling off during PSP, it is unclear whether the advantages of PSN could be extended to patients without restrictive ARF. This study hypothesizes that PSN will improve patient-ventilator synchrony and reduce the inspiratory effort when compared with PSP with a prefixed trigger and cycling-off criteria in patients with different mechanical properties of their respiratory system. This crossover physiological study aimed to compare the differences between PSN and PSP in terms of patient-ventilator synchrony, inspiratory effort, and breathing pattern.
Methods
Ethical approval
The study was approved by the local Ethics Committee of Zhongda Hospital, Southeast University (No: 2016ZDSYLL067-P01), and informed consent was obtained from the patients or next of kin. The trial was registered at clinicaltrials.gov (NCT04091269).
Study design and patients
This study was conducted in a 60-bed general intensive care unit (ICU) of Zhongda Hospital, Southeast University. To compare the differences between PSN and PSP on patient-ventilator synchrony, patients with three kinds of different mechanical respiratory system properties were enrolled. (1) Patients without obvious restrictive or obstructive ARF: post-operative (overnight) patients who were admitted to the ICU were eligible while meeting the following criteria: receiving invasive mechanical ventilation due to a recent operation (abdominal, orthopedic, or gynecological surgery), without respiratory system comorbidity, static compliance of the respiratory system (CRS) ≥50 mL/cmH2O, and resistance of the respiratory system (RRS) ≤10 cmH2O·L–1·s–1. (2) Patients with obvious restrictive ARF: patients with acute respiratory distress syndrome (ARDS) who were admitted to the ICU were eligible while meeting the following criteria: receiving invasive mechanical ventilation due to ARF, CRS ≤50 mL/cmH2O and RRS ≤10 cmH2O·L–1·s–1. ARDS was defined according to the Berlin definition.[22] (3) Patients with mixed restrictive and obstructive ARF: patients with COPD who were admitted to the ICU were eligible while meeting the following criteria: receiving invasive mechanical ventilation due to ARF, RRS ≥12 cmH2O·L–1·s–1. ARF was defined as an oxygenation index (partial pressure of oxygen/fraction of inspired oxygen [FiO2]) <300 mmHg with or without elevated arterial carbon dioxide tension. COPD was defined as chronic cough, sputum or progressive dyspnea, and a forced vital capacity rate of 1 s (FEV1/FVC) <0.7 after bronchodilation.
Patients were excluded according to the following criteria: (1) age <18 or >85 years, (2) tracheostomy at the time of inclusion, (3) unable to sustain pressure support ventilation for >1 h with inspiratory support ≤15 cmH2O, (4) sedation level on the Richmond Agitation-Sedation Scale ≤−2 or ≥2, (5) contraindication for nasogastric tube insertion (eg, a history of esophageal varices, gastroesophageal surgery in the previous 12 months, or gastroesophageal bleeding in the previous 7 days, international normalized ratio >1.5, activated partial thromboplastin time >44 s, a history of leukemia), (6) hemodynamic instability (heart rate >140 beats/min, vasopressors required with ≥5 μg·kg–1·min–1 dopamine/dobutamine, or ≥0.2 mg·kg–1min–1 norepinephrine), (7) neuromuscular disease affecting spontaneous breathing (eg, history of acute central or peripheral nervous system disorder or neuromuscular disease with irregular spontaneous rhythm), or (8) lack of informed consent or inclusion in another intervention study.
Enrolled patients were switched to a Servo-i ventilator (Maquet, Solna, Stockholm, Sweden), and a 16-Fr nasogastric feeding tube (NeuroVent Research Inc., Toronto, ON, Canada) with electrodes measuring EAdi and balloons measuring esophageal pressure (Pes) was inserted and secured after confirming the positioning according to the manufacturer's recommendations.[23]
Patients were initially on volume control ventilation (VCV) at a tidal volume (VT) of 6 mL/kg predicted body weight (PBW), an inspiratory flow of 30 L/min, and a mandatory breathing frequency and an external positive end-expiratory pressure (PEEPe) matching those that were observed during pressure support ventilation before sedation. To suppress the spontaneous drive to breathe (abolish EAdi), patients received continuous intravenous sedation by propofol up to the dosage of 2 mg·kg–1·h–1. If at this propofol dosage the respiratory drive was not totally suppressed, remifentanil was also infused at a dosage of 6 to 15 μg·kg–1·h–1 just before the measurement of compliance, resistance, and PEEPi. Three seconds of inspiratory and expiratory holds were performed to measure the plateau pressure and total PEEP, respectively. CRS = VT/(plateau pressure − total PEEP). RRS = (peak pressure – plateau pressure)/flow. PEEPi was assessed during VCV at the PEEPe of zero during the end-expiratory airway occlusion method.
Sedation was discontinued, and as spontaneous breathing and EAdi recovered, patients were returned to PSP with an adjusted pressure support level to target a VT of 6 mL/kg. The initial pressure support level brings a VT of 6 mL/kg. PBW was denoted as 100%. Then, the pressure support level was increased to 150% of the initial pressure support level, which was denoted as 150%. During the entire recording period, PEEPe, FiO2, were maintained as set by the clinician in charge of the patient.
PSP: during per-fixed pneumatically controlled PS, the inspiratory trigger was set as the flow-trigger 1.4 L/min, and the rate of increase in pressure was set to 0.05 s in all patients. The cycling-off criterion was set to 30%.
PSN: ventilated with NAVA mode; however, the NAVA level was set to maximum (NAVA level 15 cmH2O/μV) with upper-pressure limits adjusted to achieve the targeted pressure support above PEEPe. PSN was neurally triggered (EAdi trigger = 0.5 μV) and cycled off (70% of peak EAdi).[20] During PSN, the upper pressure limits were adjusted to achieve the pressure support level of 100 and 150% support under PSP.
Patients were ventilated with 100% or 150% support under PSP and PSN modes applied in a randomized order. Each independent condition was maintained for 20 min. An envelope containing a computer-generated number in random order from 1 to 4 was prepared for each patient. Number 1 was PSP 100% support, number 2 was PSP 150% support, number 3 was PSN 100% support, and number 4 was PSN 150% support.
Data analysis
To quantify the patient-ventilator interaction, airway pressure, flow, and EAdi were acquired during a 20 min time window in each condition at 100 Hz from the ventilator via a RS 232 interface connected to a computer. Flow and airway pressure (Paw) were acquired from the ventilator, whereas Pes was obtained via pressure transducers; all signals were digitized at 100 Hz and stored for offline analysis (NeuroVent Research Inc., Toronto, ON, Canada). Data were stored for later offline analysis. All variables were calculated manually breath by breath from the last stable 3 min period of each condition using customized software (NeuroVent Research Inc., Toronto, ON, Canada) by two independent researchers, and mean values were used.
Six types of asynchrony were analyzed as previously described by Thille et al[6] and Lamouret et al[24] Macro asynchronies include ineffective triggering, which was defined by the existence of a diaphragmatic signal without a respiratory cycle; auto-triggering was defined by the existence of a ventilator cycle without a diaphragmatic signal; double triggering was defined by the presence of 2 successive inspiratory cycles without an intermediate expiration or with an interrupted expiration. Micro asynchronies were defined by a time difference exceeding 200 ms between the onset of the EAdi and the early initial rise in Paw-inspiratory trigger delay; between the 70% of peak EAdi (the end of diaphragmatic contractions) and the early decrease in airway pressure (the opening of the expiratory valve)-late cycling; and between the decrease in Paw and 70% of peak EAdi-premature cycling.
For each subtype of asynchrony, a percentage of asynchronies was calculated as follows: the number of asynchrony events divided by the total neural respiratory rate (which corresponds to the total EAdi signals) × 100%. Macro asynchrony index (AI), micro AI, and total AI were calculated as the number of macro asynchrony events, micro asynchrony, or total asynchrony events divided by the neural respiratory rate × 100%. The primary endpoint was the overall extent of the patient-ventilator asynchrony, which was evaluated by the total AI.
Trigger and cycling-off errors were classified as either too late (positive values) or too early (negative values). Trigger error was measured as the time difference between the onset of the EAdi and the early initial rise in Paw. The cycling-off error was calculated as the time difference between time points for an early decrease in airway pressure and 70% of peak EAdi.[20] Trigger and cycling-off errors were calculated as percentages of neural inspiratory and expiratory time periods, respectively. Events where EAdi and Paw were completely dissociated, such as wasted efforts, auto triggering, and double triggering, were assigned 100% error.
Neural inspiratory time (TiN) was calculated between the onset of EAdi and the return to 70% of peak EAdi.[25] Neural expiratory time was calculated as the time between the return to 70% of peak EAdi and the onset of the next EAdi. The Pes-time product (PTPes) was used to estimate the inspiratory effort, which was measured by the area under the Pes signal between the onset of EAdi and the end of inspiratory flow in 1 min. The pretrigger Pes-time product (PTPes-trig) was used to estimate the inspiratory effort for triggering, which was measured by the area under the Pes signal between the onset of EAdi and the start of the inspiratory flow in 1 min.
Statistics
All statistical analyses were carried out using SPSS 20 (IBM, Chicago, IL, USA). The values are stated as the mean ± standard deviation unless specified otherwise. Two types of comparisons were made: (1) at a given support level, the impact of PSPvs. PSN; and (2) within a mode, the impact of the support level. Parameters were compared between PSP and PSN in each group of patients. The normal distribution of continuous variables was assessed using skewness and kurtosis statistical tests. Variables were compared between modes and support levels using 2-way repeated-measures analysis of variance, and post hoc contrasts of significant effects were performed using the Student-Newman-Keuls test. Because of non-normality, pairwise tests of distribution percentages of asynchronies, AI, PTPes-trig, and PTPes were performed between modes at the same support level and between support levels during the same mode using the Mann-Whitney U test. Categorical data were compared by Chi-square tests, and P values of <0.05 were considered significant.
Results
Eight patients were enrolled in each group (post-operative, ARDS, and COPD). The patient characteristics and lung mechanisms are summarized in Table 1.
Table 1.
Patients’ characteristics in post-operative, ARDS, and COPD groups.
| Parameter | Post-operation (n = 8) | ARDS (n = 8) | COPD (n = 8) |
| Sex, male/female | 7/1 | 7/1 | 5/3 |
| Age (years) | 68 ± 23 | 65 ± 17 | 75 ± 9 |
| APACH II | 14.80 ± 6.50 | 18.70 ± 6.00 | 17.90 ± 4.00 |
| PBW (kg) | 65 ± 7 | 59 ± 9 | 63 ± 7 |
| PaO2 (mmHg) | 135 ± 42 | 95 ± 16 | 96 ± 30 |
| PaCO2 (mmHg) | 32 ± 4 | 36 ± 6 | 48 ± 14 |
| pH | 7.41 ± 0.06 | 7.43 ± 0.03 | 7.39 ± 0.05 |
| CRS (mL/cmH2O) | 52.5 ± 3.5 | 36.7 ± 8.1 | 49.6 ± 7.8 |
| RRS (cmH2O·L−1·S−1) | 9.4 ± 1.7 | 9.2 ± 2.1 | 17.9 ± 4.1 |
| PEEPi (cmH2O) | 0.7 ± 0.7 | 0.9 ± 0.2 | 3.6 ± 2.4 |
Data are provided as n or mean ± standard deviation. ARDS: Acute respiratory distress syndrome; COPD: Chronic obstructive pulmonary disease; APACH II: Acute Physiology and Chronic Health Evaluation II; PBW: Predictive body weight; PaO2: Partial pressure of oxygen in artery; PaCO2: Partial pressure of carbon dioxide in artery; CRS: Static compliance of the respiratory system; RRS: Resistance of respiratory system; PEEPi: Static intrinsic positive end expiratory pressure.
Total AI was consistently lower in PSN than in PSP in COPD, ARDS, and post-operative patients under support levels of 100% and 150% [Figure 1]. The percentages of all kinds of asynchronies and AI are reported in Table 2. In post-operative patients with ARDS, there was no difference in the macro AI between PSN and PSP. This indicated that the benefit of PSN in reducing total AI was mainly because of the reduction of the micro AI, not the macro AI, in post-operative patients with ARDS. However, PSN reduced both the macro AI and the micro AI when compared with PSP in patients with COPD. During PSP, improved support levels from 100% to 150% tended to increase the total AI, indicating worsened patient-ventilator synchrony, and it reached statistical significance in patients with COPD or ARDS [Figure 1]. However, total AI did not increase with the increase in support level during PSN.
Figure 1.
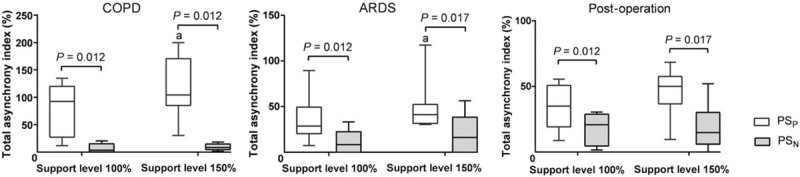
Total asynchrony index during PSP and PSN. Boxplot graphs showing the group values of the median (interquartile range) and 95% confidence interval for the total asynchrony index. Compared between support levels of 100% and 150% in the same mode, aP < 0.05. ARDS: Acute respiratory distress syndrome; COPD: Chronic obstructive pulmonary disease; PSN: controlled pressure support ventilation; PSP: Conventional pressure support ventilation.
Table 2.
Asynchronies recorded in different modes.
| P | ||||||||
| Patient type | Parameter | Support level (%) | PSP | PSN | P | Level | Mode | Interaction |
| COPD | Macro-asynchrony | |||||||
| Ineffective triggering | 100 | 0 (0–7.3) | 0 | 0.095 | 0.095 | 0.008 | 0.095 | |
| 150 | 7.9 (1.6–13.2) | 0 | 0.015 | |||||
| Auto-triggering | 100 | 0 (0–0.9) | 0 (0–3.2) | 0.240 | 0.408 | 0.249 | 0.413 | |
| 150 | 0 (0–0.7) | 0 (0–2.6) | 0.271 | |||||
| Double triggering | 100 | 0 (0–12.0) | 0 | 0.171 | 0.096 | 0.167 | 0.163 | |
| 150 | 0 (0–24.1) | 0 (0–2.0) | 0.165 | |||||
| Macro-asynchrony index | 100 | 7.3 (0–14.7) | 0 (0–3.2) | 0.036 | 0.050 | 0.027 | 0.077 | |
| 150 | 10.9 (5.5–26.8) | 0 (0–4.6) | 0.034 | |||||
| Micro-asynchronies | ||||||||
| Premature cycling-off | 100 | 0 | 0 (0–2.1) | 0.083 | 0.920 | 0.145 | 0.479 | |
| 150 | 0 | 0 (0–1.8) | 0.518 | |||||
| Late cycling-off | 100 | 32.8 (0.9–58.4) | 0 | 0.017 | 0.013 | 0.008 | 0.013 | |
| 150 | 61.5 (13.2–95.8)∗ | 0 | 0.006 | |||||
| Inspiratory trigger delay | 100 | 35.5 (19.9–70.3) | 1.6 (0–11.3) | 0.003 | 0.504 | 0.004 | 0.894 | |
| 150 | 52.3 (4.6–80.7) | 6.5 (4.4–11.4) | 0.014 | |||||
| Micro-asynchrony index | 100 | 90.4 (24.8–108.1) | 2.4 (0–13.0) | 0.003 | 0.011 | 0.001 | 0.023 | |
| 150 | 95.7 (75.0–146.2)∗ | 7.7 (4.6–11.8) | <0.001 | |||||
| ARDS | Macro-asynchrony | |||||||
| Ineffective triggering | 100 | 0 | 0 (0–1.8) | 0.227 | 0.458 | 0.458 | 0.186 | |
| 150 | 0 (0–1.6) | 0 | 0.181 | |||||
| Auto-triggering | 100 | 0 (0–11.0) | 0 (0–1.8) | 0.130 | 0.278 | 0.107 | 0.637 | |
| 150 | 0 (0–11.3) | 0 (0–1.9) | 0.098 | |||||
| Double triggering | 100 | 0 | 0 (0–9.4) | 0.140 | 0.121 | 0.140 | 0.121 | |
| 150 | 0 | 0 (0–9.8) | 0.139 | |||||
| Macro-asynchrony index | 100 | 0 (0–11.0) | 0 (0–11.1) | 0.838 | 0.634 | 0.807 | 0.561 | |
| 150 | 1.1 (0–11.3) | 0 (0–12.2) | 0.572 | |||||
| Micro-asynchronies | ||||||||
| Premature cycling-off | 100 | 0.9 (0–9.1) | 0 (0–1.8) | 0.107 | 0.021 | 0.038 | 0.050 | |
| 150 | 13.3 (0–26.8)∗ | 0 (0–4.2) | 0.038 | |||||
| Late cycling-off | 100 | 0.7 (0–5.4) | 0 | 0.104 | 0.595 | 0.064 | 0.595 | |
| 150 | 0.6 (0–5.8) | 0 | 0.204 | |||||
| Inspiratory trigger delay | 100 | 19.4 (0.4–35.5) | 0 (0–17.2) | 0.026 | 0.103 | 0.030 | 0.214 | |
| 150 | 23.3 (5.6–29.3) | 6.3 (0–33.3)∗ | 0.073 | |||||
| Micro-synchrony index | 100 | 24.8 (13.7–39.5) | 1.2 (0–17.8) | 0.004 | 0.009 | 0.002 | 0.506 | |
| 150 | 35.6 (30.5–44.6)∗ | 8.8 (0–34.6)∗ | 0.005 | |||||
| Post-operation | Macro-asynchrony | |||||||
| Ineffective triggering | 100 | 0 | 0 | 1.000 | 0.090 | 0.239 | 0.239 | |
| 150 | 0.9 (0–2.2)∗ | 0 | 0.239 | |||||
| Auto-triggering | 100 | 0 (0–7.2) | 0 | 0.082 | 0.082 | 0.082 | 0.082 | |
| 150 | 0 | 0 | 1.000 | |||||
| Double triggering | 100 | 0 | 0 (0–1.6) | 0.244 | 0.282 | 0.675 | 0.267 | |
| 150 | 0 (0–6.7) | 1.2 (0–3.9) | 0.665 | |||||
| Macro-asynchrony index | 100 | 0 (0–7.2) | 0 (0–1.6) | 0.437 | 0.433 | 0.352 | 0.787 | |
| 150 | 0.9 (0–8.6) | 1.2 (0–3.9) | 0.416 | |||||
| Micro-asynchronies | ||||||||
| Premature cycling-off | 100 | 0 (0–4.5) | 0 (0–3.2) | 0.089 | 0.010 | 0.640 | 0.416 | |
| 150 | 0.9 (0–12.9) | 4.5 (0.6–15.0)∗ | 0.525 | |||||
| Late cycling-off | 100 | 0.9 (0–16.4) | 0 | 0.113 | 0.070 | 0.059 | 0.061 | |
| 150 | 12.2 (0–24.1)∗ | 0 | 0.044 | |||||
| Inspiratory trigger delay | 100 | 15.8 (11.4–43.1) | 18.4 (2.1–27.3) | 0.270 | 0.526 | 0.032 | 0.279 | |
| 150 | 23.9 (17.5–35.8) | 5.7 (2.2–9.7)∗ | 0.016 | |||||
| Micro-synchrony index | 100 | 31.2 (17.3–48.7) | 20.5 (2.1–28.4) | 0.017 | 0.184 | 0.003 | 0.189 | |
| 150 | 50.0 (28.7–52.0) | 14.8 (6.0–30.2) | 0.003 | |||||
Data are provided as median (interquartile range). Compared between support level 100% and 150% at the same mode. ∗P < 0.05. PSP: Conventional pressure support ventilation; PSN: Neurally controlled pressure support; COPD: Chronic obstructive pulmonary disease; ARDS: Acute respiratory distress syndrome.
During PSP, all of the patients with COPD showed a late cycling off (positive values), and PSN significantly reduced the cycling-off error (P < 0.05) [Figure 2A]. Both early and late cycling-off occurred in post-operative patients with ARDS. In post-operative patients with ARDS, the values of cycling-off error were closer to zero during PSN than during PSP, indicating an improvement of the cycling-off error [Figure 2B and 2C]. PSN shortened the trigger error when compared with PSP in patients with COPD or ARDS under both support levels [Figure 2D and 2E]. However, the difference did not reach statistical significance in post-operative patients under a support level of 150% [Figure 2F].
Figure 2.
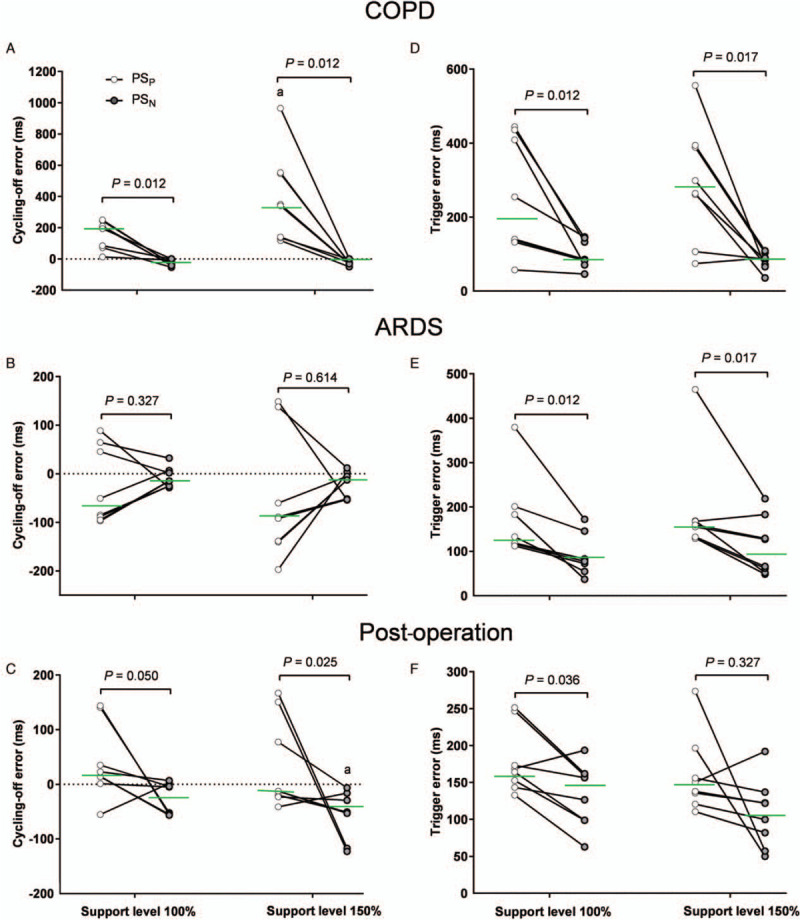
Cycling-off error and trigger error during PSP and PSN. (A) Cycling-off error in patients with COPD (n = 8), (B) cycling-off in patients with ARDS (n = 8), (C) cycling-off error in post-operative patients, (D) trigger error in patients with COPD (n = 8), (E) trigger error in patients with ARDS, (F) trigger error in post-operative patients. Positive values indicate late cycling off, and negative values indicate early cycling off. The green line shows the median value. Comparing support levels of 100% and 150% in the same mode, aP < 0.05. ARDS: Acute respiratory distress syndrome; COPD: Chronic obstructive pulmonary disease; PSN: controlled pressure support ventilation; PSP: Conventional pressure support ventilation.
Figure 3 shows a plot of the relative timing errors of triggering (X-axis) vs. the relative timing error for the cycling-off (Y-axis) for every breath in each group. We have inserted a small, centered box (green line) suggesting “perfect” synchrony to be ≤10% of neural timings. During PSP, there was a wide variability range for triggering error (Y-axis) and cycling off (X-axis) than during PSN in each group of patients. Except in post-operative patients under a support level of 150%, during PSN, there were significantly more “perfect” synchrony breaths than during PSP [Table 3].
Figure 3.
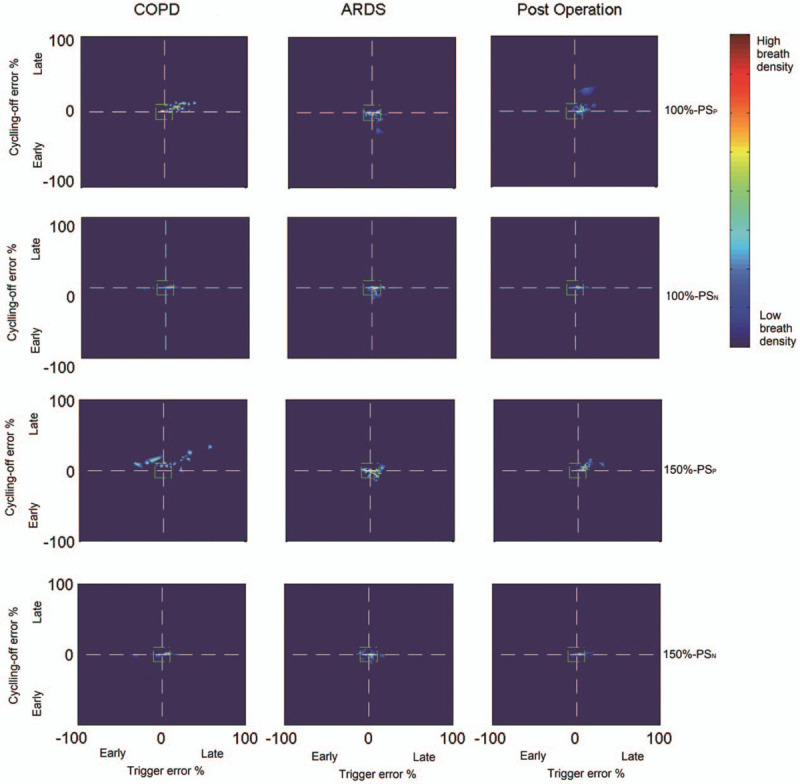
Breath density graph for relative trigger (X-axis) and cycling-off (Y-axis) errors for all breaths in all patients with COPD or ARDS and post-operative patients during PSP and PSN. The small centered box (green line) suggests “perfect” synchrony, which refers to relative timing errors of triggering and for cycling-off ≤10% of neural timings. ARDS: Acute respiratory distress syndrome; COPD: Chronic obstructive pulmonary disease; PSN: controlled pressure support ventilation; PSP: Conventional pressure support ventilation.
Table 3.
“Perfect” synchrony breath in different modes.
| Patient type | Support level | PSP | PSN | P |
| COPD | 100 | 41.4 (36.8–47.0) | 74.5 (69.8–79.1) | <0.001 |
| 150 | 30.8 (25.7–35.7)∗ | 73.7 (69.4–78.3) | <0.001 | |
| ARDS | 100 | 61.5 (56.4–66.6) | 82.0 (78.1–86.1) | <0.001 |
| 150 | 57.2 (52.0–62.6) | 72.1 (67.3–76.8)∗ | <0.001 | |
| Post-operation | 100 | 70.8 (65.3–76.2) | 78.9 (74.1–83.6) | 0.017 |
| 150 | 60.3 (54.7–66.2)∗ | 64.0 (58.5–69.7)∗ | 0.196 |
Data are shown as median (interquartile range). Compared between support level 100% and 150% at the same mode. ∗P < 0.05. “Perfect” synchrony: Relative timing errors of triggering and for cycling-off ≤10% of neural timings; PSP: Conventional pressure support ventilation; PSN: Neurally controlled pressure support; COPD: Chronic obstructive pulmonary disease; ARDS: Acute respiratory distress syndrome.
During PSN, the patient's inspiratory effort for triggering determined by PTPes-trig was significantly lower than that during PSP in patients with COPD or ARDS but not in post-operative patients [Figure 4]. During PSN, the patient's total inspiratory effort determined by PTPes was significantly lower than that during PSP in patients with COPD or ARDS under both support levels and in post-operative patients under a support level of 100% [Figure 4]. As shown in Table 4, in patients with COPD or ARDS and post-operative patients, increased support levels from 100% to 150% led to a significant increase in Ppeak and Vt and a decrease in Peak EAdi. In patients with COPD, increased support levels decreased RR during PSP but not during PSN. There was no difference in the breathing pattern between PSN and PSP.
Figure 4.
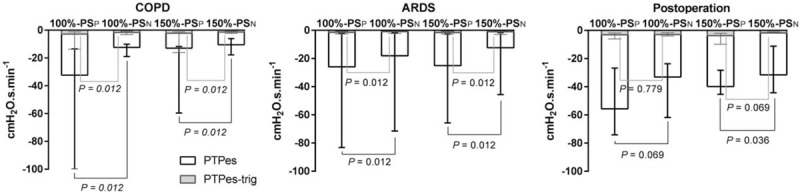
Inspiratory efforts for triggering and total inspiration during PSP and PSN under support levels of 100% and 150%. Median and interquartile ranges are presented. ARDS: Acute respiratory distress syndrome; COPD: Chronic obstructive pulmonary disease; PSN: controlled pressure support ventilation; PSP: Conventional pressure support ventilation; PTPes: Inspiratory Pes-time product (white bars); PTPes-trig: Pretrigger Pes-time product (gray bars).
Table 4.
Clinical parameters of breathing pattern in different patients’ types.
| P | ||||||||
| Patient type | Parameter | Support level | PSP | PSN | P | Level | Mode | Interaction |
| COPD | Ppeak (cmH2O) | 100 | 19.6 ± 3.4 | 18.9 ± 4.2 | 0.221 | <0.001 | 0.308 | 0.518 |
| 150 | 24.5 ± 5.5∗ | 24.2 ± 5.2∗ | 0.293 | |||||
| PEEP (cmH2O) | 100 | 5.9 ± 2.3 | 6.4 ± 2.6 | 0.498 | 0.199 | 0.607 | 0.344 | |
| 150 | 6.4 ± 2.3 | 6.4 ± 2.5 | 0.924 | |||||
| Vt (cmH2O/kg) | 100 | 6.0 ± 0.2 | 6.0 ± 0.1 | 0.730 | <0.001 | 0.225 | 0.330 | |
| 150 | 7.6 ± 0.1∗ | 7.5 ± 0.1∗ | 0.042 | |||||
| RRN (breath/min) | 100 | 21.1 ± 10.6 | 19.7 ± 8.6 | 0.170 | 0.020 | 0.659 | 0.054 | |
| 150 | 17.6 ± 10.5∗ | 19.9 ± 9.6 | 0.192 | |||||
| TiN (s) | 100 | 1.0 ± 0.2 | 1.0 ± 0.1 | 0.281 | 0.046 | 0.113 | 0.809 | |
| 150 | 1.0 ± 0.2 | 1.0 ± 0.1 | 0.262 | |||||
| TeN (s) | 100 | 2.8 ± 1.5 | 2.7 ± 1.5 | 0.800 | 0.009 | 0.055 | 0.007 | |
| 150 | 3.8 ± 2.2∗ | 2.9 ± 1.6 | 0.017 | |||||
| TiN/TtN (%) | 100 | 32.3 ± 8.4 | 30.8 ± 9.4 | 0.807 | 0.002 | 0.458 | 0.023 | |
| 150 | 26.6 ± 10.1∗ | 29.8 ± 10.2 | 0.106 | |||||
| Peak EAdi (Μv) | 100 | 5.8 ± 2.3 | 6.4 ± 2.6 | 0.786 | 0.006 | 0.291 | 0.150 | |
| 150 | 6.4 ± 2.3∗ | 6.4 ± 2.5 | 0.078 | |||||
| ARDS | Ppeak (cmH2O) | 100 | 14.7 ± 3.1 | 15.3 ± 3.4 | 0.353 | <0.001 | 0.180 | 0.629 |
| 150 | 18.4 ± 4.1∗ | 19.3 ± 3.9∗ | 0.198 | |||||
| PEEP (cmH2O) | 100 | 6.8 ± 1.4 | 6.9 ± 1.3 | 0.018 | 0.579 | 0.113 | 0.526 | |
| 150 | 6.9 ± 1.2 | 6.9 ± 1.2 | 0.548 | |||||
| Vt (cmH2O/kg) | 100 | 6.2 ± 0.3 | 6.1 ± 0.3 | 0.811 | <0.001 | 0.811 | 0.223 | |
| 150 | 7.5 ± 0.3∗ | 7.4 ± 0.3∗ | 0.811 | |||||
| RRN (breath/min) | 100 | 20.2 ± 6.7 | 22.1 ± 3.1 | 0.307 | 0.994 | 0.479 | 0.200 | |
| 150 | 20.8 ± 6.8 | 21.5 ± 2.1 | 0.716 | |||||
| TiN (s) | 100 | 1.1 ± 0.2 | 1.1 ± 0.2 | 0.578 | 0.507 | 0.746 | 0.467 | |
| 150 | 1.1 ± 0.2 | 1.1 ± 0.1 | 0.994 | |||||
| TeN (s) | 100 | 2.4 ± 1.4 | 1.8 ± 0.3 | 0.201 | 0.214 | 0.233 | 0.115 | |
| 150 | 2.4 ± 1.4 | 1.9 ± 0.3 | 0.277 | |||||
| TiN/TtN (%) | 100 | 35.0 ± 8.5 | 35.7 ± 8.5 | 0.129 | 0.425 | 0.210 | 0.040 | |
| 150 | 35.7 ± 8.5 | 38.0 ± 2.6 | 0.389 | |||||
| Peak EAdi (μV) | 100 | 15.2 ± 8.0 | 17.5 ± 10.9 | 0.166 | 0.153 | 0.342 | 0.091 | |
| 150 | 15.1 ± 11.9 | 14.2 ± 11.4∗ | 0.063 | |||||
| Post-operation | Ppeak (cmH2O) | 100 | 11.8 ± 1.4 | 12.6 ± 1.3 | 0.003 | 0.013 | 0.457 | 0.127 |
| 150 | 15.7 ± 3.7∗ | 13.7 ± 2.6∗ | 0.847 | |||||
| PEEP (cmH2O) | 100 | 5.7 ± 0.4 | 6.0 ± 0.6 | 0.248 | 0.052 | 0.355 | 0.028 | |
| 150 | 5.7 ± 0.5 | 5.8 ± 0.6 | 0.059 | |||||
| Vt (cmH2O/kg) | 100 | 6.0 ± 0.2 | 6.0 ± 0.1 | 0.153 | <0.001 | 0.391 | 0.084 | |
| 150 | 7.3 ± 0.2∗ | 7.3 ± 0.1∗ | 0.862 | |||||
| RRN (breath/min) | 100 | 16.5 ± 4.9 | 16.8 ± 4.1 | 0.472 | 0.274 | 0.677 | 0.350 | |
| 150 | 17.1 ± 2.7 | 15.2 ± 3.8 | 0.357 | |||||
| TiN (s) | 100 | 1.2 ± 0.1 | 1.4 ± 0.3 | 0.814 | 0.030 | 0.319 | 0.514 | |
| 150 | 1.2 ± 0.1 | 1.3 ± 0.3∗ | 0.164 | |||||
| TeN (s) | 100 | 2.9 ± 1.6 | 2.7 ± 1.0 | 0.398 | 0.593 | 0.715 | 0.355 | |
| 150 | 2.6 ± 0.7 | 3.0 ± 1.2 | 0.012 | |||||
| TiN/TtN (%) | 100 | 32.8 ± 8.0 | 35.8 ± 5.5 | 0.272 | 0.017 | 0.667 | 0.223 | |
| 150 | 32.9 ± 4.8 | 31.4 ± 8.0∗ | 0.020 | |||||
| Peak EAdi (μV) | 100 | 9.3 ± 6.1 | 8.2 ± 5.6 | 0.350 | <0.001 | 0.341 | 0.533 | |
| 150 | 6.7 ± 5.9∗ | 6.4 ± 6.1∗ | 0.678 | |||||
Data are provided as mean ± standard deviation. Compared between support level 100% and 150% at the same mode. ∗P < 0.05. PSP: Conventional pressure support ventilation; PSN: Neurally controlled pressure support; COPD: Chronic obstructive pulmonary disease; ARDS: Acute respiratory distress syndrome; PEEP: Positive end expiratory pressure; Vt: Tidal volume; RR: Respiratory rate; TiN: Neural inspiratory time; TeN: Neural expiratory time; Peak EAdi: Peak diaphragm electrical activity; Ppeak: Peak airway pressure.
Discussion
In this crossover trial including intubated patients with different respiratory system mechanical properties, we found that PSN improves patient-ventilator synchrony and generates a respiratory pattern similar to PSP in patients with mixed restrictive and obstructive ARF (patients with COPD), with obvious restrictive ARF (ARDS) and without obvious ARF (post-operative overnight patients). Meanwhile, PSN reduced trigger and total patient inspiratory effort in patients with COPD or ARDS. The results also demonstrated that PSN results in smaller patient-ventilator interactions when the level of ventilatory assistance is increased.
Trigger delays
In the present study, the median delay for triggering during PSP ranged from 126 to 281 ms in all patients under normal and high support levels. These values fall within the 80 to 540 ms range of values previously reported for PSP.[1,26–28] The wide variability can be ascribed to different etiologies of respiratory failure, the different ventilators used, varying levels of assistance provided, and different trigger modes and levels of choice. We chose a flow trigger of 1.4 L/min, which was a reasonable value in this clinical scenario.[27] This choice was motivated by previous reports suggesting that flow triggering will prove superior to pressure triggering, improving comfort, and reducing the work of breathing.[29,30] Another important factor that affects the trigger delay is PEEPi during PSP, which often occurs in patients with COPD. Chiumello et al[19] showed a trigger delay of 290 to 530 ms during PSP in patients with COPD with a mean inspiratory resistance of 21 cmH2O·L–1·s–1. Xu et al[31] also showed trigger delays of 247 and 342 ms in patients with COPD with PEEPi >3 cmH2O under normal and high pressure support levels. Our results are consistent with previous studies that showed a median of 197 and 281 ms of trigger delay in patients with COPD with a mean PEEPi of 3.6 cmH2O. The PEEPi was not obvious in ARDS and post-operative patients; accordingly, the trigger delay in these patients was approximately 120 to 150 ms. Set and neurology triggers should not be influenced by PEEPi. This is one of the potential explanations for the reduced trigger delay during PSN.
In patients with CPOD or ARDS and post-operative patients, PSN resulted in a 60%, 40%, and 15% reduction in trigger delay compared with PSP under the normal support level. The median delay for triggering ranged from 81 to 144 ms during PSN in all patients under normal and high support levels. A previous physiological study confirmed that during end-expiration occlusion, the inspiratory pressure waves generated were distorted by conscious or unconscious responses to occlusion, which had a minimum latency of 150 ms.[32] A trigger delay of <150 ms during PSN did not seem to have an obvious impact on respiratory drive and patient comfort. In agreement with previous studies, increasing the support level did not affect trigger delays during PSN and PSP in all patients.[1,13]
Cycling-off error
During PSP, ventilator cycling-off is achieved by terminating the assistance at a point when the inspiratory flow has declined to some value relative to its peak level. Cycling-off synchrony is dependent on factors such as the TiN, assist levels, patient inspiratory effort, as well as the time constant of the respiratory system and cycling-off criteria.[3] Consequently, the optimum flow cycling-off criteria vary from person to person and can range from very low levels (5%) in patients with ARDS[4,33] to >50% in patients with COPD.[5,34,35] We chose the default cycling-off value (30%) of the Servo-I ventilator and found that in all patients with COPD, the mechanical breath terminated after the end of the neural breath. This was not unexpected because of the long time constant of the respiratory system in patients with COPD. In the ARDS group and post-operative group, early cycling-off was found in some of the patients; however, delayed cycling-off was found in the others. Different respiratory system mechanical properties and inspiratory effort might be the possible reasons for the inconsistent cycling-off error in patients with ARDS and post-operative patients.
Due to the different inspiratory efforts, assistance levels, and time constants of the respiratory system in individual patients, it is still a great challenge to select the optimal cycling-off criteria. We found that the value of cycling-off error in each patient during PSN was closer to zero than that during PSP in all patients with COPD or ARDS and in most post-operative patients. A previous study also showed a beneficial effect of PSN on reducing the cycling-off delay in 11 inhomogeneous patients with respiratory failure.[27] These results strengthened the hypothesis that PSN might be an alternative mode to PSP to provide a personal and adapted cycling-off to avoid cycling-off error and dynamic hyperinflation, especially in patients with COPD.
Asynchrony index
The present study showed a higher total AI (range from 28% to 104%) during PSP when compared with those in previous studies (range from 0% to 27%).[6,16,25,27] In addition to differences in patients enrolled and the ventilators used, we think the major reason for the apparent differences between the studies relates to the calculation method of AI. First, inspiratory trigger delay was included in the calculation of AI in the present study, which provided approximately one-third to one-half of the total AI during PSP. However, the previous studies did not include inspiratory trigger delay in AI. Second, we defined asynchrony as an error of 200 ms between the origin of the EAdi and ventilator insufflation, which represents the conscious perception threshold that could be a source of discomfort[24] and is more sensitive than the threshold used in previous studies.[6,16,25,27]
PSN constantly reduced the total AI in all patients under normal and high support levels. During PSN, ineffective triggering was significantly lower than that during PSP.[36] Unlike previous studies in which double triggering was more frequent in the NAVA group, the present study showed identical double triggering between PSP and PSN in all patients.[25] During PSN, there were fewer premature cycles in patients with ARDS and fewer late cycles in patients with COPD. This makes sense because, during PSN, expiratory triggers are systematically neural. Macro asynchrony was rare, and the benefit of PSN in reducing total AI was mainly because of the reduction of the micro AI but not the macro AI in patients with COPD and ARDS and post-operative patients, respectively.
Inspiratory effort and breathing pattern
Our results indicate that, due to more efficient triggering, less inspiratory effort was required for ventilator triggering with PSN than with PSP in patients with COPD or ARDS. Consistent with our previous study,[20] inspiratory effort measured by PTPes was consistently and markedly reduced during PSN compared to PSP in patients with COPD. Unlike a previous study in which the work of breathing and PTP were not altered in PSN in 11 heterogeneous patients,[27] the present study also found reduced PTPes during PSN in ARDS and post-operative patients. The reason for the apparent differences between the studies relates to the differences in enrolled patients, pressure support level and the number of major asynchronies observed. Although PSN improved the cycling-off criteria, which has been demonstrated to affect the inspiratory time only under high-pressure support,[33] our results are in line with those previously reported showing a comparable breathing pattern between PSp and PSN in all patients.
The strengths of the present study were as follows. Patients’ respiratory system mechanical properties are one of the important factors that affect patient-ventilation interaction during PSP. The enrolled patients with restrictive ARF (ARDS), mixed restrictive and obstructive ARF (COPD), and patients without obvious ARF (post-operative overnight patients) led to deeper insight into the mechanism of how the prefixed pneumatic controllers work during PSP and provided evidence for the benefits of PSN to improve patient-ventilator interactions in patients with different pathophysiologies of respiratory failure.
Some limitations should be noted. First, the respiratory mechanics were evaluated in patients under sedation and without active breathing; thus, the results will be different during pressure support ventilation. However, it is possible to measure Pplat and CRS during pressure support ventilation using the inspiratory occlusion method.[37] Given the good correlation between CRS measured during pressure support ventilation and VCV and the need for evaluating airway resistance, constant flow VCV without active breathing was used in the present study. Second, as no consensus method for AI calculation is available, the threshold of time error to detect micro asynchronies, which was defined as 200 ms according to a previous study, was more or less arbitrarily chosen in the present study and led to a higher total AI when compared with previous studies. Third, although a sample size of eight patients in each group is reasonable for a physiological study, the small number of patients might still be a potential source of bias in the present study. Fourth, the patients were observed for only a short period of time, and it cannot be excluded that different results could have been obtained if a prolonged period of time had been studied. However, the short time-period allowed patients to remain stable enough to compare the different modes.
We found that in patients with COPD and ARDS and post-operative patients, PSN, which provides a personal and adapted trigger and cycling-off, improves patient-ventilator synchrony and generates a respiratory pattern similar to PSP independently of any level of support. PSN, which reduces the trigger and total patient inspiratory effort in patients with COPD or ARDS, might be an alternative mode for PSP to unload respiratory failure patients effectively.
Acknowledgements
The authors thank M. Jing-Lei Liu, Xiao-Yong Zhou, and Jun Chen (Shenzhen Mindray Bio-Medical Electronics Co., Ltd.) for analyzing part of the data.
Funding
This study was supported by grants from the National Science and Technology Major Project (No. 2020ZX09201015), Clinical Science and Technology Specific Projects of Jiangsu Province (Nos. BE2018743, BE2019749), National Natural Science Foundation of China (Nos. 81870066, 81670074, 81930058), Natural Science Foundation of Jiangsu Province (No. BK20171271), Jiangsu Provincial Medical Youth Talent (No. QNRC 2016807), and Third Level Talents of the “333 High Level Talents Training Project” in the fifth phase in Jiangsu (No. LGY2016051).
Conflicts of interest
Ling Liu and Hai-Bo Qiu received a grant from Mindray (China). The other authors declare no competing interests.
Footnotes
How to cite this article: Liu L, Xu XT, Yu Y, Sun Q, Yang Y, Qiu HB. Neural control of pressure support ventilation improved patient-ventilator synchrony in patients with different respiratory system mechanical properties: a prospective, crossover trial. Chin Med J 2021;134:281–291. doi: 10.1097/CM9.0000000000001357
References
- 1.Spahija J, de Marchie M, Albert M, Bellemare P, Delisle S, Beck J, et al. Patient-ventilator interaction during pressure support ventilation and neurally adjusted ventilatory assist. Crit Care Med 2010; 38:518–526. doi: 10.1097/CCM.0b013e3181cb0d7b. [DOI] [PubMed] [Google Scholar]
- 2.MacIntyre NR. Clinically available new strategies for mechanical ventilatory support. Author information. Chest 1993; 104:560–565. doi: 10.1378/chest.104.2.560. [DOI] [PubMed] [Google Scholar]
- 3.Yamada Y, Du HL. Analysis of the mechanisms of expiratory asynchrony in pressure support ventilation: a mathematical approach. J Appl Physiol (1985) 2000; 88:2143–2150. doi: 10.1152/jappl.2000.88.6.2143. [DOI] [PubMed] [Google Scholar]
- 4.Tokioka H, Tanaka T, Ishizu T, Fukushima T, Iwaki T, Nakamura Y, et al. The effect of breath termination criterion on breathing patterns and the work of breathing during pressure support ventilation. Anesth Analg 2001; 92:161–165. doi: 10.1097/00000539-200101000-00031. [DOI] [PubMed] [Google Scholar]
- 5.Tassaux D, Gainnier M, Battisti A, Jolliet P. Impact of expiratory trigger setting on delayed cycling and inspiratory muscle workload. Am J Respir Crit Care Med 2005; 172:1283–1289. doi: 10.1164/rccm.200407-880OC. [DOI] [PubMed] [Google Scholar]
- 6.Thille AW, Rodriguez P, Cabello B, Lellouche F, Brochard L. Patient-ventilator asynchrony during assisted mechanical ventilation. Intensive Care Med 2006; 32:1515–1522. doi: 10.1007/s00134-006-0301-8. [DOI] [PubMed] [Google Scholar]
- 7.Terzi N, Piquilloud L, Rozé H, Mercat A, Lofaso F, Delisle S, et al. Clinical review: update on neurally adjusted ventilatory assist–report of a roundtable conference. Crit Care 2012; 16:225.doi: 10.1186/cc11297. [DOI] [PMC free article] [PubMed] [Google Scholar]
- 8.Sinderby C, Navalesi P, Beck J, Skrobik Y, Comtois N, Friberg S, et al. Neural control of mechanical ventilation in respiratory failure. Nat Med 1999; 5:1433–1436. doi: 10.1038/71012. [DOI] [PubMed] [Google Scholar]
- 9.Kacmarek R. Proportional assist ventilation and neurally adjusted ventilatory assist. Respir Care 2011; 56:140–148. doi: 10.4187/respcare.01021. [DOI] [PubMed] [Google Scholar]
- 10.Sinderby C, Beck J. Proportional assist ventilation and neurally adjusted ventilatory assist–better approaches to patient ventilator synchrony? Clin Chest Med 2008; 29:329–342. doi: 10.1016/j.ccm.2008.01.007. [DOI] [PubMed] [Google Scholar]
- 11.Piquilloud L, Vignaux L, Bialais E, Roeseler J, Sottiaux T, Laterre P-F, et al. Neurally adjusted ventilatory assist improves patient-ventilator interaction. Intensive Care Med 2011; 37:263–271. doi: 10.1007/s00134-010-2052-9. [DOI] [PubMed] [Google Scholar]
- 12.Terzi N, Pelieu I, Guittet L, Ramakers M, Seguin A, Daubin C, et al. Neurally adjusted ventilatory assist in patients recovering spontaneous breathing after acute respiratory distress syndrome: physiological evaluation. Crit Care Med 2010; 38:1830–1837. doi: 10.1097/CCM.0b013e3181eb3c51. [DOI] [PubMed] [Google Scholar]
- 13.Colombo D, Cammarota G, Bergamaschi V, De Lucia M, Corte FD, Navalesi P. Physiologic response to varying levels of pressure support and neurally adjusted ventilatory assist in patients with acute respiratory failure. Intensive Care Med 2008; 34:2010–2018. doi: 10.1007/s00134-008-1208-3. [DOI] [PubMed] [Google Scholar]
- 14.Brander L, Leong-Poi H, Beck J, Brunet F, Hutchison SJ, Slutsky AS, et al. Titration and implementation of neurally adjusted ventilatory assist in critically ill patients. Chest 2009; 135:695–703. doi: 10.1378/chest.08-1747. [DOI] [PubMed] [Google Scholar]
- 15.Patroniti N, Bellani G, Saccavino E, Zanella A, Grasselli G, Isgrò S, et al. Respiratory pattern during neurally adjusted ventilatory assist in acute respiratory failure patients. Intensive Care Med 2012; 38:230–239. doi: 10.1007/s00134-011-2433-8. [DOI] [PubMed] [Google Scholar]
- 16.Yonis H, Crognier L, Conil J-M, Serres I, Rouget A, Virtos M, et al. Patient ventilator synchrony in neurally adjusted ventilatory assist (NAVA) and pressure support ventilation (PSV): a prospective observational study. BMC Anesthesiol 2015; 15:117.doi: 10.1186/s12871-015-0091-z. [DOI] [PMC free article] [PubMed] [Google Scholar]
- 17.Bellani G, Coppadoro A, Patroniti N, Turella M, Arrigoni Marocco S, Grasselli G, et al. Clinical assessment of autopositive end-expiratory pressure by diaphragmatic electrical activity during pressure support and neurally adjusted ventilatory assist. Anesthesiology 2014; 121:563–571. doi: 10.1097/ALN.0000000000000371. [DOI] [PubMed] [Google Scholar]
- 18.Cammarota G, Longhini F, Perucca R, Ronco C, Colombo D, Messina A, et al. New setting of neurally adjusted ventilatory assist during noninvasive ventilation through a helmet. Anesthesiology 2016; 125:1181–1189. doi: 10.1097/ALN.0000000000001354. [DOI] [PubMed] [Google Scholar]
- 19.Chiumello D, Pelosi P, Croci M, Bigatello LM, Gattinoni L. The effects of pressurization rate on breathing pattern, work of breathing, gas exchange and patient comfort in pressure support ventilation. Eur Respir J 2001; 18:107–114. doi: 10.1183/09031936.01.00083901. [DOI] [PubMed] [Google Scholar]
- 20.Liu L, Xia F, Yang Y, Longhini F, Navalesi P, Beck J, et al. Neural versus pneumatic control of pressure support in patients with chronic obstructive pulmonary diseases at different levels of positive end expiratory pressure: a physiological study. Crit Care 2015; 19:244.doi: 10.1186/s13054-015-0971-0. [DOI] [PMC free article] [PubMed] [Google Scholar]
- 21.Longhini F, Pan C, Xie J, Cammarota G, Bruni A, Garofalo E, et al. New setting of neurally adjusted ventilatory assist for noninvasive ventilation by facial mask: a physiologic study. Crit Care 2017; 21:170.doi: 10.1186/s13054-017-1761-7. [DOI] [PMC free article] [PubMed] [Google Scholar]
- 22.Ranieri VM, Rubenfeld GD, Thompson BT, Ferguson ND, Caldwell E, et al. ARDS Definition Task Force Acute respiratory distress syndrome: the Berlin Definition. JAMA 2012; 307:2526–2533. doi: 10.1001/jama.2012.5669. [DOI] [PubMed] [Google Scholar]
- 23.Beck J, Campoccia F, Allo JC, Brander L, Brunet F, Slutsky AS, et al. Improved synchrony and respiratory unloading by neurally adjusted ventilatory assist (NAVA) in lung-injured rabbits. Pediatr Res 2007; 61:289–294. doi: 10.1203/01.pdr.0000257324.22406.93. [DOI] [PubMed] [Google Scholar]
- 24.Lamouret O, Crognier L, Vardon Bounes F, Conil JM, Dilasser C, Raimondi T, et al. Neurally adjusted ventilatory assist (NAVA) versus pressure support ventilation: patient-ventilator interaction during invasive ventilation delivered by tracheostomy. Crit Care 2019; 23:2.doi: 10.1186/s13054-018-2288-2. [DOI] [PMC free article] [PubMed] [Google Scholar]
- 25.Demoule A, Clavel M, Rolland-Debord C, Perbet S, Terzi N, Kouatchet A, et al. Neurally adjusted ventilatory assist as an alternative to pressure support ventilation in adults: a French multicentre randomized trial. Intensive Care Med 2016; 42:1723–1732. doi: 10.1007/s00134-016-4447-8. [DOI] [PubMed] [Google Scholar]
- 26.Meric H, Calabrese P, Pradon D, Lejaille M, Lofaso F, Terzi N. Physiological comparison of breathing patterns with neurally adjusted ventilatory assist (NAVA) and pressure-support ventilation to improve NAVA settings. Respir Physiol Neurobiol 2014; 195:11–18. doi: 10.1016/j.resp.2014.01.021. [DOI] [PubMed] [Google Scholar]
- 27.Beloncle F, Piquilloud L, Rittayamai N, Sinderby C, Rozé H, Brochard L. A diaphragmatic electrical activity-based optimization strategy during pressure support ventilation improves synchronization but does not impact work of breathing. Crit Care 2017; 21:21.doi: 10.1186/s13054-017-1599-z. [DOI] [PMC free article] [PubMed] [Google Scholar]
- 28.Tobin MJ, Jubran A, Laghi F. Patient-ventilator interaction. Am J Respir Crit Care Med 2001; 163:1059–1063. doi: 10.1164/ajrccm.163.5.2005125. [DOI] [PubMed] [Google Scholar]
- 29.Uchiyama A, Imanaka H, Taenaka N, Nakano S, Fujino Y, Yoshiya I. A comparative evaluation of pressure-triggering and flow-triggering in pressure support ventilation (PSV) for neonates using an animal model. Anaesth Intensive Care 1995; 23:302–306. doi: 10.1177/0310057X9502300306. [DOI] [PubMed] [Google Scholar]
- 30.Barrera R, Melendez J, Ahdoot M, Huang Y, Leung D, Groeger JS. Flow triggering added to pressure support ventilation improves comfort and reduces work of breathing in mechanically ventilated patients. J Crit Care 1999; 14:172–176. doi: 10.1016/s0883-9441(99)90031-x. [DOI] [PubMed] [Google Scholar]
- 31.Xu XT, Sun Q, Xie JF, Pan C, Yang Y, Qiu HB, et al. Effect of neurally adjusted ventilatory assist on trigger of mechanical ventilation in acute exacerbation of chronic obstructive pulmonary disease patients with intrinsic positive end-expiratory pressure. Zhonghua Nei Ke Za Zhi 2019; 58:43–48. doi: 10.3760/cma.j.issn.0578-1426.2019.01.008. [DOI] [PubMed] [Google Scholar]
- 32.Whitelaw WA, Derenne JP, Milic-Emili J. Occlusion pressure as a measure of respiratory center output in conscious man. Respir Physiol 1975; 23:181–199. doi: 10.1016/0034-5687(75)90059-6. [DOI] [PubMed] [Google Scholar]
- 33.Chiumello D, Pelosi P, Taccone P, Slutsky A, Gattinoni L. Effect of different inspiratory rise time and cycling off criteria during pressure support ventilation in patients recovering from acute lung injury. Crit Care Med 2003; 31:2604–2610. doi: 10.1097/01.CCM.0000089939.11032.36. [DOI] [PubMed] [Google Scholar]
- 34.Tassaux D, Michotte JB, Gainnier M, Gratadour P, Fonseca S, Jolliet P. Expiratory trigger setting in pressure support ventilation: from mathematical model to bedside. Crit Care Med 2004; 32:1844–1850. doi: 10.1097/01.ccm.0000138561.11634.6f. [DOI] [PubMed] [Google Scholar]
- 35.Chiumello D, Polli F, Tallarini F, Chierichetti M, Motta G, Azzari S, et al. Effect of different cycling-off criteria and positive end-expiratory pressure during pressure support ventilation in patients with chronic obstructive pulmonary disease. Crit Care Med 2007; 35:2547–2552. doi: 10.1097/01.CCM.0000287594.80110.34. [DOI] [PubMed] [Google Scholar]
- 36.Doorduin J, Sinderby CA, Beck J, van der Hoeven JG, Heunks LM. Automated patient-ventilator interaction analysis during neurally adjusted non-invasive ventilation and pressure support ventilation in chronic obstructive pulmonary disease. Crit Care 2014; 18:550.doi: 10.1186/s13054-014-0550-9. [DOI] [PMC free article] [PubMed] [Google Scholar]
- 37.Bellani G, Grassi A, Sosio S, Foti G. Plateau and driving pressure in the presence of spontaneous breathing. Intensive Care Med 2019; 45:97–98. doi: 10.1007/s00134-018-5311-9. [DOI] [PubMed] [Google Scholar]