

Abstract
Food access literature links disinvested communities with poor food access. Similarly, links are made between discriminatory housing practices and contemporary investment. Less work has examined the relationship between housing practices and food environment disparities. Our central premise is that these practices create distinctions in food environment quality, and that these disparities may have implications for food system advocacy and policymaking. In this paper, we link an objective food environment assessment with a spatial database highlighting redlining, blockbusting, and gentrification in Baltimore, Maryland, USA. Standard socioeconomic and housing characteristics are used to control for race, income, and housing composition in a multivariate regression analysis. Our findings highlight that blockbusting—rather than redlining—most strongly shapes poor food access. Redlining and gentrification, meanwhile, are associated with better food access. These findings raise important points about future policy discussions, which should instead be focused on ameliorating more contemporary patterns of housing inequality.
Keywords: food access, food environments, GIS, gentrification, blockbusting, redlining
1. Background
The subjects of food access and housing are intertwined in many ways. Both connect to health equity (Dixon et al., 2007; Northridge and Freeman, 2011), as their type and quality vary widely over space. Zoning can ameliorate these disparities (Ransom et al., 2011; Hartnett, 1993), but in practice more often exacerbates them (Manville et al., 2020; Massey and Rugh, 2017; Rossen and Pollack, 2012). Communities that have faced deliberate under- and disinvestment in housing likewise tend to have a poorly developed food retailing system (Deener, 2017). Fewer homes with lower property values means fewer paying customers, keeping food retailers out of these neighborhoods (Cleary et al., 2018). Furthermore, the model of food retailing that has proliferated over the past several decades necessitates large tracts of cheap land with middle-income consumers nearby (Ellickson, 2016; Sadler et al., 2011; Dunkley et al., 2004; Lavin, 2000; Jones and Simmons, 1990)—all of which are harder to come by in cities than suburbs.
Yet despite the many direct connections between community-level disinvestment and the loss or lack of amenities such as healthy foods, no work has examined the relationship between multiple historical forms of housing discrimination and objectively measured contemporary food access. In this study, we combine characteristics of the housing environment throughout the 20th century to today with an objective measure of the food environment. In so doing, ours is the first study to explicitly link these two phenomena. Below we outline the various forms of housing discrimination that may impact upon the provision of amenities, as well as their links to food access. We then introduce our study area and the basis for our food environment measure before moving to the methods section.
1.1. Housing Discrimination
Racial and ethnic minorities, along with lower socioeconomic groups, have been relegated to sub-standard housing via various tactics for as long as city plans have existed (Cohn, 2009; Zunz, 1977; Deskins, 1972). In the 20th century, such practices became more formalized as housing construction and urban development entered a new era.
One early formal tactic for differentiating housing was redlining. Redlining is the explicit, then-legal mechanism used by mortgage lenders and banks to exclude racial minorities from obtaining housing in certain neighborhoods (Sugrue, 2005). Redlined neighborhoods reinforced racial segregation and drove uneven development, well before deindustrialization hit American cities (Squires and Kubrin, 2005; Hoalst-Pullen et al., 2011). Their legacy remains even today: redlined areas have lower property values compared to otherwise similar neighborhoods (Appel and Nickerson, 2016).
Subsequent to the institution of ‘Fair Housing’ in 1968—which outlawed de jure housing discrimination (Callies and Simon, 2017)—other more insidious practices like blockbusting, racial steering, and exclusionary zoning continued the differentiation of neighborhoods by race (Highsmith, 2009; Liebmann, 1990; Kmiec, 1986). While it became illegal to discriminate in housing based on race, many people remain ‘stuck’ in neighborhoods as a function of their race or ethnicity (Braveman et al., 2018).
Almost as soon as blockbusting and white flight made waves in formerly all-white neighborhoods, the process of gentrification began elsewhere in cities (Pattison, 1977). Gentrification—literally the “return of the gentry” (Pattison, 1977, p. 22)—has been contrasted with standard redevelopment in the way it displaces populations and negatively impacts social fabric (Zuk et al., 2018; Smith, 1982). Processes of housing discrimination are inherent in the American brand of gentrification; elsewhere, the smaller influence of white flight and urban renewal policies has minimized the negative influences of urban redevelopment (Ley, 1986). Its presence in our study area, therefore, likely exacerbates existing disparities in access to services.
Conceptually, these processes were written off as part of an inevitable ‘neighborhood life cycle’ (Metzger, 2000). But the many obvious ways that real estate agents, banks, governments, and people made these processes happen and created a self-fulfilling prophecy of decline has increasingly been interrogated (Aalbers, 2014; Lang, 2000). Aalbers goes so far as to say that these actors: “actively and passively structure the process of neighborhood decline, e.g. by producing maps that not only describe but also prescribe neighborhood decline” (2014, p. 527). The intentionality behind neighborhood decline frames an important motivation for this work just as much as the intentionality behind the structuring of the food system, as discussed below.
1.2. Food Access
Given how housing discrimination bifurcated neighborhoods, one would not be surprised to find links between the concepts of poor food access and areas that had been redlined. Yet the way ‘redlining’ has been conceptualized in the food access literature instead remains distant from any connection to housing.
Eisenhauer (2001) popularized the term ‘supermarket redlining’ to refer to areas that had been systematically excluded from the conventional food retailing system. The term gained popularity, being used in several studies to illustrate what in fact was more directly measuring food access (Russell and Heidkamp, 2011; Cameron et al., 2010). It had grown so divorced from any specific connection to the original housing connection that by 2018 it was described as “the disinclination of chain supermarkets to locate or relocate existing stores from inner city impoverished neighborhoods to affluent suburbs” (Zhang and Ghosh, 2018, p. 79). While this term has become distant from a housing connotation, the process of deliberate decline in the food system in cities is the same: over many years, food retailers consolidated and grew their stores, increasingly locating them in suburban locales, all while inner cities saw their food options continue to dry up.
Generally, poor and minority neighborhoods have poorer access to healthy foods (Sallis and Glanz, 2006), which may be linked to poorer dietary habits among these populations (Morland et al., 2002). Perceived food access can likewise influence shopping and food consumption (Blitstein et al., 2012; Blanck and Kim, 2012), but most food access studies concern themselves with the measurement of the objective food environment to some degree. The methods used to measure this food environment range widely, from in-store to community-wide assessments of the quality of the food environment, also referred to as consumer and community food environments, respectively (Glanz et al., 2007; McKinnon et al., 2009). Some studies have connected the two, offering more depth than merely isolated store quality or superficial food access in a community (Frank et al., 2006).
1.3. Study Context and Rationale
Our study site is Baltimore, Maryland, a Mid-Atlantic American city that makes a good candidate for this novel inquiry into the relationship between patterns of housing discrimination and contemporary food access. Baltimore enacted America’s first official ‘segregation law’ in 1911 (Power, 1982). Their experience with blockbusting is similar to many other cities across America (Orser, 2015), and racial discrimination in rentals continued long after the passage of Fair Housing (Scanlon, 1984). In the 1990s and more recently, their experience with reinvestment has led to gentrification of many formerly poor neighborhoods (Wyly and Hammel, 2004). Subsequent efforts at developing an inclusionary housing ordinance saw mixed results (Brown, 2016b), and it remains one of America’s most segregated cities (Massey and Tannen, 2015).
Likewise, inequalities in their food environment have been studied for many years. One study examined the impact of a healthy stores program in several supermarkets and Korean American-owned corner stores (Gittelsohn et al., 2010). Subsequent development of Baltimore Healthy Eating Zones likewise aimed to improve dietary habits by addressing the food access issue (Gittelsohn et al., 2013). More recently, others have engaged with the food system at large, formalizing the Baltimore Food Policy Initiative (Santo et al., 2014) and creating a Baltimore Food System Resilience Advisory Report (Biehl et al., 2018).
Our paper builds on work by Misiaszek et al. (2019), who published a Healthy Food Availability Index (also discussed in their earlier report on Baltimore’s food environment (Misiaszek et al., 2018)). That report highlights the result of their food store assessment, completed using the reliable Healthy Food Availability Index-Brief (HFAI-B) tool. The report highlighted that supermarkets had significantly higher HFAI-B scores, and public markets tended to score higher than corner stores and other types of stores. Even so, wide ranges in scores among small grocers and convenience stores mean some of those can be counted on as healthy food sources (particularly when they offer WIC and SNAP).
Rather than using the stigma-laden ‘food desert’ concept, they defined Healthy Food Priority Areas (HFPAs), a composite of areas where: 1) the average HFAI score of all stores is 0 to 9.5; 2) median income is at or below 185% of the federal poverty level; 3) over 30% of households have no vehicle; and 4) average distance to a supermarket is greater than ¼ mile. These areas largely coincide with the locally-known ‘Black Butterfly’ (Brown, 2016b) that extends east and west of downtown. Notably, 32% of African Americans live in HFPAs, compared to 9% of whites, 7% of Asians, and 11% of Hispanics.
With the baseline of food availability in Baltimore established, this work introduces a new wrinkle in food justice efforts. Because while our contemporary environments have a direct negative impact on food availability, long-term ‘legacy’ effects of other processes may be related to the quality of our built environment, including environmental degradation and toxic exposure (Stephens and Partridge, 2015; Hanna-Attisha et al., 2015). Bilal (2016) introduced the potential link between food access and redlining in Baltimore, and we extend that argument here.
In this case, the central topic of concern is how housing discrimination can create neighborhoods that are differentially attractive to investment from food retailers. This is important, because many food justice movements are premised on the fact that discrimination has led to disinvestment and inequitable reinvestment (i.e. gentrification) in non-majority white neighborhoods (Alkon and Cadji, 2020; Pettygrove and Ghose, 2018; Sbicca and Myers, 2017). Yet a lack of evidence specifically showing how each process in turn is related to neighborhood investment limits the advocacy that can be done. Our overarching hypothesis is that HFAI scores will be lowest in blockbusted neighborhoods and highest in gentrifying neighborhoods.
2. Data
Our data includes redlining, blockbusting, gentrification, and food access variables. The redlining dataset comes from the University of Richmond’s Mapping Inequality Project (Nelson et al., 2020), which digitized every redlining map generated during the 1930s in the US, including Baltimore’s 1937 map. Blockbusting data is based on change in racial composition from one decade to another, and comes from US census data. Gentrification is defined using the same metric as the National Community Reinvestment Coalition (NCRC) (Richardson et al., 2019), which also leverages US census data.
The data for the food access measure comes from a 2016 survey in which the CLF conducted an assessment of every store inside the city of Baltimore using their HFAI-B (Figure 1). The HFAI-B has high reliability and offers a more refined view of healthy food access than what is available from referencing food inspector databases or business listings (Misiaszek et al., 2019). Based on the Nutrition Environment Measures Survey in Stores (NEMS-S), it includes information on a variety of healthy food options, including vegetables (fresh, canned, and frozen), fruits (fresh, canned, frozen, and juices), dairy, proteins (beans, beef, chicken, fish), grains (tortillas, rice, pasta, cereal), frozen meals, and soup. The maximum possible score is 28.5, and 881 stores were assessed (with an additional 87 closed stores and 26 refusals). The stores assessed included 47 supermarkets, 525 small grocers, 303 convenience stores, and 6 public markets, and each type of store had reliability assessments conducted. Final geocoded shapefiles of these assessments were provided to the first author for further spatial analysis, with the intention of further exploring the healthy food landscape in Baltimore.
Fig. 1.
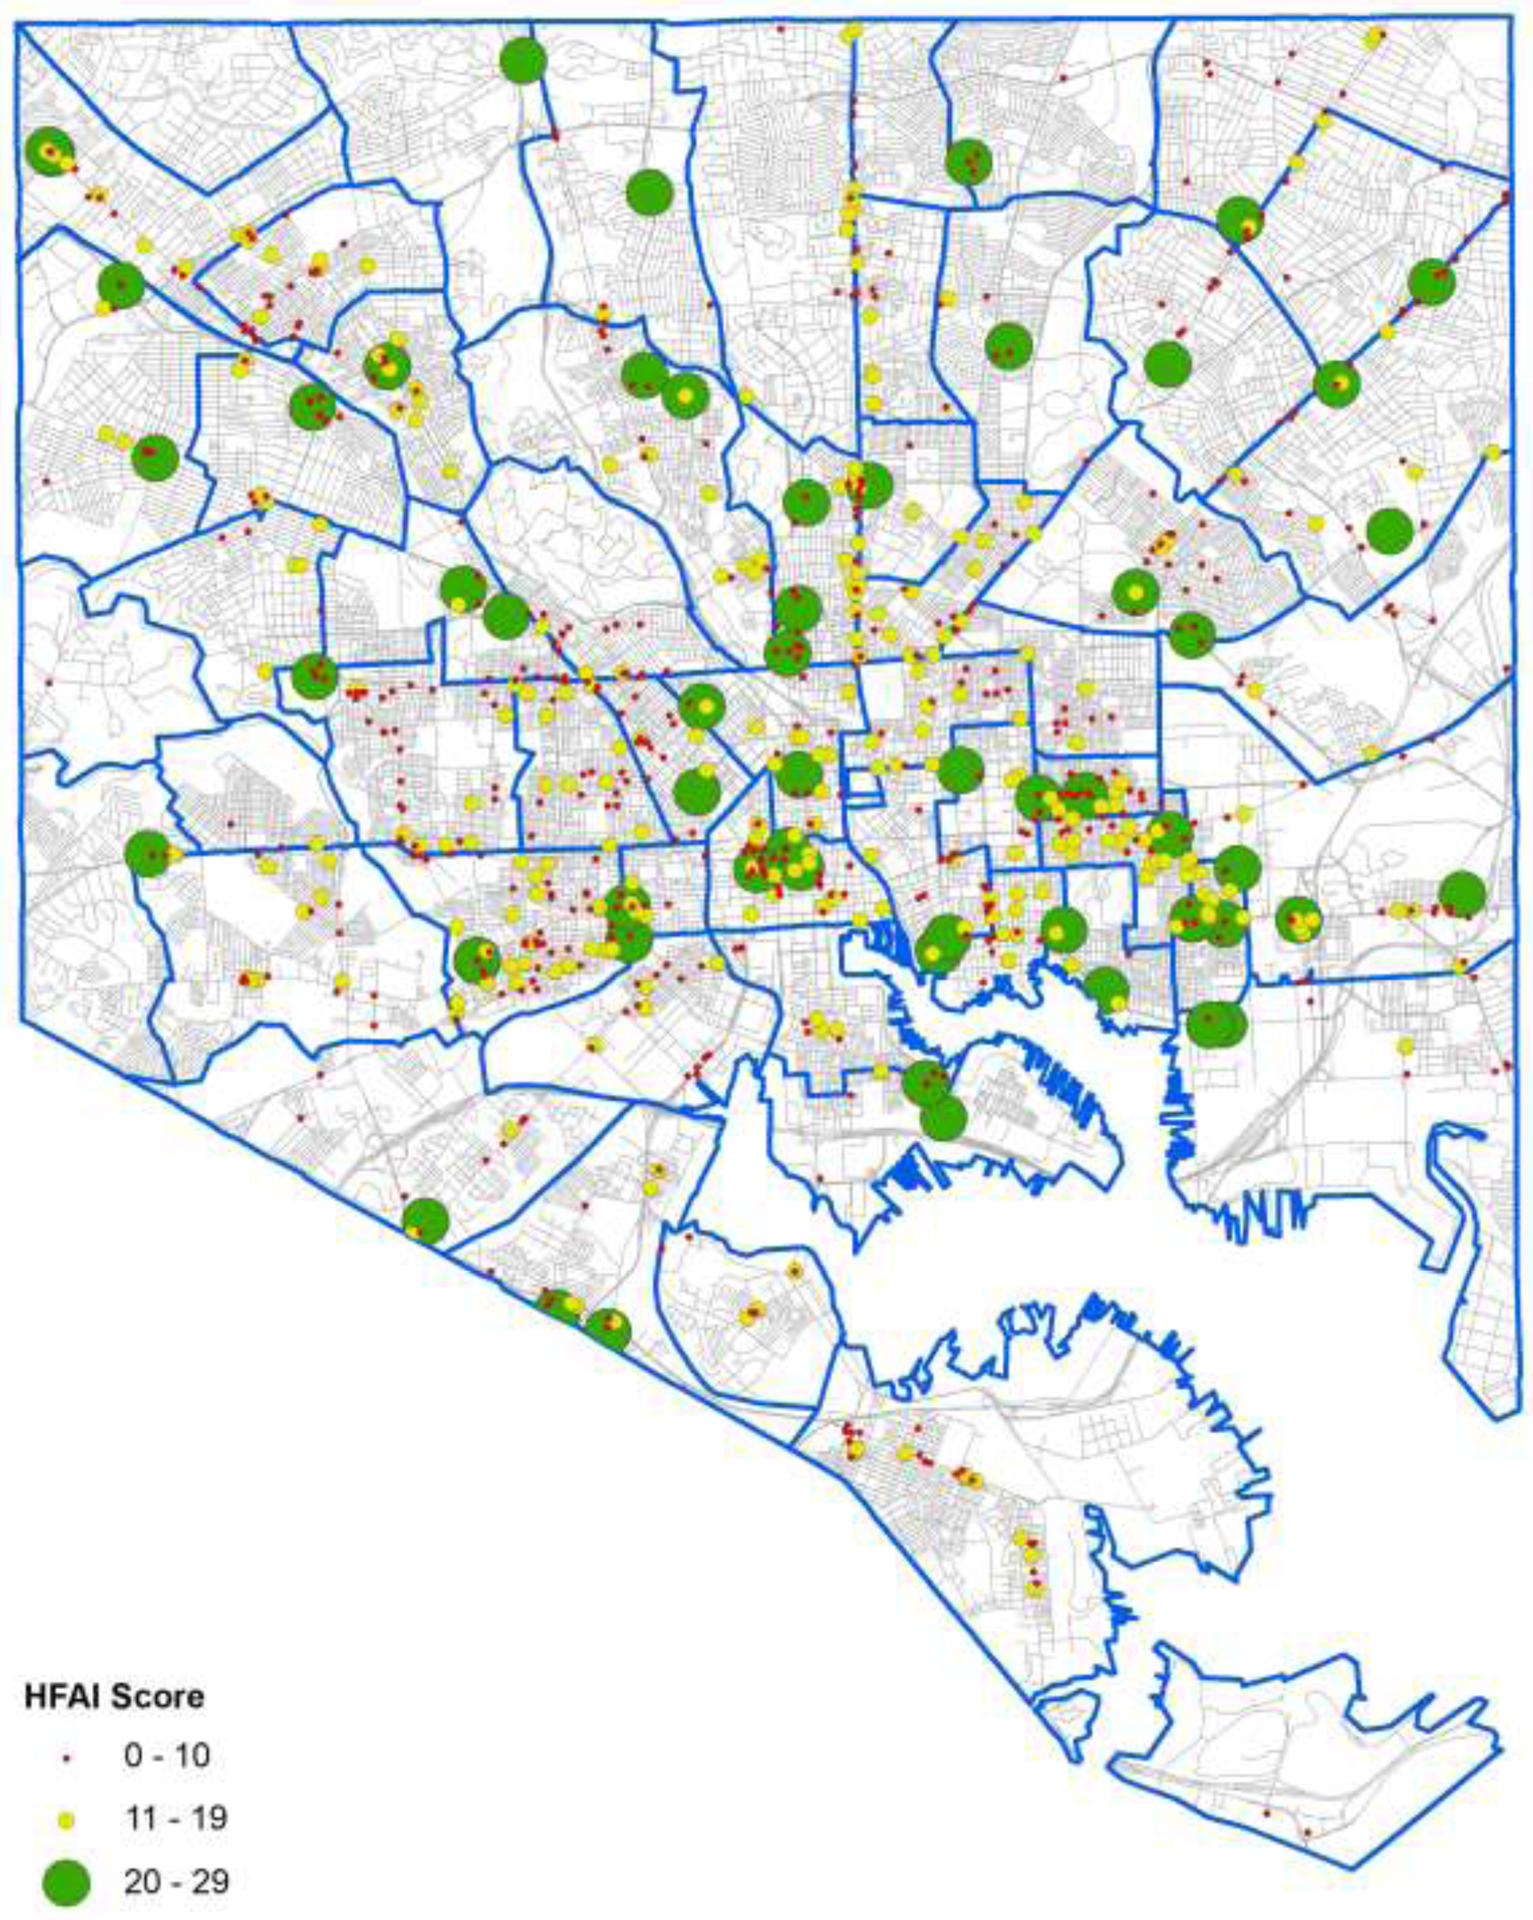
Results of CLF Assessment.
3. Methods
Our methods largely center on using geographic information systems to establish and link spatial measures of food access and housing discrimination. We connect these constructs via a multivariate regression analysis—using parcels as the unit of analysis—to determine the association between housing discrimination and food access (while controlling for race, socioeconomic status, and age of housing). To check that our variables reflected different constructs and were acceptable for our multivariate model, we ran a series of diagnostic tests. Our check for multicollinearity revealed acceptable VIFs (all below 2.5), and the residuals had an approximately normal distribution with a reasonable amount of homoscedasticity.
3.1. Food Access
To gain a deeper understanding of the nature of food access than would be possible only by geocoding stores locations and visualizing scores, we employ the kernel density analysis tool common to ArcGIS, using HFAI scores for 2012 and 2016 as the weight for each point. Kernel density analysis creates a raster surface based on the density and value of features around each cell. While it does not account for variations in population density, it is useful for seeing the overall total value of HFAI scores in any given neighborhood. Given its continuous surface, it is also useful for highlighting broad areas that have relatively lower or higher food access scores.
3.2. Housing
Our ‘sample’ in this analysis is the individual residential parcel. Our parcel dataset from the Baltimore City Open GIS (2020) included land use type and year of construction. For this paper, we isolated only the residential parcels, and appended the HFAI scores from above and the housing variables introduced below to their records.
3.2.1. Redlining
Our redlining variable is based on the HOLC’s designation of neighborhoods in one of 4 classes (green = best, blue = still desirable, yellow = declining, red = hazardous). Since mortgages were restricted in redlined ‘hazardous’ neighborhoods, we focus especially on these areas, but our analysis distinguishes among all 4 classes and areas that were ‘not rated’ (due to either being non-residential or not-yet-developed).
3.2.2. Blockbusting
Sadler and Lafreniere (2017) were the first researchers to define blockbusting in GIS for use in spatial analytic inquiries. In their work, they referenced neighborhoods that lost more than half their white population during the 1950s, 1960s, or 1970s as having been blockbusted. We extend their work here by using a similar framework to define neighborhoods where blockbusting is likely to have occurred, calculating the percent change in the white population between census periods for the 3 decades from 1950 to 1980. Neighborhoods experiencing white flight of more than 75% were deemed ‘extreme blockbusting’ and given a score of 3. Neighborhoods with white flight of between 50% and 74% were deemed ‘high blockbusting’ and given a score of 2. Neighborhoods where white flight was between 25 and 49% were deemed ‘moderate blockbusting’. These scores were summed across the three time periods, though no neighborhood saw such an extreme in more than two. Thus the maximum sum blockbusting score was 3, and neighborhoods were given designations of very high, high, or some blockbusting based on a score of 3, 2, or 1.
3.2.3. Gentrification
Our gentrification measure was derived using a method developed by the National Community Reinvestment Coalition (NCRC) (Richardson et al., 2019) that measures both economic gentrification and population displacement. Eligible tracts are those below the 40th percentile in median home value for the region as of the 2000 census. Gentrified tracts are those for whom median home value and percent of college-educated people was at or above the 60th percentile regionally, and where median household income increased. Tracts that lost 5 percent or more of any racial or ethnic group have experienced ‘displacement’. For this process, we made use of Brown University’s Diversity and Disparities web mapping tool, and normalized census unit boundaries to current boundaries (as in Logan et al., 2014, 2016).
3.3. Sociodemographic Characteristics
While this investigation is focused on uncovering legacy influences of historical housing patterns, we account for contemporary variations in socioeconomic and racial composition that may influence food access. We employ a commonly used socioeconomic distress index (originated by Pampalon et al., 2009) recently used in Baltimore (Hippensteel et al., 2019). This index is operationalized at the census block group (CBG) level, and represents an unweighted sum of the z-scores of 4 variables available in the census that predict material and social deprivation, namely: low educational attainment, low income (i.e. living below the poverty line), unemployment, and lone parent families. As well, we computed the percent of African American population for each CBG, since racial disparities in both housing and food access persist. We also control for the era of construction by using the age of the residence on each parcel (found in the parcel dataset).
4. Results
For specificity, throughout our results section, we refer to Baltimore neighborhoods as defined by the Community Statistical Areas in Baltimore’s Neighborhood Health Profile Reports (Baltimore City Health Department, 2017). These represent important reference points, because health communication and advocacy are often conducted at the neighborhood level.
4.1. Food Access
The results of the kernel density analysis illustrate the general pattern of good to poor healthy food access using the 2016 HFAI data (Figure 2). The highest scores are seen closer to the center in the ‘white L’ (Brown, 2016b), including in Patterson Park North and East, Highlandtown, and Madison/East End in the east; Downtown/Seton Hill in the center; Poppleton and Southwest Baltimore to the west; and Barclay to the north. The Jonestown/Oldtown and Perkins/Middle East neighborhoods are expectedly lower than the areas immediately surrounding them. Lower scores are seen in the suburbs, as this tool measures only the scores around store sites (thus areas distant from stores simply receive no score). Given their lower socioeconomic status and therefore potential vulnerability to food insecurity, lower scores in Sandtown-Winchester & Midtown are concerning.
Fig. 2.
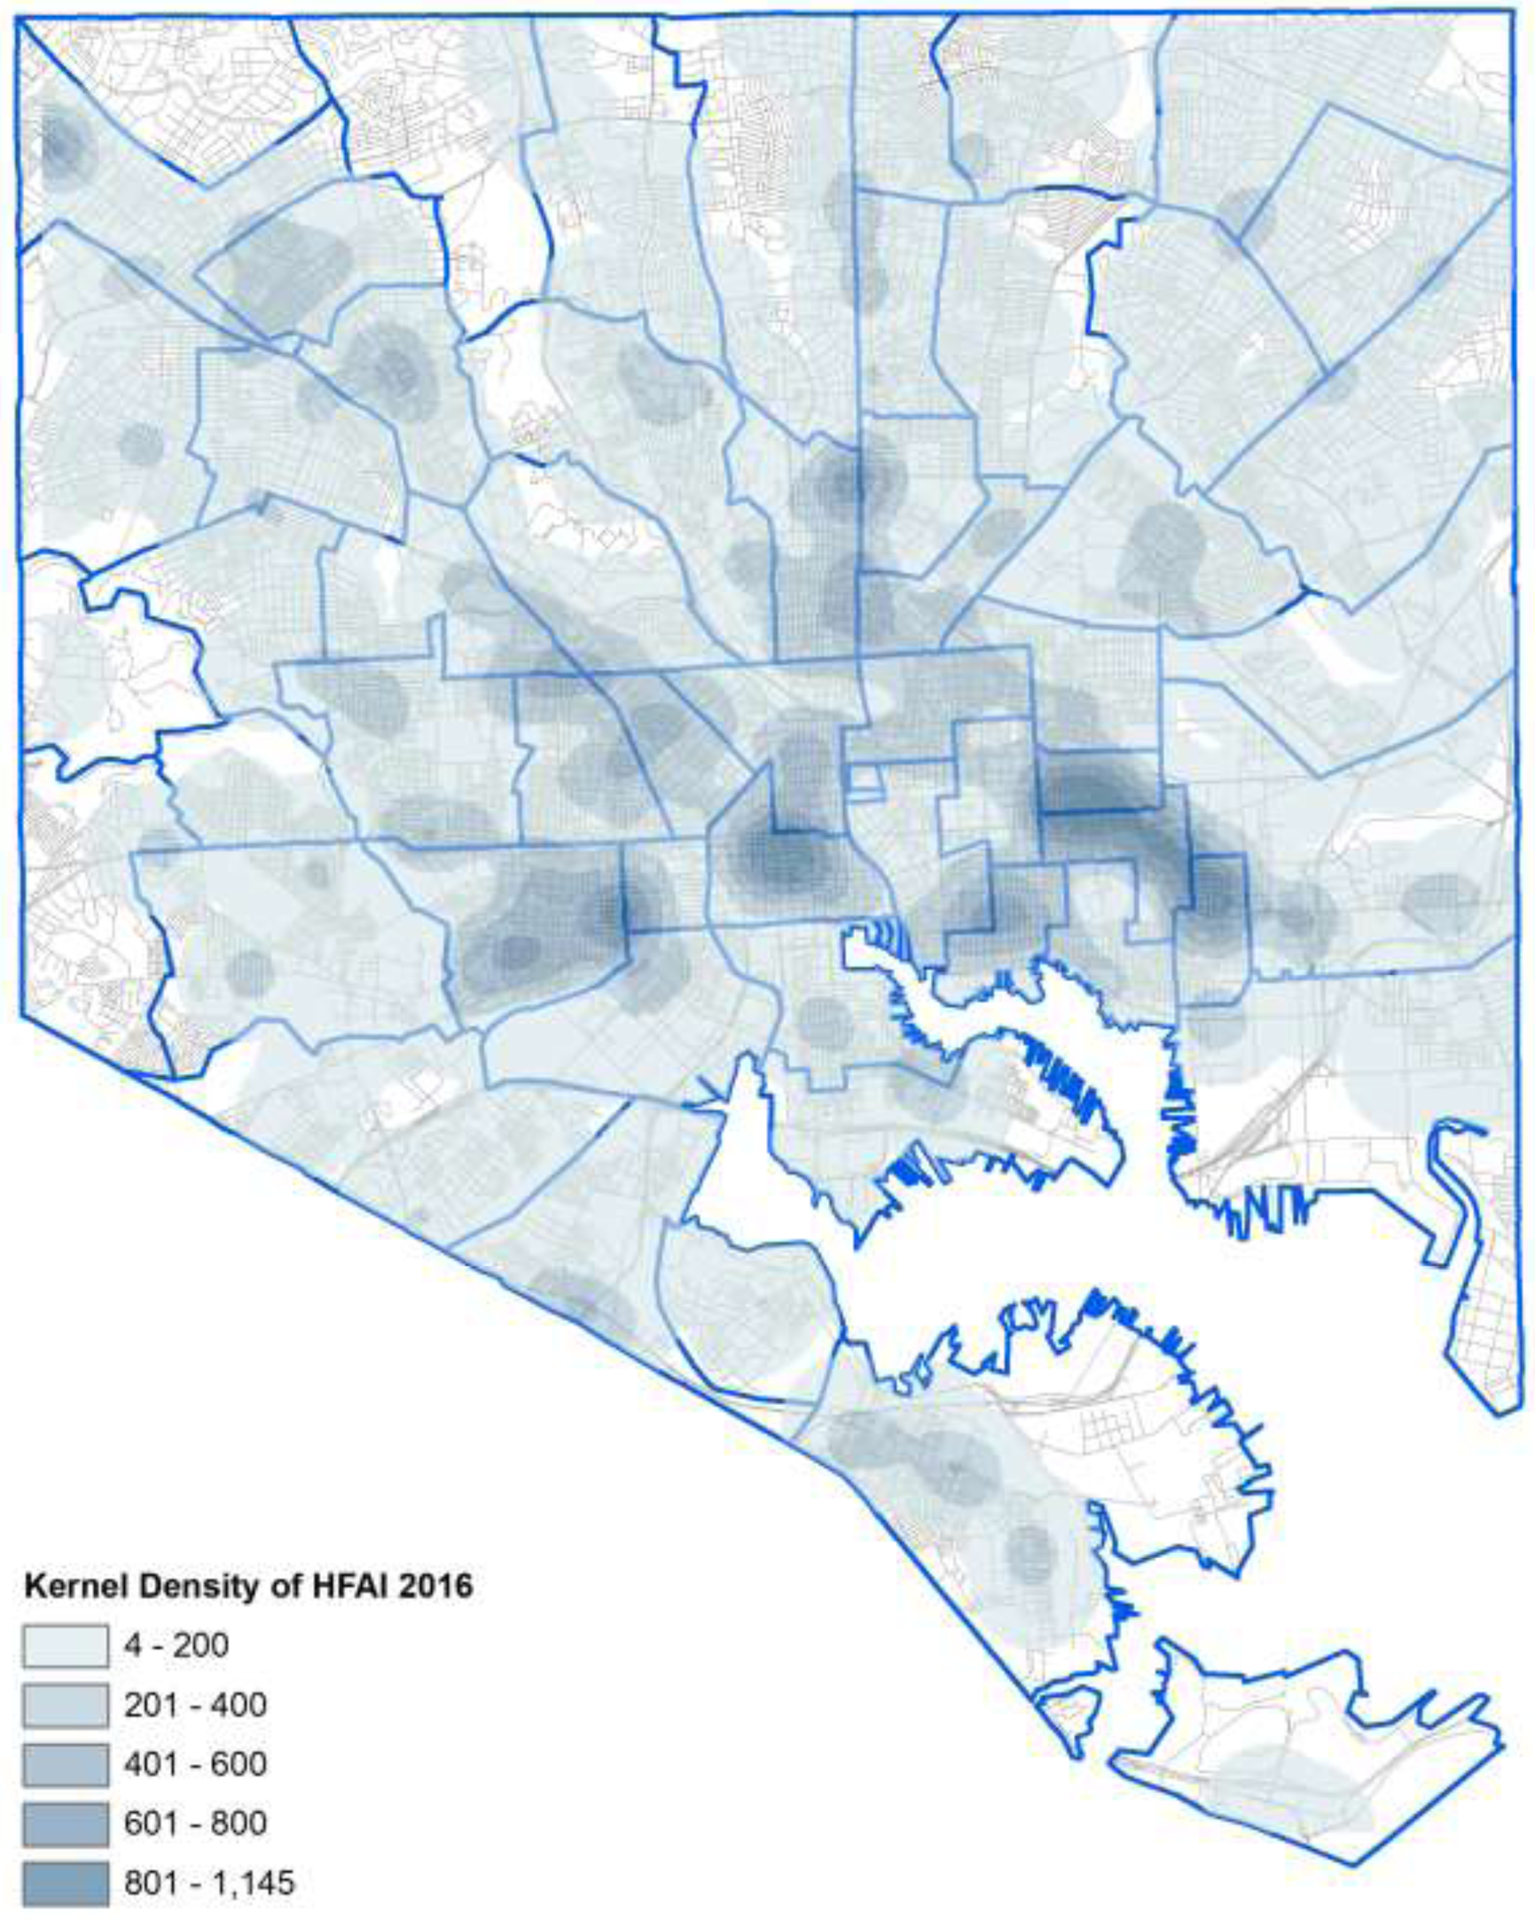
Results of Kernel Density on HFAI Scores.
4.2. Housing
Because we are interested in the relationship of these variables to other social and built environmental characteristics, we also here consider age of housing (Figure 3), as well as the socioeconomic status and racial composition of CBGs throughout the city (Figures 4 and 5). Figure 3 illustrates the expected pattern of newer housing along the fringe of Baltimore, particularly in the northeast. Figure 4 highlights another important pattern, that of socioeconomic distress. Distress—itself a composite of the 4 aforementioned census variables (low educational attainment, low income, unemployment, and lone parenthood)—is generally higher in two swaths: one covering most of west Baltimore, the other in a more concentrated area in east-central Baltimore. More suburban areas, places near downtown and Fells Point, and a swath heading north from downtown all exhibit lower socioeconomic disadvantage. Relatedly—given how the societal pattern of discrimination contributes heavily to race-related poverty—the concentration of African American residents follows a similar pattern (Figure 5). More prominently, however, a de facto ‘color line’ persists, highlighting the ‘black butterfly’ and ‘white L’ discussed previously by Brown (2016b). To illustrate the connections among the three types of discriminatory housing variables, redlining, blockbusting, and gentrification are shown in Figure 6.
Fig. 3.
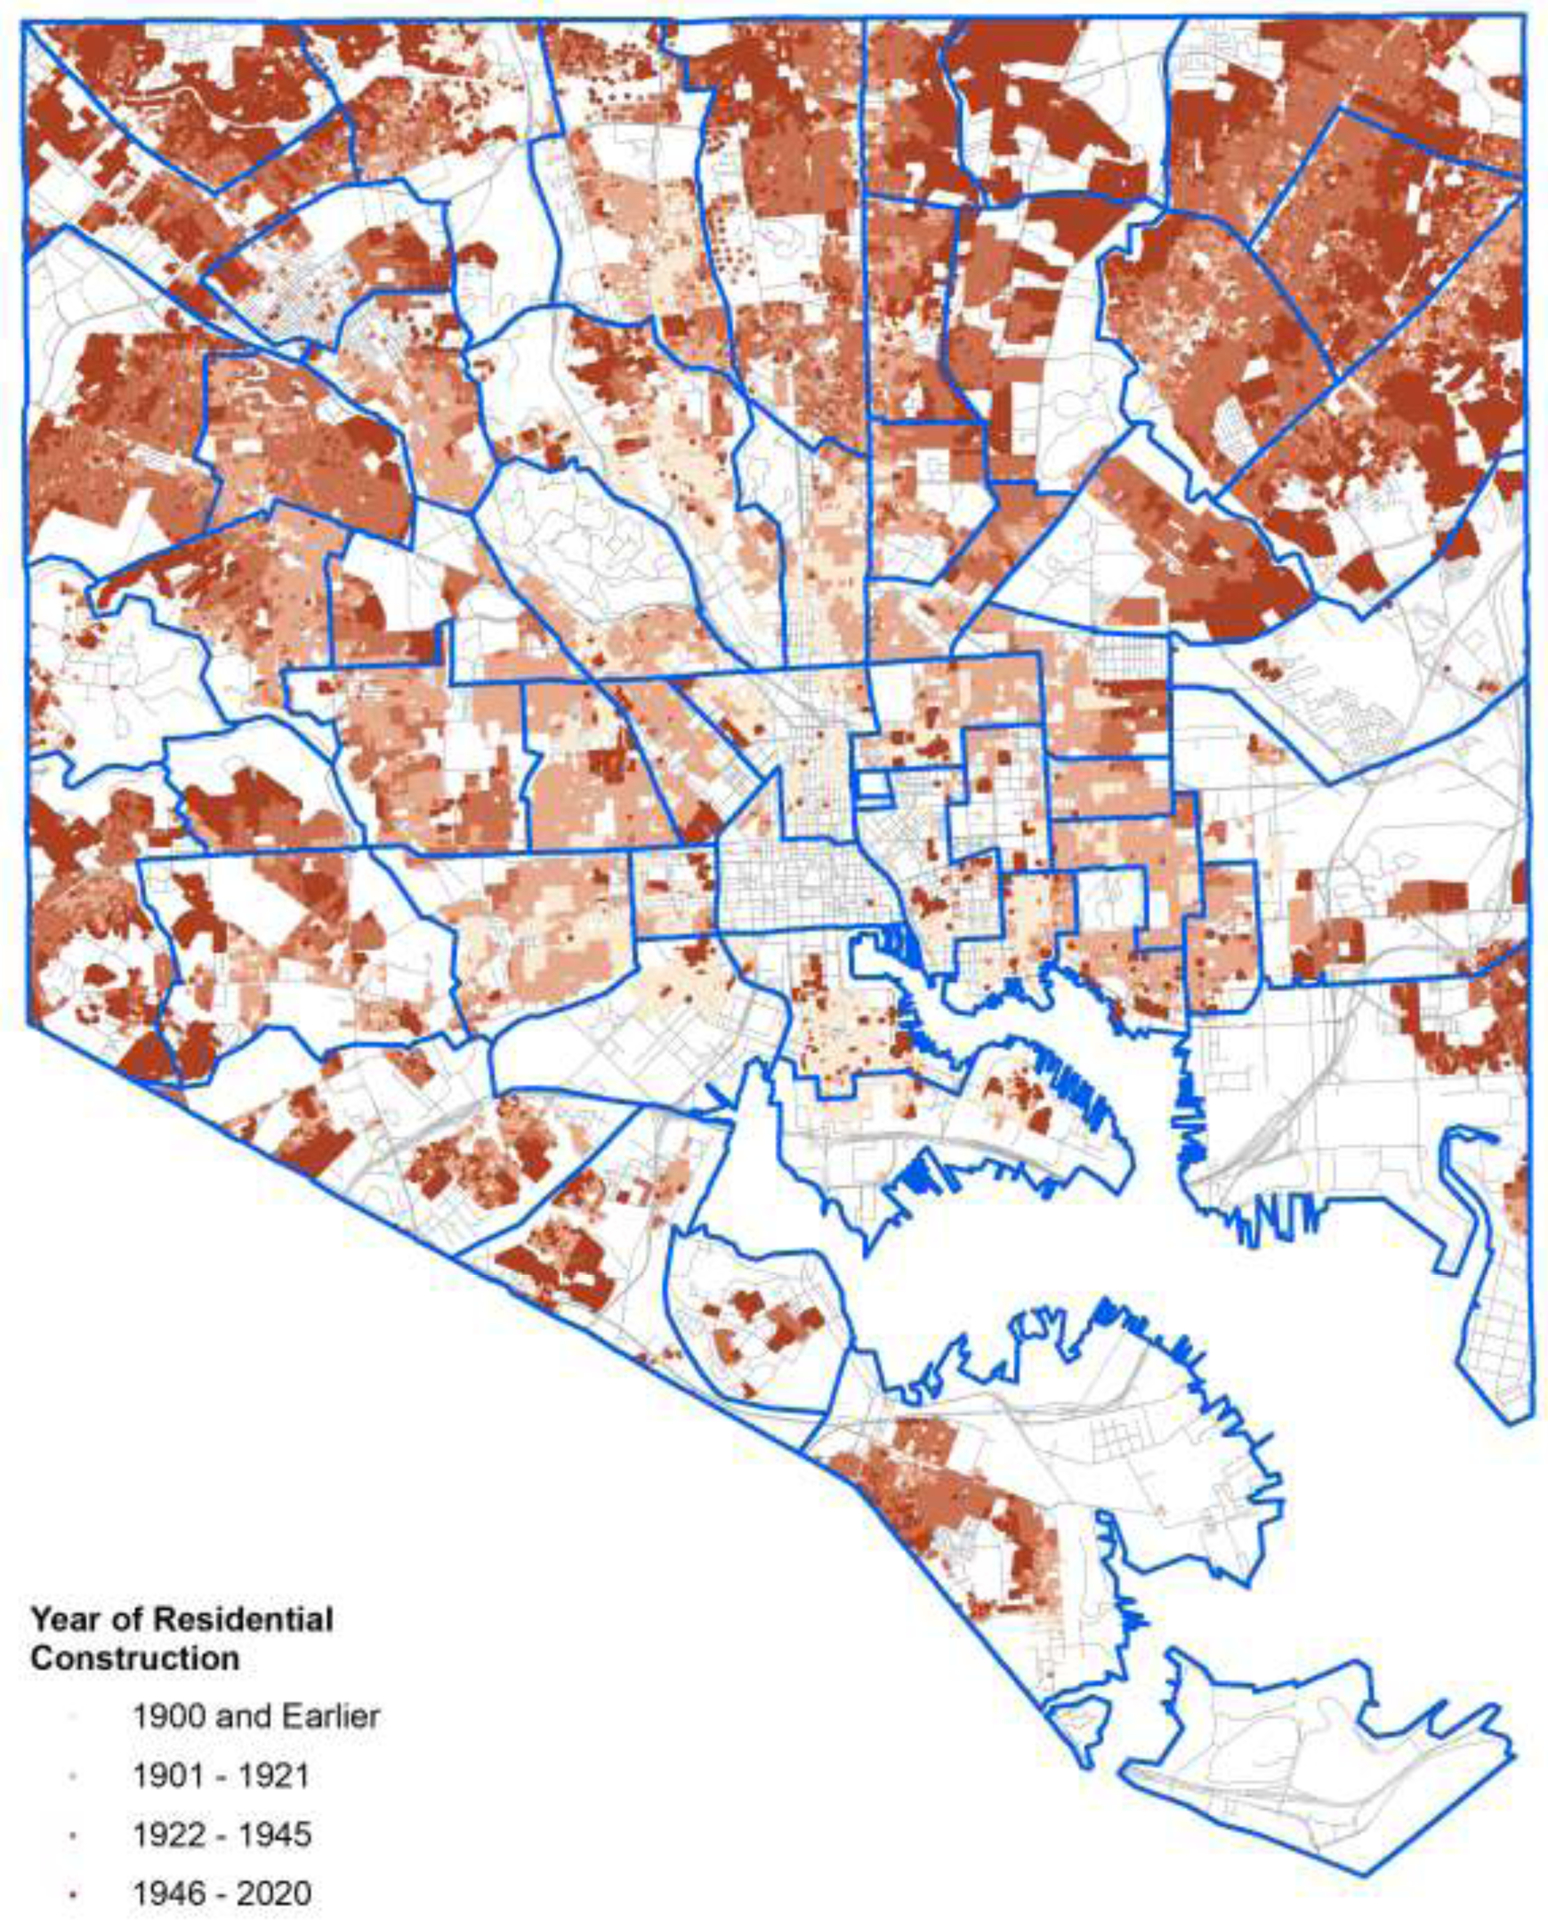
Age of Housing.
Fig. 4.
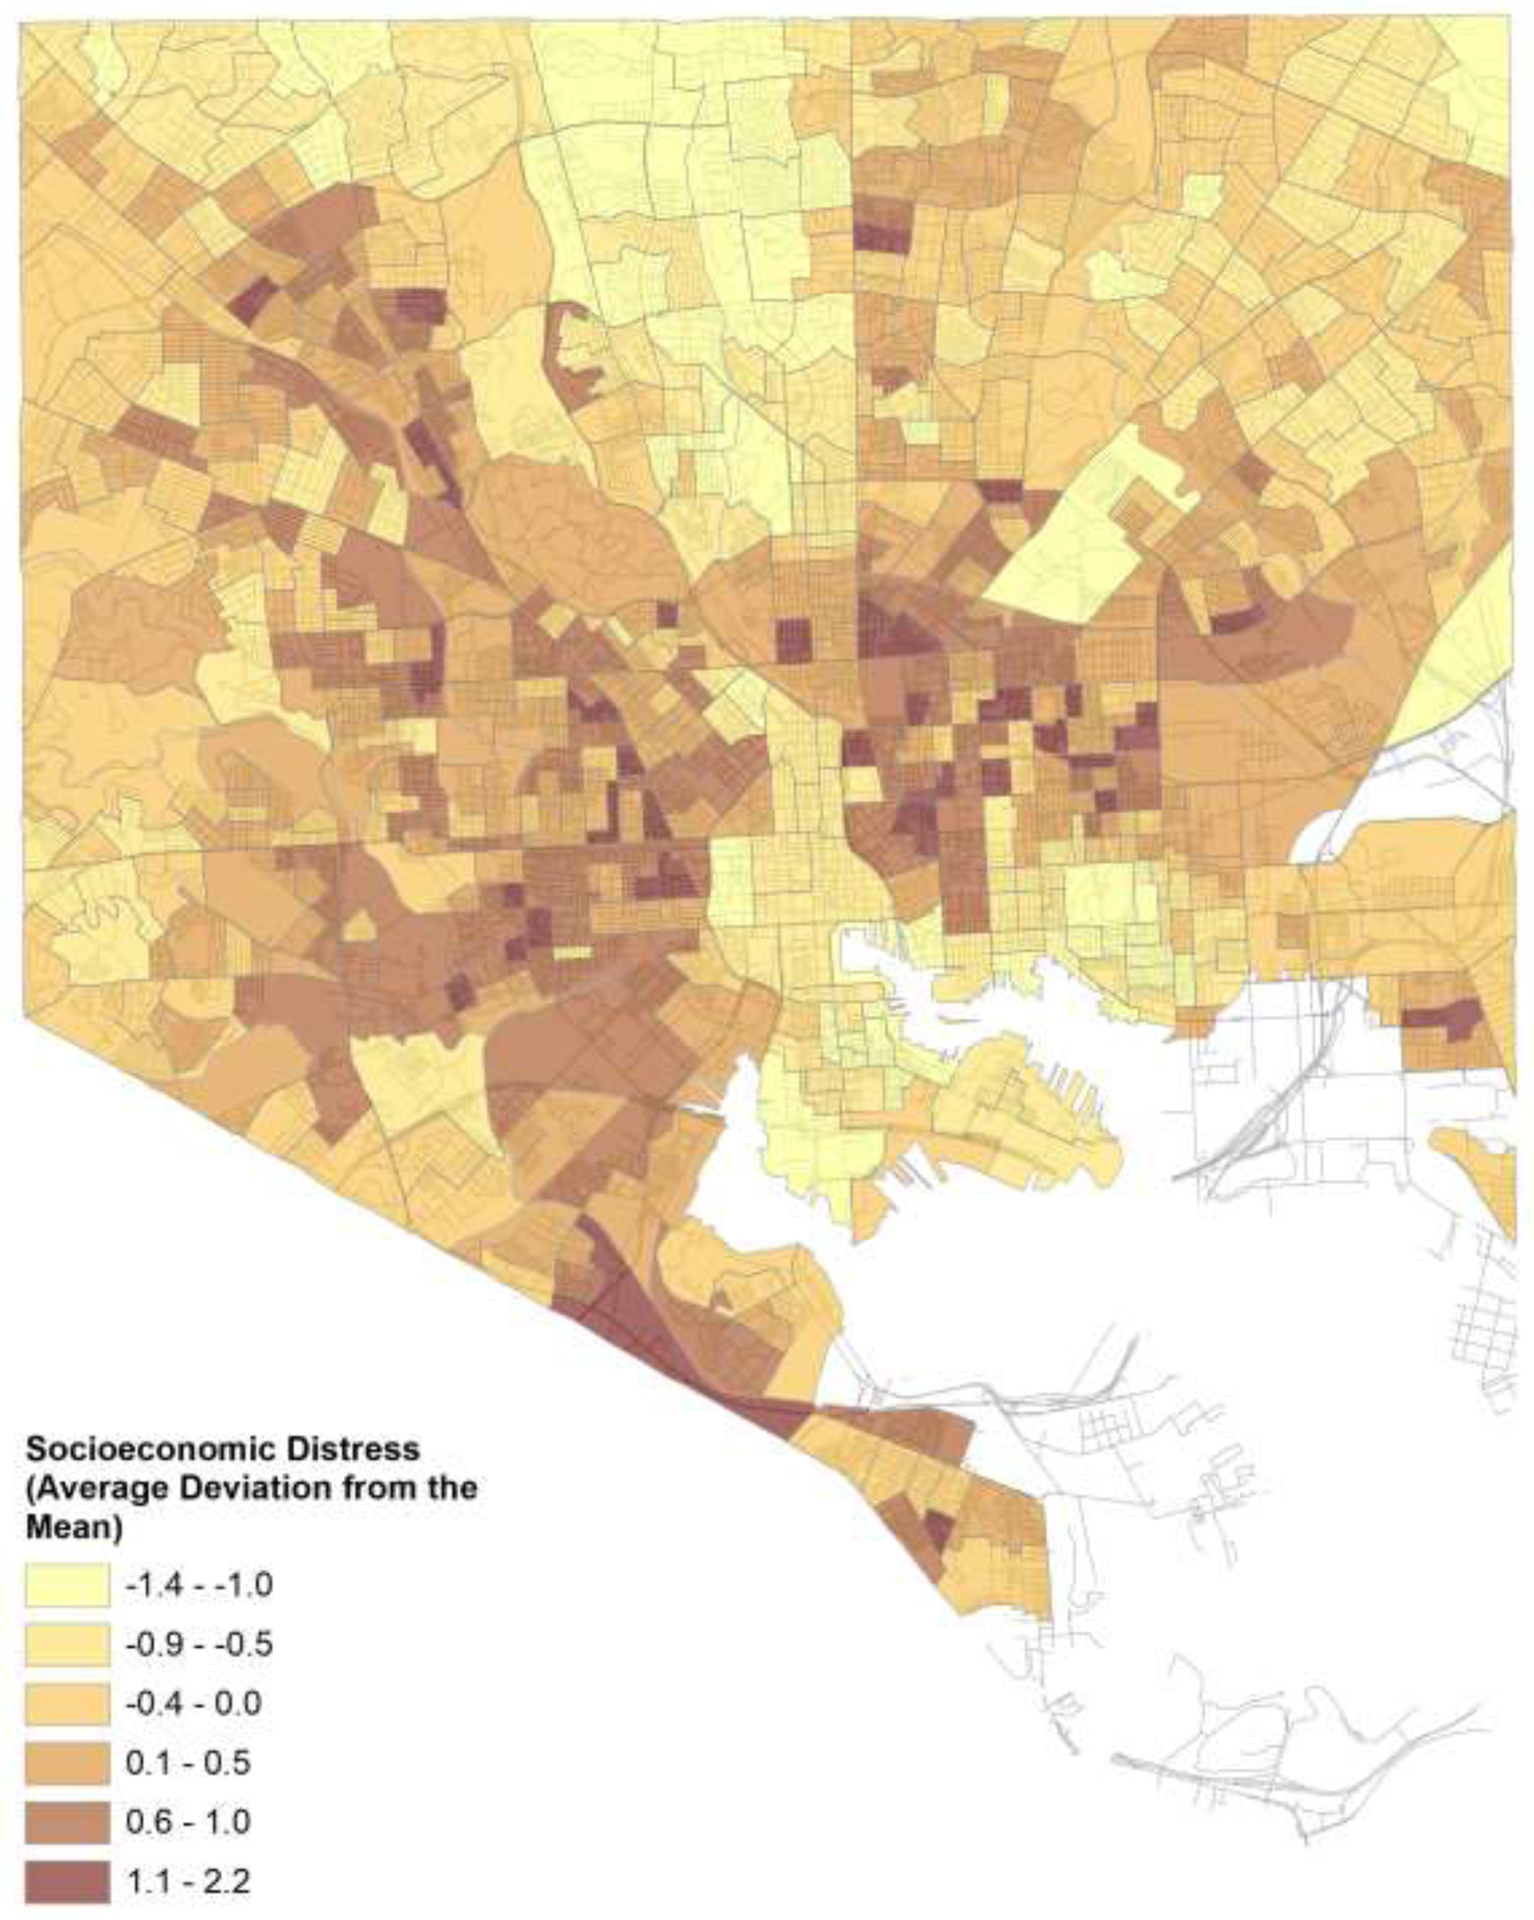
Relative Socioeconomic Distress Levels.
Fig. 5.
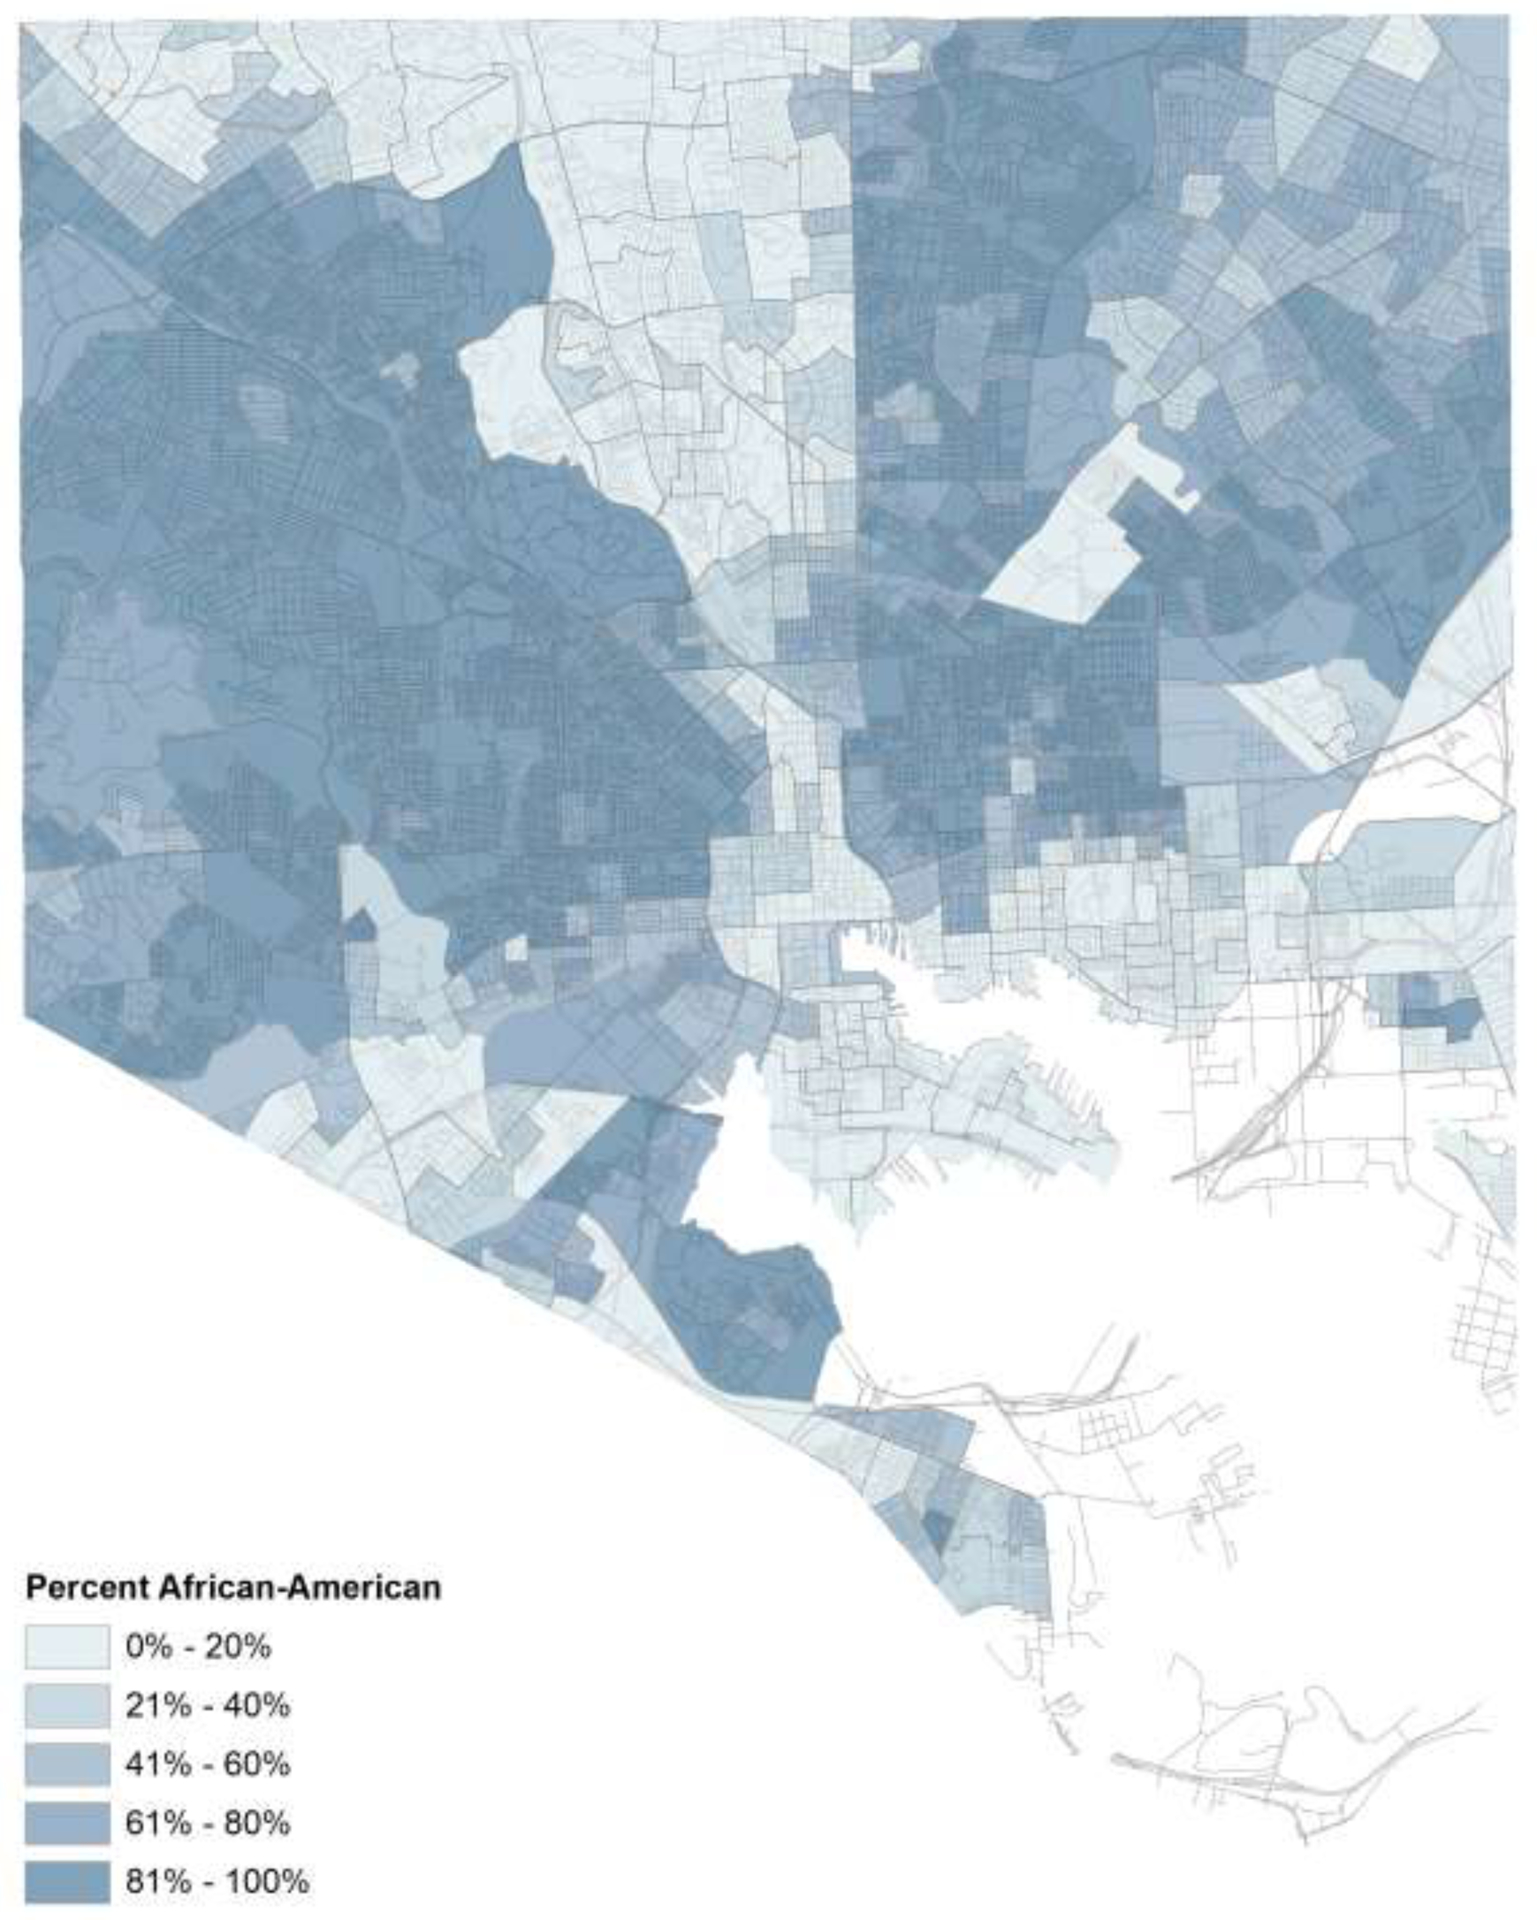
Concentration of African Americans.
Fig. 6.
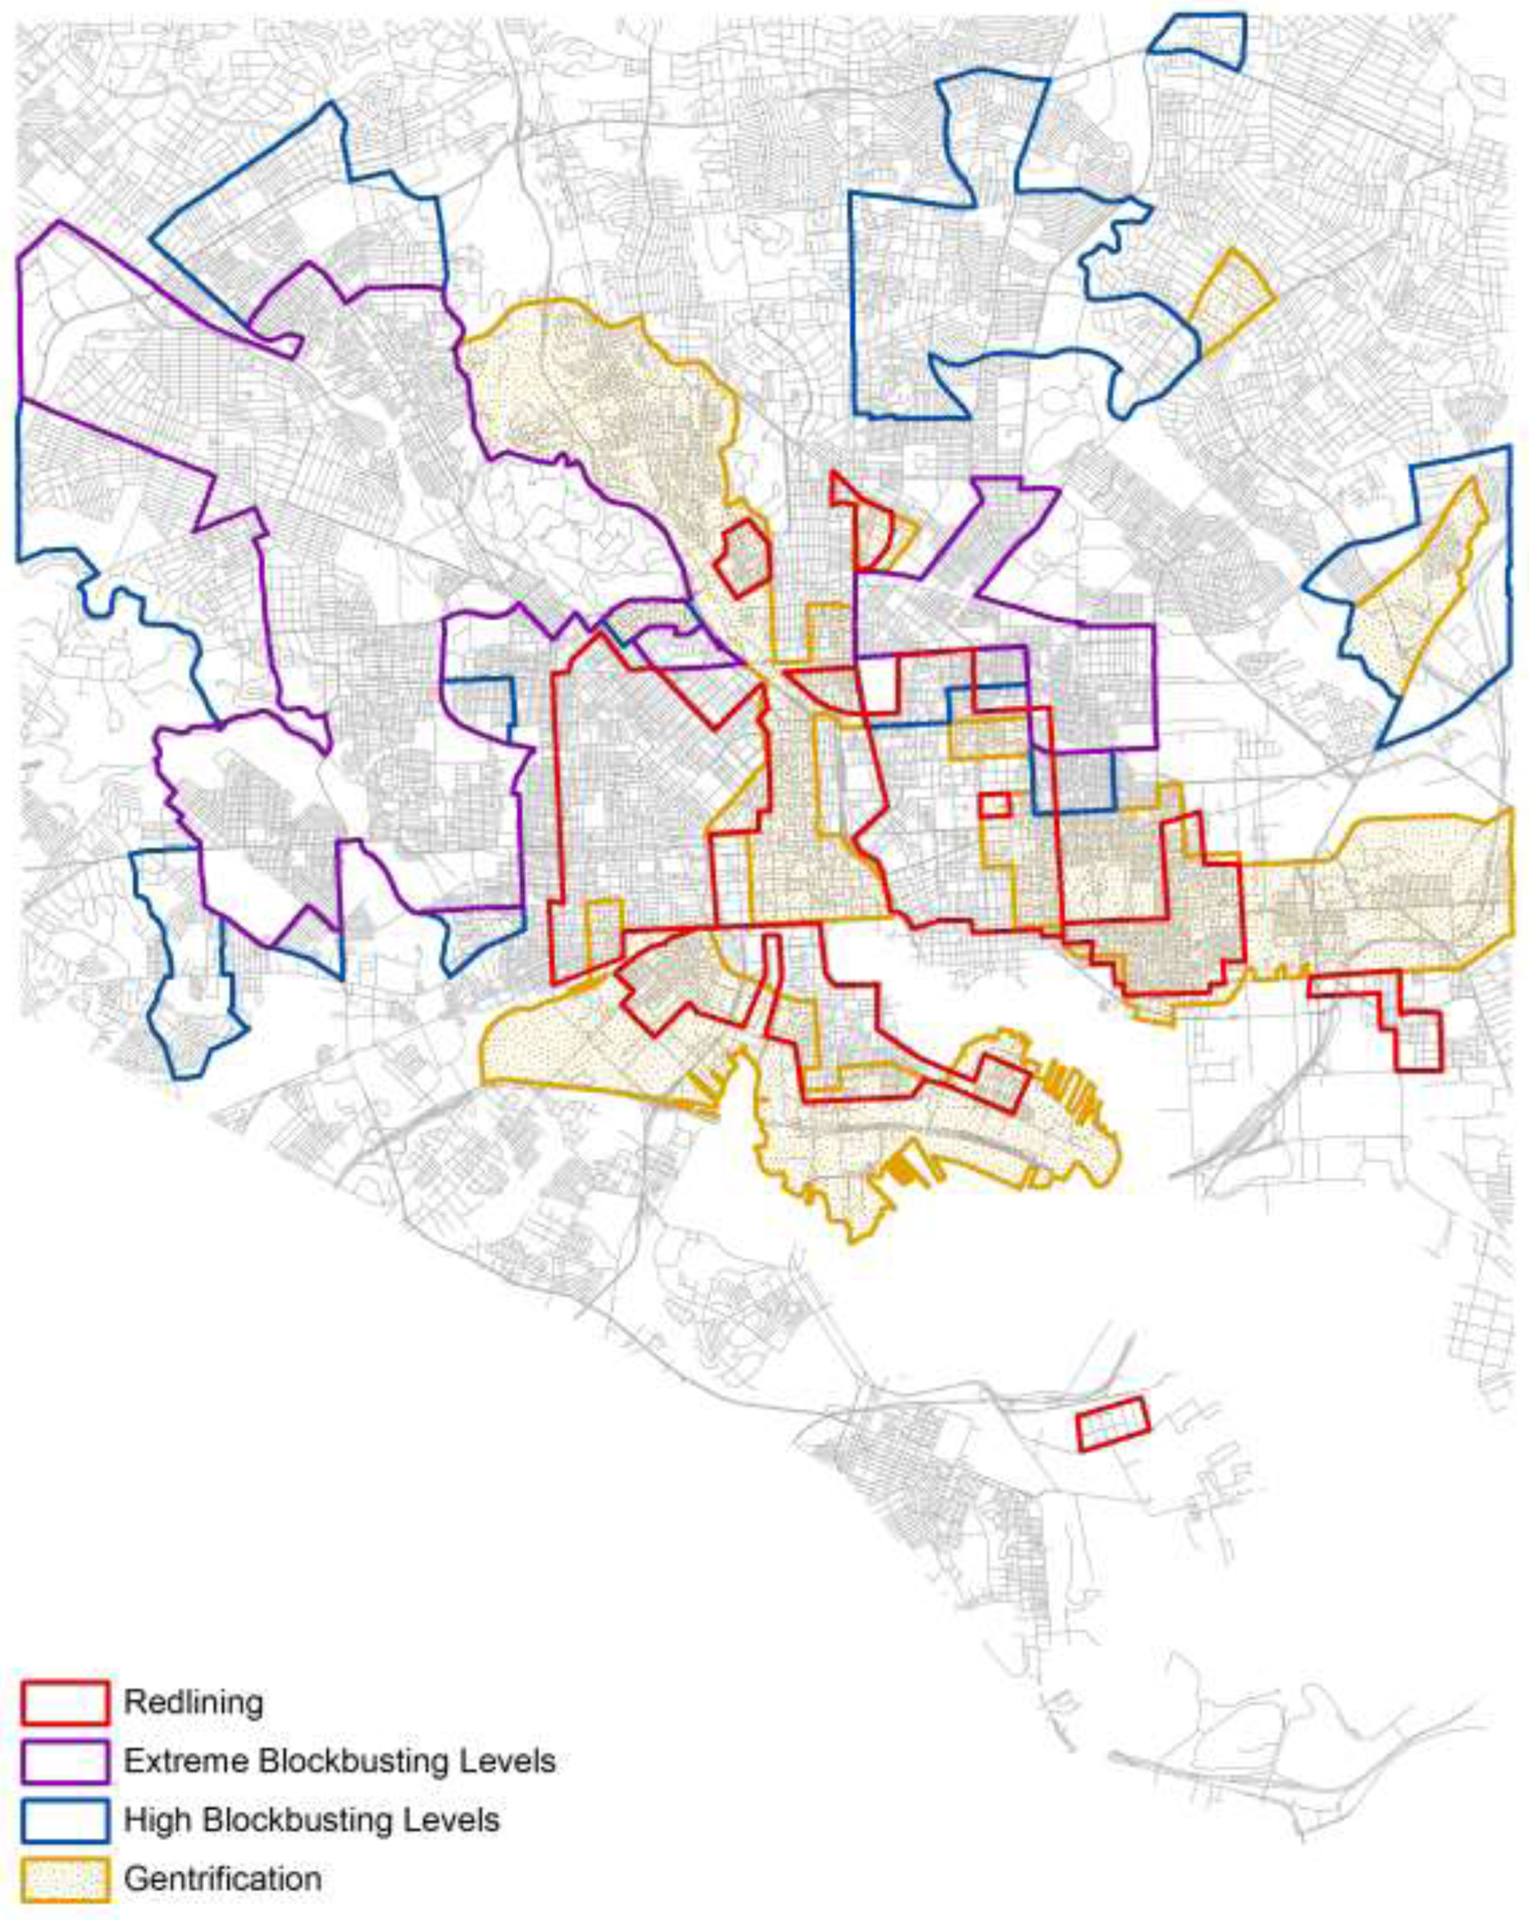
Summary Map of Discriminatory Housing Practices.
4.2.1. Redlining
Reflecting the development pattern and racial segregation of the day, the inner-most parts of Baltimore were redlined, while only the most distant outlying areas received green or blue ratings. In Figure 6, redlined areas are shown to highlight the inner circle of neighborhoods where investment was restricted until the late 1960s.
4.2.2. Blockbusting
The blockbusting analysis was run for the 1950s, 1960s, and 1970s (as in Sadler and Lafreniere, 2017) (Figure 6). In the 1950s, inner-suburban areas around the core—including Greater Rosemont, Penn North/Reservoir Hill, Midway/Coldstream, and Madison/East End—experienced massive white flight, with greater than 75% of these residents leaving ahead of perceived fears related to racial integration. Other areas around these also experienced significant white flight, including Allendale/Irvington, Clifton-Berea, and Greenmount East. The 1960s saw a new group of neighborhoods with extreme white flight, mostly to the northwest, including Edmonson Village, Southern Park Heights, Dorchester/Ashburton, and Howard Park/West Arlington.
By the 1970s, the worst of the white flight had passed, but large numbers of white residents (50–74% of the population) moved out of outer suburban locales within the city, including Glen-Falstaff, Greater Govans, Northwood, and Irvington. The only part of the city with extreme blockbusting was in the far east, in Claremont/Armistead.
The composite blockbusting measure was created by combining the total number of decades with extreme (3 points, in purple), high (2 points, in blue), or moderate (1 point, not shown) blockbusting. These signify an important distinction in socioeconomic or racial change in the city, because not every predominately African American neighborhood was blockbusted. These places make up most of west Baltimore, as well as areas north of Johns Hopkins Bloomberg School of Public Health in the east. Our general hypothesis is that HFAI scores will be lowest in these areas because of the recency and severity of disinvestment characterized by blockbusting and white flight.
4.2.3. Gentrification
The last of our housing related variables was gentrification (in yellow on Figure 6). In keeping with the NCRC’s designation, we computed areas where both median income increased and displacement occurred. The areas that are gentrified almost perfectly mirror the shape of the ‘white L’, running from Hampden/Woodberry in the north, through downtown, and east out toward Canton and Highlandtown. As noted, we also expect gentrified areas to have higher HFAI scores.
4.2.4. Housing Dynamics
Figure 6 reveals some key patterns, foremost that few places have coincidence of two or more phenomena. That is, areas that were blockbusted have seldom been gentrified, and redlined areas were never blockbusted. Redlined areas, in contrast, have seen gentrification in recent years. A critical point of consideration, then, is the potentially disparate outcomes between places that were previously redlined but are now gentrifying and places that were blockbusted and continue to experience disinvestment.
4.3. Linking the Food Environment with Housing
As noted above, we used the house age variable from the City of Baltimore’s parcel shapefile to segment the average HFAI kernel density scores by type of redlining, blockbusting, or gentrification into bins based on age. This is useful in highlighting the general classes of housing that are better or more poorly served by healthy food options.
Prominent patterns appear with respect to redlining (Chart 1). Generally speaking, redlined neighborhoods have higher HFAI scores (2 times higher than the average of the remainder), while green and blue rated neighborhoods have much lower scores. Areas not rated during the assessment period in the 1930s were typically developed after that era, and have average HFAI scores. Post-war housing expectedly has the lowest scores across the board. And overall, older housing is associated with higher HFAI scores, owing perhaps to the greater density and more urban nature of that housing. But inter-war housing in previously redlined areas (effectively, those places that were new at the time redlining began) has the highest score of any sub-group.
Chart 1.
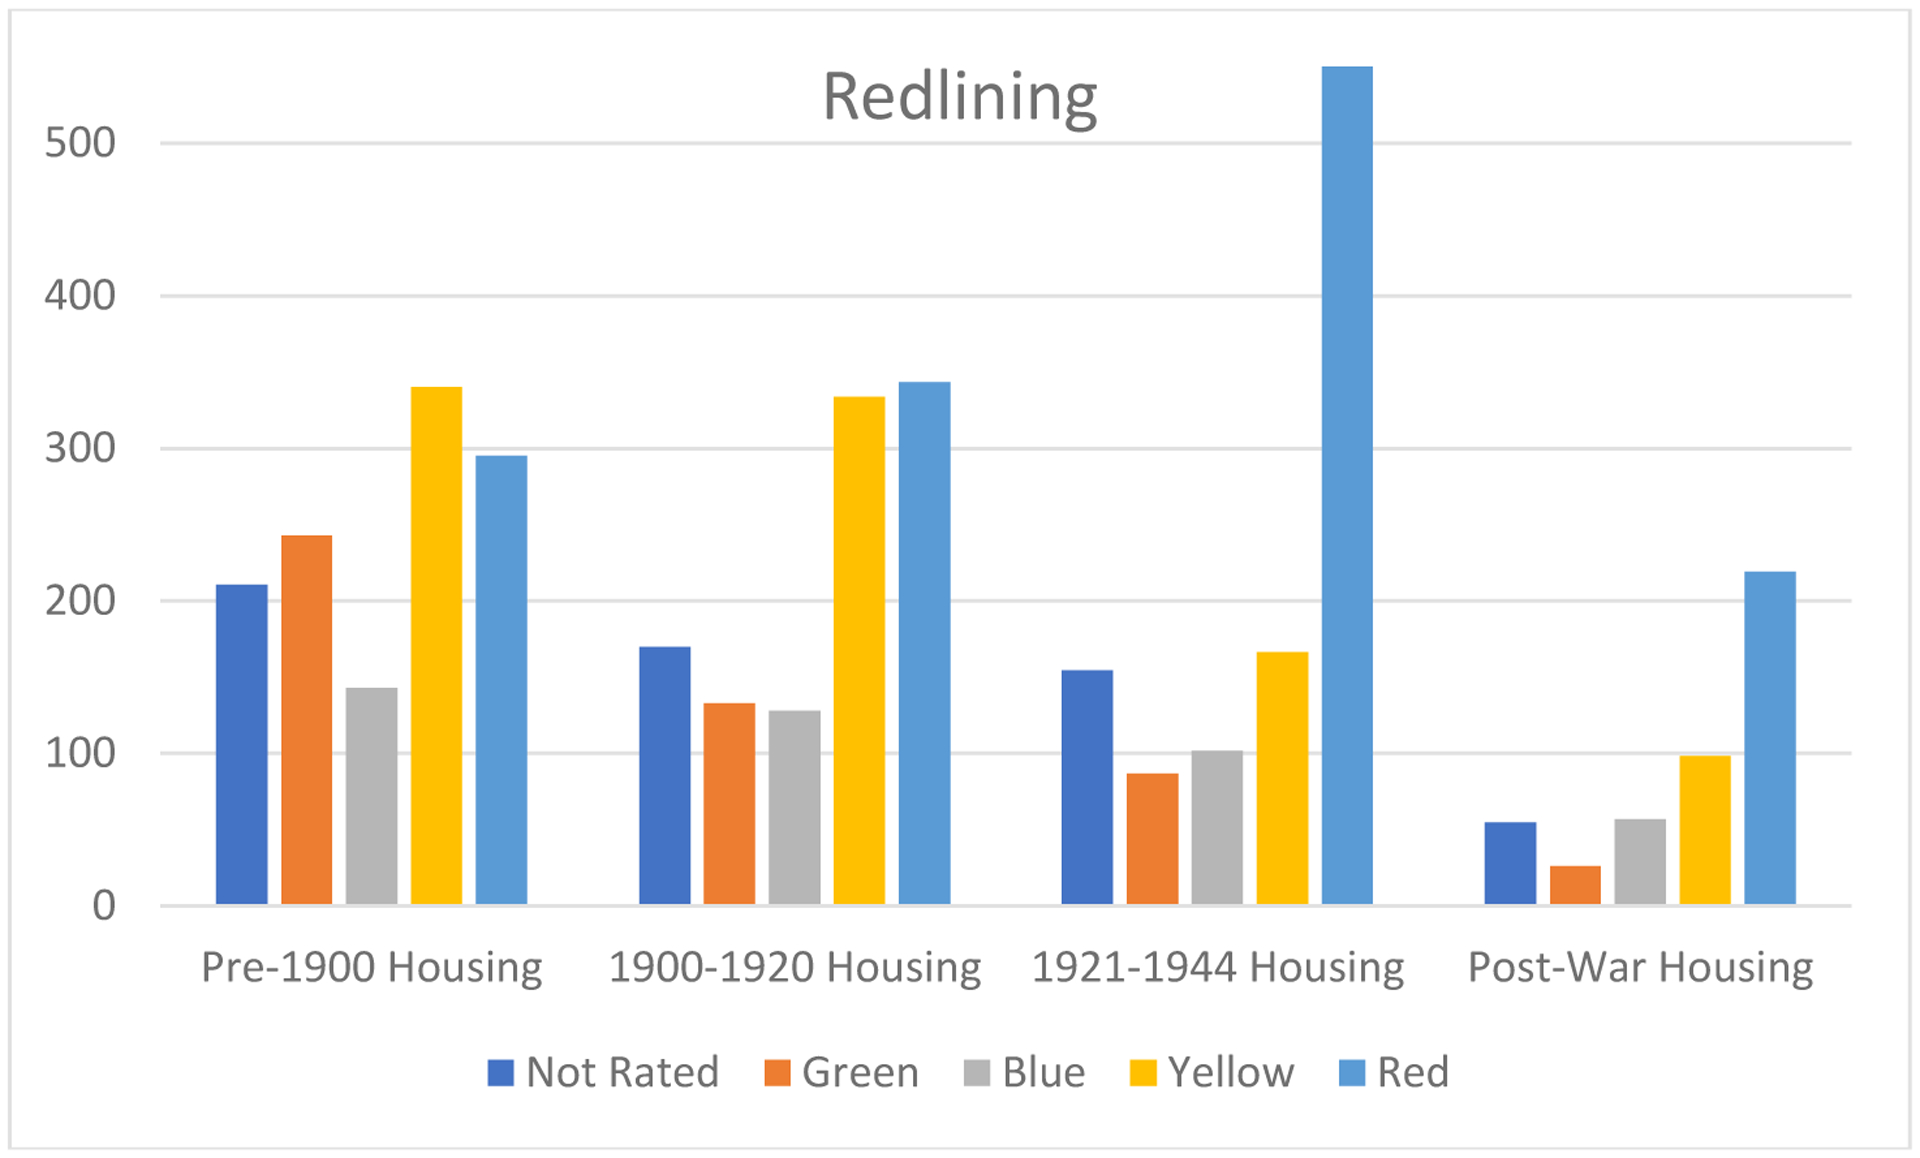
Neighborhood-Level HFAI Scores Stratified by Redlining Classification and House Age
Blockbusting exhibits a different pattern with respect to HFAI scores (Chart 2). While all inter-war and post-war housing has low HFAI scores, significant disparities can be seen between older neighborhoods with very high rates of blockbusting and other neighborhoods.
Chart 2.
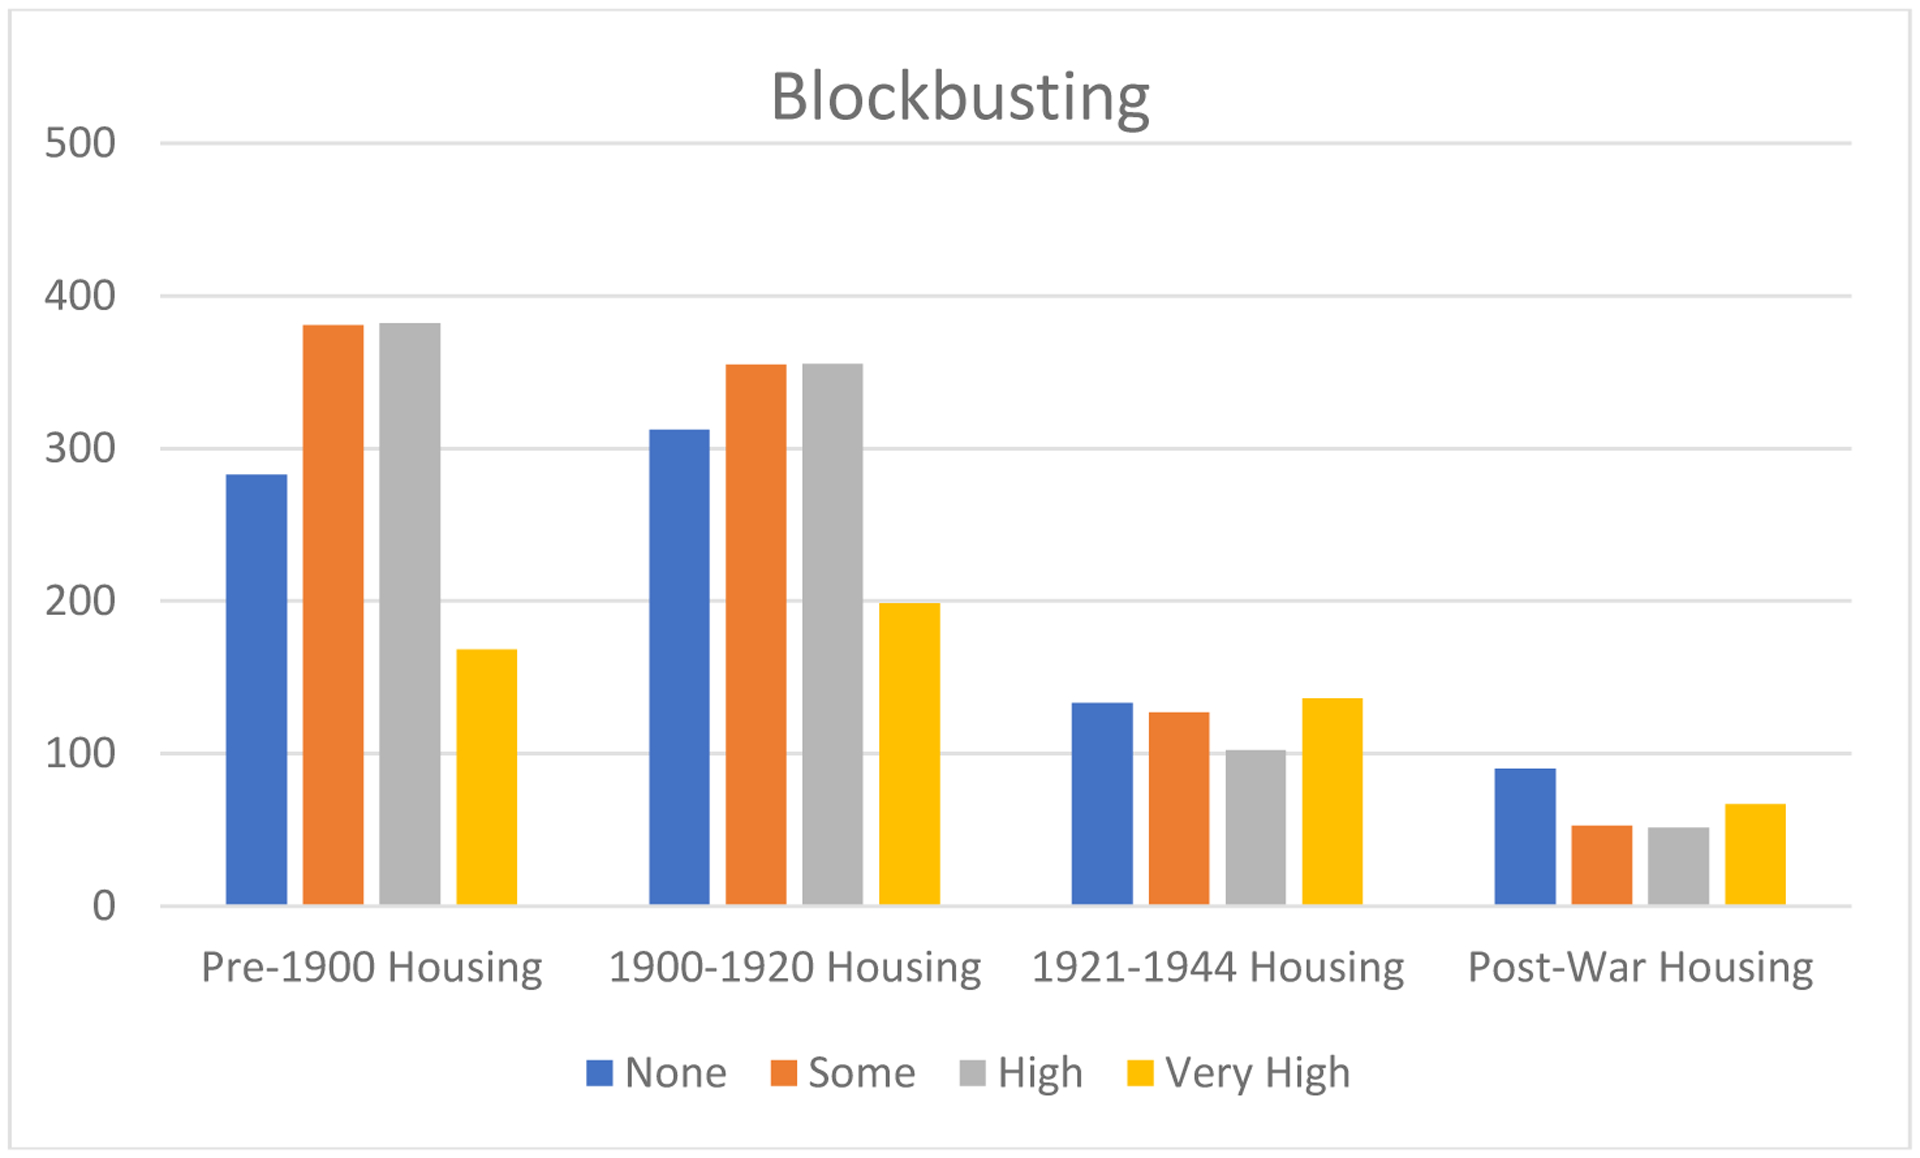
Neighborhood-Level HFAI Scores Stratified by Blockbusting Classification and House Age
Gentrification also leads to a disparity with respect to HFAI scores (Chart 3). Particularly in newer housing, gentrified neighborhoods have significantly higher HFAI scores. This disparity is most pronounced for interwar housing, where HFAI scores are 2.3 times higher in gentrifying neighborhoods.
Chart 3.
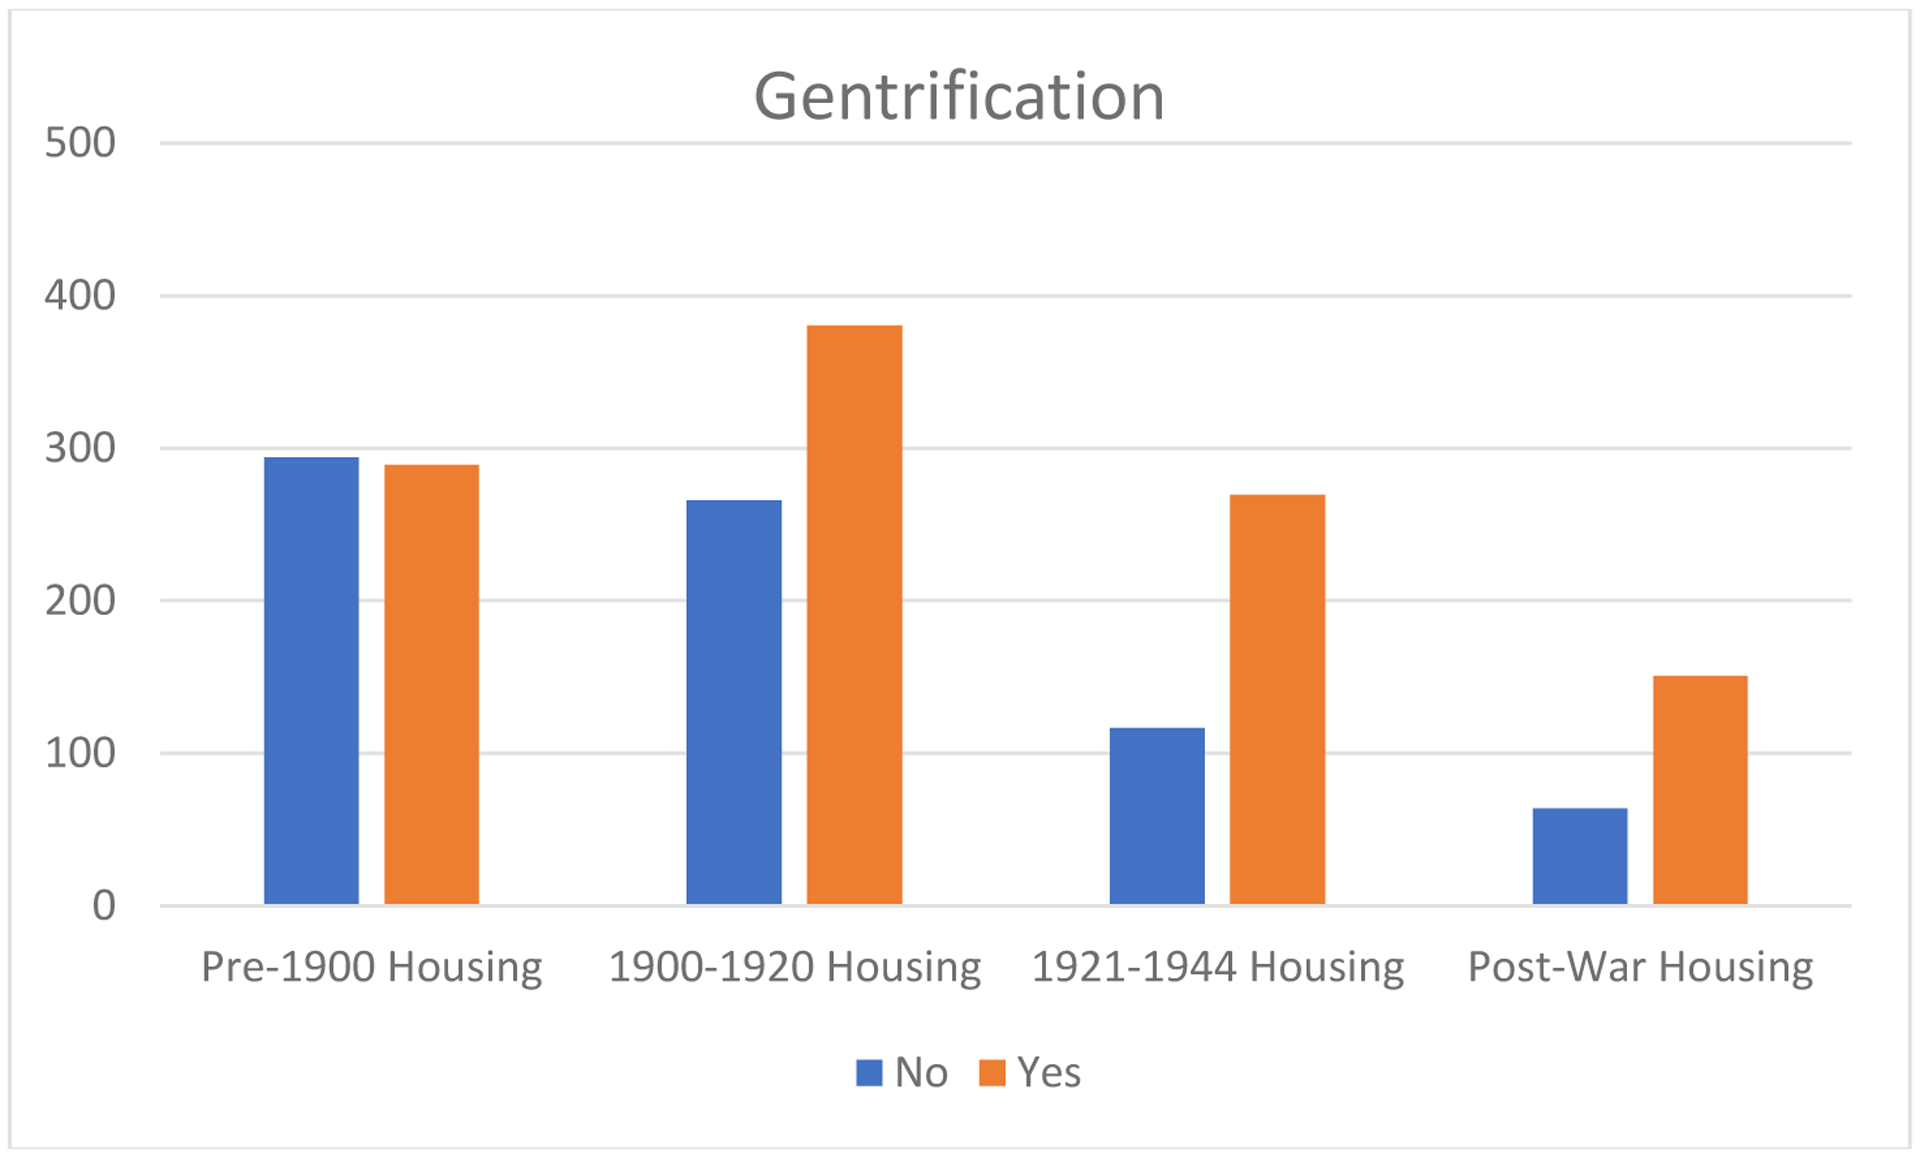
Neighborhood-Level HFAI Scores Stratified by Gentrification Classification and House Age
The results of the multivariate regression are shown in Table 1. When controlling for race, socioeconomic characteristics, and house age, clear relationships exist showing that blockbusting is negatively associated with neighborhood-level 2012 and 2016 HFAI scores, while gentrification and degrees of redlining are positively associated with these scores.
Table 1.
Regression Model Highlighting Relationships between Housing Characteristics and Neighborhood-Level HFAI Scores
| 2016 Model | 2012 Model | Difference Model | |
|---|---|---|---|
| (Intercept) | 186.79 *** (t=114.26, p = 0.00) | 146.90 *** (t=94.69, p = 0.00) | 39.72 *** (t=58.71, p = 0.00) |
| Redlining | 47.88 *** (t=42.77, p = 0.00) | 51.91 *** (t=48.87, p = 0.00) | −4.06 *** (t=−8.77, p = 0.00) |
| Blockbusting | −84.59 *** (t=−77.58, p = 0.00) | −88.71 *** (t=−85.73, p = 0.00) | 2.65 *** (t=5.88, p = 0.00) |
| Gentrification | 118.29 *** (t=103.69, p = 0.00) | 132.38 *** (t=122.29, p = 0.00) | −14.21 *** (t=−30.11, p = 0.00) |
| Percent Minority | 0.99 *** (t=56.88, p = 0.00) | 1.34 *** (t=80.73, p = 0.00) | −0.33 *** (t=−45.54, p = 0.00) |
| Socioeconomic Distress | 76.16 *** (t=94.66, p = 0.00) | 65.24 *** (t=85.44, p = 0.00) | 11.02 *** (t=33.11, p = 0.00) |
| House Age (19001920) | 3.47 ** (t=2.75, p = 0.01) | −4.00 *** (t=−3.34, p = 0.00) | 6.81 *** (t=13.05, p = 0.00) |
| House Age (19211945) | −111.58 *** (t=−79.87, p = 0.00) | −107.00 *** (t=−80.71, p = 0.00) | −4.64 *** (t=−8.03, p = 0.00) |
| House Age (1946-present) | −181.63 *** (t=−132.85, p = 0.00) | −167.62 *** (t=−129.19, p = 0.00) | −11.41 *** (t=−20.17, p = 0.00) |
| N | 178671 | 178671 | 178671 |
| R2 | 0.38 | 0.39 | 0.03 |
p < 0.001;
p < 0.01;
p < 0.05.
The categorical variable of redlining suggests that, for each increasing category (green to blue to yellow to red), neighborhood-level HFAI scores increase 48 (in 2016) and 52 points (in 2012). Likewise, gentrified neighborhoods have neighborhood-level HFAI scores 118 and 133 points higher than non-gentrified neighborhoods (for 2016 and 2012). Only in the case of blockbusting does a negative relationship occur: blockbusted neighborhoods have scores 85 and 89 points lower than non-blockbusted neighborhoods.
Generally, minority racial composition predicts higher neighborhood-level HFAI scores, though much of this may be attributable to house age. When compared to the anchor house age of <1900, newer housing tends to have lower scores, especially housing built after 1920. Likewise, socioeconomic distress is correlated to neighborhood-level HFAI scores such that for each increase of 1 in the index score, neighborhood-level HFAI scores go up 76 and 65 points.
5. Discussion
Investigations of the explicit spatial patterns of historical and contemporary housing inequalities remain underdeveloped. This study is one of the first to create multiple designations for such phenomena. In particular, the expansion of the blockbusting measure developed by Sadler and Lafreniere (2017) is an important development. Housing, urban development, and health equity literature have recently begun speaking more of the effects of redlining, or of environmental racism more broadly (Krieger et al., 2020). But—particularly given the strong association between blockbusting and poor food access—more attention should be paid to this metric. It measures the effects of more recent disinvestment patterns; ones not governed as explicitly by Fair Housing. As such, their proliferation is more likely to recur than what happened during the period of redlining.
More importantly, this is the first study to explicitly link these patterns with objective measurements of food access. By linking these important housing measures to a tangible health determinant (e.g. healthy food access), we bring to bear the potential negative health outcomes of blockbusting in particular.
The major findings of this paper are thus: 1) blockbusting, rather than redlining, is a key determinant of housing discrimination that shapes poor food access; 2) the presence of blockbusting and gentrification are often mutually exclusive, and gentrifying neighborhoods therefore often have better food access. With respect to redlining in particular, the overall pattern of higher HFAI scores in formerly redlined areas is noteworthy. Advocacy has attempted to address the historical injustices perpetrated on people who lived in redlined neighborhoods. Yet contemporary settlement patterns suggest the people who suffered may no longer be in those areas. Further advocacy of the sort that aims to address predatory lending and racial steering is all the more important light of these findings (Mock, 2015).
In concert with the finding that redlined neighborhoods often had better HFAI scores, another critical finding relates to the presence of blockbusting in older housing. Among neighborhoods with homes built before 1920, a very high rate of blockbusting predicted significantly lower HFAI scores. This very likely correlates with the fact that neighborhoods that experienced blockbusting and white flight frequently have not rebounded from this massive disinvestment. The patterns seen above relating to better HFAI scores in redlined neighborhoods and poorer HFAI scores in blockbusted neighborhoods may be underlain by the more fundamental concept of gentrification. In contrast to what might have been expected, older parts of Baltimore often have higher HFAI scores, at least when they are in gentrifying neighborhoods.
Further, low-scoring areas in Figure 2 are coincident with the HFPAs identified in the CLF’s report. That is, the HFPAs identified as those most in need based not only on food access but socioeconomic status line up closely with the areas with the statistically poorest food access. This further validates the use of CLF’s measure for describing areas in need of attention from the food system, considering that—no matter how neighborhood-level food access is measured—these areas consistently appear at the bottom.
5.1. Policy Implications
The findings presented in this paper should re-shape the direction of advocacy in discussions of food access and health equity. The historical processes that made housing more difficult or impossible for minority populations to afford are a key determinant of health disparities (Ramaswamy and Kelly, 2015; Osypuk and Acevedo-Garcia, 2010). And while redlining was a critical factor in shaping life course health among African Americans throughout the 20th century, this study suggests that blockbusting may be having a larger effect on the contemporary landscape. Without explicit consideration and interrogation of the ways neighborhoods were irrevocably altered via these patterns of disinvestment, gentrification runs the risk of repeating the disinvestment patterns from other neighborhoods, and it will be more difficult to implement equitable redevelopment.
These methods should be replicated widely, so that cities can make use of the knowledge that contemporary disinvestment/reinvestment patterns might be having negative impacts on food environments in their communities. This information is valuable to those working in housing development, food systems/food justice, health equity, and urban planning. Without coordinated efforts by a diverse range of partners, translating these findings into more equitable patterns of urban development will be more difficult.
5.2. Limitations
We acknowledge some limitations in our study. First, we used the case of Baltimore, thus it is unclear whether these patterns would exist/persist in other places. We therefore recommend further inquiry into these potential patterns across the US by replicating these methods with larger datasets for which health determinants or outcomes are available en masse (i.e. via the use of 500 Cities Project) (Fitzpatrick et al., 2018).
Second, we are among the first to create an operational GIS-based definition of blockbusting for the sake of research (following Sadler and Lafreniere, 2017). As such, it is unclear whether this measure accurately represents the disinvestment pattern we are intending to approximate. Further refinement of this measure could enhance the meaningfulness of such work.
Third, we acknowledge the limitations with using only a neighborhood-level food access score. Despite using a high-quality, reliable indicator (the HFAI), the quality, affordability, and availability of products in stores in a community are not the lone determinant of diet. Further work should, therefore, be conducted linking dietary patterns of residents to indicators like the HFAI; and in particular, in blockbusted versus gentrified neighborhoods.
5.3. Conclusion
Ultimately, we believe this work is of value for people working toward eliminating disparities in access to fair housing and healthy food, and in the realm of health equity more generally. Identifying and naming the processes that most impact upon our residents (in this case, blockbusting) will make the path toward health equity easier, because we will be able to focus more explicitly on the features of the built environment that require our most immediate attention. By advocating for and doing further work linking historical and contemporary patterns of housing discrimination to contemporary food environments, we address an underlying determinant that, up to now, was not critically examined in the literature on housing or food systems.
Acknowledgements
The lead author was supported by a Bloomberg Fellowship from the Bloomberg American Health Initiative at Johns Hopkins Bloomberg School of Public Health. Funding was provided by a grant from the National Institute on Alcohol Abuse and Alcoholism grant number R21AA026674. The authors wish to thank Caitlin Misiaszek, Anne Palmer, and Jamie Harding at the Center for a Livable Future for use of their data and support of this project, as well as Holly Freishtat, Sarah Buzogany, and Alice Huang at the Baltimore Food Policy Initiative for their advice and engagement on policy discussions.
Footnotes
Publisher's Disclaimer: This is a PDF file of an unedited manuscript that has been accepted for publication. As a service to our customers we are providing this early version of the manuscript. The manuscript will undergo copyediting, typesetting, and review of the resulting proof before it is published in its final form. Please note that during the production process errors may be discovered which could affect the content, and all legal disclaimers that apply to the journal pertain.
Contributor Information
Dr. Richard C. Sadler, Division of Public Health/Department of Family Medicine, Michigan State University.
Dr. Usama Bilal, Department of Epidemiology and Biostatistics, Drexel University.
Dr. C. Debra Furr-Holden, Division of Public Health, Michigan State University.
References
- Alkon AH, & Cadji J (2020). Sowing seeds of displacement: gentrification and food justice in Oakland, CA. International Journal of Urban and Regional Research, 44(1), 108–123. [Google Scholar]
- Appel I, & Nickerson J (2016). Pockets of poverty: The long-term effects of redlining. Available at SSRN 2852856. [Google Scholar]
- Baltimore City (2020). Baltimore City Open GIS. Retrieved from: http://gis-baltimore.opendata.arcgis.com/.
- Baltimore City Health Department (2017). Neighborhood Health Profile Reports. Retrieved from: https://health.baltimorecity.gov/neighborhoods/neighborhood-health-profile-reports. [Google Scholar]
- Biehl E, Buzogany S, Baja K, & Neff RA (2018). Planning for a resilient urban food system: A case study from Baltimore City, Maryland. Journal of Agriculture, Food Systems, and Community Development, 8(B), 39–53. [Google Scholar]
- Bilal U (2016). The long shadow of redlining on the food system. Center for a Livable Future, July 8 Retrieved from http://livablefutureblog.com/2016/07/redlining-food-system. [Google Scholar]
- Blanck HM, & Kim SA (2012). Creating supportive nutrition environments for population health impact and health equity: an overview of the Nutrition and Obesity Policy Research and Evaluation Network’s efforts. American Journal of Preventive Medicine, 43(3), S85–S90. [DOI] [PubMed] [Google Scholar]
- Blitstein JL, Snider J, & Evans WD (2012). Perceptions of the food shopping environment are associated with greater consumption of fruits and vegetables. Public Health Nutrition, 15(6), 1124–1129. [DOI] [PubMed] [Google Scholar]
- Braveman P, Arkin E, Orleans T, Proctor D, Acker J, & Plough A (2018). What is health equity? Behavioral Science & Policy, 4(1), 1–14. [Google Scholar]
- Brown L (2016a). Protect whose house: how Baltimore leaders failed to further affordable and fair housing in port Covington. University of Baltimore Journal of Land and Development, 6, 161. [Google Scholar]
- Brown L (2016b). Two Baltimores: The White L Vs. The Black Butterfly, In the Baltimore Sun, June 28 Retrieved from: https://www.baltimoresun.com/citypaper/bcpnews-two-baltimores-the-white-l-vs-the-black-butterfly-20160628-htmlstory.html. [Google Scholar]
- Callies DL, & Simon DB (2017). Fair Housing, Discrimination and Inclusionary Zoning in the United States. Journal of International & Comparative Law, 4, 39. [Google Scholar]
- Cameron N, Amrhein CG, Smoyer-Tomic KE, Raine KD, & Chong LY (2010). Cornering the market: restriction of retail supermarket locations. Environment and Planning C: Government and Policy, 28(5), 905–922. [Google Scholar]
- Cleary R, Bonanno A, Chenarides L, & Goetz SJ (2018). Store profitability and public policies to improve food access in non-metro US counties. Food Policy, 75, 158–170. [Google Scholar]
- Cohn A (2009). Fair Housing Testing. The Urban Lawyer, 41, 273. [Google Scholar]
- Deener A (2017). The origins of the food desert: Urban inequality as infrastructural exclusion. Social Forces, 95(3), 1285–1309. [Google Scholar]
- Deskins DR Jr (1972). Race, residence, and workplace in Detroit, 1880 to 1965. Economic Geography, 48(1), 79–94. [Google Scholar]
- Dixon J, Omwega AM, Friel S, Burns C, Donati K, & Carlisle R (2007). The health equity dimensions of urban food systems. Journal of Urban Health, 84(1), 118–129. [DOI] [PMC free article] [PubMed] [Google Scholar]
- Dunkley B, Helling A, and Sawicki D (2004). Accessibility versus scale: Examining the tradeoffs in grocery stores. Journal of Planning Education and Research, 23(4), 387–401. [Google Scholar]
- Ellickson PB (2016). The evolution of the supermarket industry: from A & P to Walmart In Handbook on the Economics of Retailing and Distribution. Edward Elgar Publishing. [Google Scholar]
- Eisenhauer E (2001). In poor health: Supermarket redlining and urban nutrition. GeoJournal, 53(2), 125–133. [Google Scholar]
- Fitzpatrick KM, Shi X, Willis D, & Niemeier J (2018). Obesity and place: Chronic disease in the 500 largest US cities. Obesity Research & Clinical Practice, 12(5), 421–425. [DOI] [PubMed] [Google Scholar]
- Frank L, Glanz K, McCarron M, Sallis J, Sealens B, & Chapman J (2006). The spatial distribution of food outlet type and quality around schools in differing built environment and demographic contexts. Berkeley Planning Journal, 19(1). [Google Scholar]
- Gittelsohn J, Song HJ, Suratkar S, Kumar MB, Henry EG, Sharma S, … & Anliker JA (2010). An urban food store intervention positively affects food-related psychosocial variables and food behaviors. Health Education & Behavior, 37(3), 390–402. [DOI] [PubMed] [Google Scholar]
- Gittelsohn J, Dennisuk LA, Christiansen K, Bhimani R, Johnson A, Alexander E, … & Coutinho AJ (2013). Development and implementation of Baltimore Healthy Eating Zones: a youth-targeted intervention to improve the urban food environment. Health Education Research, 28(4), 732–744. [DOI] [PMC free article] [PubMed] [Google Scholar]
- Glanz K, Sallis JF, Saelens BE, & Frank LD (2007). Nutrition Environment Measures Survey in stores (NEMS-S): development and evaluation. American Journal of Preventive Medicine, 32(4), 282–289. [DOI] [PubMed] [Google Scholar]
- Hartnett JJ (1993). Affordable Housing, Exclusionary Zoning, and American Apartheid: Using Title VIII to Foster Statewide Racial Integration. NYUL Review, 68, 89. [Google Scholar]
- Highsmith AR (2009). Demolition means progress: urban renewal, local politics, and state-sanctioned ghetto formation in Flint, Michigan. Journal of Urban History, 35(3), 348–368. [Google Scholar]
- Hippensteel CL, Sadler RC, Milam AJ, Nelson V, & Furr-Holden CD (2019). Using zoning as a public health tool to reduce oversaturation of alcohol outlets: An examination of the effects of the New “300 Foot Rule” on packaged goods stores in a Mid-Atlantic City. Prevention Science, 20(6), 833–843. [DOI] [PMC free article] [PubMed] [Google Scholar]
- Hoalst-Pullen N, Patterson MW, & Gatrell JD (2011). Empty spaces: Neighbourhood change and the greening of Detroit, 1975–2005. Geocarto International, 26(6), 417–434. [Google Scholar]
- Jones K, and Simmons J (1990). The Retail Environment. Routledge: London. [Google Scholar]
- Kmiec DW (1986). Exclusionary zoning and purposeful racial segregation in housing: Two wrongs deserving separate remedies. The Urban Lawyer, 393–422. [Google Scholar]
- Krieger N, Wright E, Chen JT, Waterman PD, Huntley ER, & Arcaya M (2020). Cancer Stage at Diagnosis, Historical Redlining, and Current Neighborhood Characteristics: Breast, Cervical, Lung, and Colorectal Cancer, Massachusetts, 2001–2015. American Journal of Epidemiology. [DOI] [PMC free article] [PubMed] [Google Scholar]
- Lang RE (2000). Did neighborhood life-cycle theory cause urban decline? Housing Policy Debate, 11(1), 1–6. [Google Scholar]
- Lavin M (2000). Problems and opportunities of retailing in the US “Inner City”. Journal of Retailing and Consumer Services, 7, 47–57. [Google Scholar]
- Ley D (1986). Alternative explanations for inner-city gentrification: a Canadian assessment. Annals of the Association of American Geographers, 76(4), 521–535. [Google Scholar]
- Liebmann GW (1990). Suburban Zoning-Two Modest Proposals. Real Property, Probate, and Trust Journal, 25, 1. [Google Scholar]
- Logan JR, Stults BJ, & Xu Z (2016). Validating population estimates for harmonized census tract data, 2000–2010. Annals of the American Association of Geographers, 106(5), 1013–1029. [DOI] [PMC free article] [PubMed] [Google Scholar]
- Logan JR, Xu Z, & Stults BJ (2014). Interpolating US decennial census tract data from as early as 1970 to 2010: A longitudinal tract database. The Professional Geographer, 66(3), 412–420. [DOI] [PMC free article] [PubMed] [Google Scholar]
- Lytle LA (2009). Measuring the food environment: state of the science. American Journal of Preventive Medicine, 36(4), S134–S144. [DOI] [PMC free article] [PubMed] [Google Scholar]
- Manville M, Monkkonen P, & Lens M (2020). It’s Time to End Single-Family Zoning. Journal of the American Planning Association, 86(1), 106–112. [Google Scholar]
- Massey DS, & Rugh JS (2017). Zoning, affordable housing, and segregation in US metropolitan areas. The fight for fair housing: Causes, consequences, and future implications of the 1968 Federal Fair Housing Act, 245–264. [Google Scholar]
- Massey DS, & Tannen J (2015). A research note on trends in black hypersegregation. Demography, 52(3), 1025–1034. [DOI] [PMC free article] [PubMed] [Google Scholar]
- McKinnon RA, Reedy J, Morrissette MA, Lytle LA, & Yaroch AL (2009). Measures of the food environment: a compilation of the literature, 1990–2007. American Journal of Preventive Medicine, 36(4), S124–S133. [DOI] [PubMed] [Google Scholar]
- Metzger JT (2000). Planned abandonment: The neighborhood life-cycle theory and national urban policy. Housing Policy Debate, 11(1), 7–40. [Google Scholar]
- Misiaszek C, Buzogany S, & Freishtat H (2018). Baltimore City’s food environment: 2018 report. Retrieved from: https://www.jhsph.edu/research/centers-and-institutes/johns-hopkins-center-for-a-livable-future/research/clf_publications/pub_rep_desc/bal. [Google Scholar]
- Misiaszek C, Kvit A, Burns C, Harding J, Buczynski A, Freishtat H, … & Palmer A (2019). Reliability of an Audit Tool to Measure Healthy Food Availability in Food Outlets across Baltimore City. Journal of Hunger & Environmental Nutrition, 1–15. [Google Scholar]
- Mock B, (2015). Redlining is Alive and Well—and Evolving. CityLab. Retrieved from: https://www.citylab.com/equity/2015/09/redlining-is-alive-and-welland-evolving/407497/. [Google Scholar]
- Morland K, Wing S, & Roux AD (2002). The contextual effect of the local food environment on residents’ diets: the atherosclerosis risk in communities study. American Journal of Public Health, 92(11), 1761–1768. [DOI] [PMC free article] [PubMed] [Google Scholar]
- Nelson RK, Winling L, Marciano R, Connolly N, et al. (2020). Mapping Inequality, Redlining in New Deal America. Retrieved from: https://dsl.richmond.edu/panorama/redlining/.
- Northridge ME, & Freeman L (2011). Urban planning and health equity. Journal of Urban Health, 88(3), 582–597. [DOI] [PMC free article] [PubMed] [Google Scholar]
- Orser WE (2015). Blockbusting in Baltimore: The Edmondson Village Story. University Press of Kentucky. [Google Scholar]
- Osypuk TL, & Acevedo-Garcia D (2010). Beyond individual neighborhoods: a geography of opportunity perspective for understanding racial/ethnic health disparities. Health & Place, 16(6), 1113–1123. [DOI] [PMC free article] [PubMed] [Google Scholar]
- Pampalon R, Hamel D, Gamache P, & Raymond G (2009). A deprivation index for health planning in Canada. Chronic Diseases in Canada, 29(4), 178–91. [PubMed] [Google Scholar]
- Pattison TJ (1977). The process of neighborhood upgrading and gentrification: an examination of two neighborhoods in the Boston metropolitan area (Doctoral dissertation, Massachusetts Institute of Technology; ). [Google Scholar]
- Power G (1983). Apartheid Baltimore style: The residential segregation ordinances of 1910–1913. Maryland Law Review, 42, 289. [Google Scholar]
- Ramaswamy M, & Kelly PJ (2015). Institutional racism as a critical social determinant of health. Public Health Nursing, 32(4), 285–286 [DOI] [PubMed] [Google Scholar]
- Ransom MM, Greiner A, Kochtitzky C, & Major KS (2011). Pursuing health equity: zoning codes and public health. The Journal of Law, Medicine, and Ethics, 39(1_suppl), 94–97. [DOI] [PubMed] [Google Scholar]
- Richardson J, Mitchell B, & Franco J, (2019). Shifting Neighborhood: Gentrification and cultural displacement in American Cities. National Community Reinvestment Coalition; Retrieved from: https://ncrc.org/gentrification/. [Google Scholar]
- Rossen LM, & Pollack KM (2012). Making the connection between zoning and health disparities. Environmental Justice, 5(3), 119–127. [Google Scholar]
- Russell SE, & Heidkamp CP (2011). ‘Food desertification’: The loss of a major supermarket in New Haven, Connecticut. Applied Geography, 31(4), 1197–1209. [Google Scholar]
- Sadler RC, Gilliland JA, & Arku G (2011). An application of the edge effect in measuring accessibility to multiple food retailer types in Southwestern Ontario, Canada. International Journal of Health Geographics, 10(1), 34. [DOI] [PMC free article] [PubMed] [Google Scholar]
- Sadler RC, & Lafreniere DJ (2017). Racist housing practices as a precursor to uneven neighborhood change in a post-industrial city. Housing Studies, 32(2), 186–208. [Google Scholar]
- Sallis JF, & Glanz K (2006). The role of built environments in physical activity, eating, and obesity in childhood. The Future of Children, 89–108. [DOI] [PubMed] [Google Scholar]
- Santo R, Yong R, & Palmer A (2014). Collaboration meets opportunity: The Baltimore Food Policy Initiative. Journal of Agriculture, Food Systems, and Community Development, 4(3), 193–208. [Google Scholar]
- Sbicca J, & Myers JS (2017). Food justice racial projects: Fighting racial neoliberalism from the Bay to the Big Apple. Environmental Sociology, 3(1), 30–41. [Google Scholar]
- Scanlon KA (1984). A Report on the Committee’s Fair Housing Project 1975–1983. Howard Law Journal, 27, 1457. [Google Scholar]
- Shaver ER, Sadler RC, Hill AB, Bell K, Ray M, Choy-Shin J, … & Jones AD (2018). The Flint Food Store Survey: combining spatial analysis with a modified Nutrition Environment Measures Survey in Stores (NEMS-S) to measure the community and consumer nutrition environments. Public Health Nutrition, 21(8), 1474–1485. [DOI] [PMC free article] [PubMed] [Google Scholar]
- Smith N (1982). Gentrification and uneven development. Economic Geography, 58(2), 139–155. [Google Scholar]
- Squires GD, & Kubrin CE (2005). Privileged places: Race, uneven development and the geography of opportunity in urban America. Urban Studies, 42(1), 47–68. [Google Scholar]
- Stephens HM, & Partridge MD (2015). Lake amenities, environmental degradation, and great lakes regional growth. International Regional Science Review, 38(1), 61–91. [Google Scholar]
- Sugrue TJ (2014). The Origins of the Urban Crisis: Race and Inequality in Postwar Detroit. Princeton University Press. [Google Scholar]
- Wyly EK, & Hammel DJ (2004). Gentrification, segregation, and discrimination in the American urban system. Environment and Planning A, 36(7), 1215–1241. [Google Scholar]
- Zuk M, Bierbaum AH, Chapple K, Gorska K, Loukaitou-Sideris A, Ong P, & Thomas T (2015, August). Gentrification, displacement and the role of public investment: a literature review. In Federal Reserve Bank of San Francisco (Vol. 79). [Google Scholar]
- Zunz O (1977). The organization of the American city in the late nineteenth century: ethnic structure and spatial arrangement in Detroit. Journal of Urban History, 3(4), 443–466. [Google Scholar]