

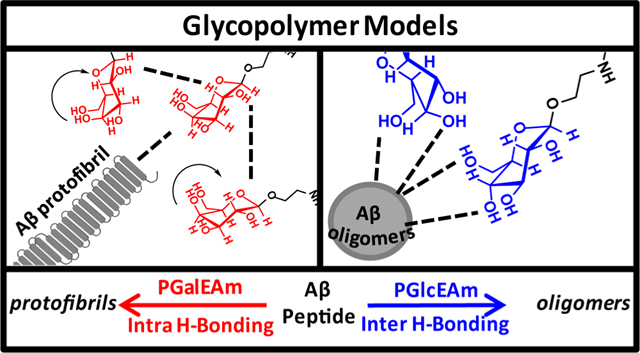
Graphical abstract
Saccharide stereochemistry plays an important role in carbohydrate functions such as biological recognition processes and protein binding. Synthetic glycopolymers with pendant sacchaxsrides of controlled stereochemistry provide an attractive approach for the design of polysaccharide-inspired biomaterials. Acrylamide-based polymers containing either β,D-glucose or β,D-galactose pendant groups, designed to mimic GM1 ganglioside saccharides, and their small-molecule analogues were used to evaluate the effect of stereochemistry on glycopolymer solution aggregation processes alone and in the presence of Aβ42 peptide using dynamic light scattering, gel permeation chromatography–multiangle laser light scattering, and fluorescence assays. Fourier transform infrared and nuclear magnetic resonance (NMR) were employed to determine hydrogen bonding patterns of the systems. The galactose-containing polymer displayed significant intramolecular hydrogen bonding and self-aggregation and minimal association with Aβ42, while the glucose-containing glycopolymers showed intermolecular interactions with the surrounding environment and association with Aβ42. Saturation transfer difference NMR spectroscopy demonstrated different binding affinities for the two glycopolymers to Aβ42 peptide.
INTRODUCTION
Glycopolymers, or synthetic polymers inspired by polysaccharides with pendant saccharide groups rather than glycosidic linkages in the backbone, have gained enormous attention for their potential in biomedical applications. Glycopolymers have been shown to improve the biocompatibility of various materials, such as surface modification of carbon nanotubes or polymerization from metal surfaces by increasing surface hydrophilicity.1–3 Their biocompatibility makes glycopolymers ideal candidates for drug and gene delivery, where glycopolymers have been incorporated as the hydrophilic component of block copolymers for self-assembly into nanoparticles for in vitro drug release.4–6 Recently, it has been demonstrated that incorporation of glycomonomers with cationic comonomers has the potential to improve biocompatibility and binding characteristics of copolymers designed for gene delivery7,8 and antimicrobial applications.9
Because the pendant saccharide groups are multivalent ligands, glycopolymers mimic the “glycocluster effect”, which allows for molecular interactions with cells, viruses, and proteins.10 Glycopolymers containing trisaccharide and hapten pendant groups were reported to have a specific interaction with B cell antigen receptors, activating B cell signaling.11 Additionally, glycopolymers, because of their ability to reduce ice crystal growth, have been added to cell suspension storage solutions to prevent cell damage upon thawing.12 Through bioconjugation, glycopolymers have been shown to stabilize proteins in storage conditions against thermal, acidic, or lyophilization stresses.13–15 Glycopolymers also have been shown to selectively bind to proteins, such as lectins, through non-covalent interactions.16 Lectins and other proteins recognize oligosaccharides through patterns associated with stereochemistry and anomeric linkages;17,18 therefore, it is of interest to understand the effect of pendant saccharide identity on glycopolymer binding interactions.
Sun et al.19 reported for diblock polymers containing glycopolymers with pendant groups of either α-glucose, β-glucose, α-mannose, or α-galactose that the anomeric carbon and stereochemistry of the saccharide had direct implications on the binding affinity with the lectin concanavalin A (Con A). Binding occurred between Con A and α-glucose/mannose but not with α-galactose/β-glucose, regardless of the fact that they are stereoisomers. Additionally, the role of stereochemistry on DNA binding for polymers containing cationic and acyclic saccharide moieties of either meso-galactaramide, D-glucaramide, D-mannaramide, or L-tartaramide was investigated, and it was found that the nature of the saccharide influenced the extent of hydrogen bonding and subsequent binding strength with DNA.20 Madeira do O et al.21 also studied the influence of mannose, galactose, arabinose, N-acetyl glucosamine, lactose, and trehalose glycopolymer pendant groups on monoclonal antibody (mAb) structural stability and aggregation behavior. It was found that the effects on mAb conformation, stability, and aggregation behavior were directly dependent on the saccharide pendant group, where glycopolymers containing di- and trisaccharide pendant groups had the greatest stabilizing effects on protein behavior. These reports have shown that saccharide identity directly influences glycopolymer binding ability to various proteins, but the specific impact of stereochemistry of the pendant group in relation to hydrogen bonding patterns is not well understood.
We reported substantial differences in the assembly processes of amyloid β (Aβ), a peptide implicated in the progression of Alzheimer’s disease,22,23 in the presence of glycopolymers with β,D-galactose (PGalEAm) or β,D-glucose (PGlcEAm) pendant groups of low and high molecular weights.24 The glycopolymers were designed to mimic saccharides of the GM1 ganglioside, which is known to strongly promote Aβ aggregation.25 The two pendant groups differ only in the stereochemistry of the C4 hydroxyl (Figure 1), but Aβ oligomers were observed when the peptide was blended with high-molecular-weight glucose-containing glycopolymer, whereas fibrils were formed in the presence of high–molecular-weight galactose-containing glycopolymers. Similar inhibition of fibril formation was reported for sulfated glycopolymers by Miura et al.26 We hypothesized that differences in the hydrogen bonding patterns of the pendant groups affected the interactions between the peptide and the glycopolymers, which in turn resulted in the observed differences in Aβ aggregation. Rajaram et al.27 synthesized low-molecular-weight branched glycoclusters that contained either trehalose, lactose, glucose, or galactose functionalities to evaluate their impact on Aβ40 aggregation. They reported that trehalose-containing clusters retarded the formation of fibrils, whereas glucose and galactose low-molecular-weight clusters promoted fibril formation. These reports indicate that the identity of the saccharide alone is not a direct indicator of impact on Aβ aggregation, but other factors, such as the hydrogen bonding potential, stereochemistry, and molecular weight of the glycocluster, also play important roles. It is imperative to understand the interplay of these factors and how they affect the Aβ assembly processes in order to advance bioinspired models as a tool in studying proteopathic disorders.
Figure 1.

Glycopolymer structures of (A) PGalEAm and (B) PGlcEAm, which vary only in the stereochemistry at the C4-OH site.
The saccharide moiety can influence glycopolymer aggregation as well. Mees et al.28 synthesized poly(2-ethyl-2-oxazoline) glycopolymers containing either acyclic glucose or maltose pendant groups and observed that, whereas glucose-containing glycopolymers aggregated, maltose-containing glycopolymers did not. Liang et al.29 reported that aggregation of acrylate-based glycopolymers containing a β,D-glucose pendant group occurred through a combination of hydrophobic association of the polymer backbone and hydrogen bonding involving the saccharide moiety. The aggregates displayed a hydrophobic interior and hydrophilic exterior and were polydisperse in size. The few reports directly comparing the effect of saccharide type on glycopolymer aggregation indicate a relationship between saccharide stereochemistry and glycopolymer solution behavior.
In our previous work, we established differences in Aβ aggregation in the presence of glycopolymers related to pendant saccharide structure and polymer molecular weight. In this study, as a continuation of the research, we specifically examine the hydrogen bonding patterns of high-molecular-weight glycopolymers with β,D-galactose and β,D-glucose pendant groups in relation to those of small-molecule analogues via nuclear magnetic resonance (NMR) and Fourier transform infrared (FTIR) with the goal of improving mechanistic understanding of the effects of hydrogen bonding potential, molecular weight, and saccharide pendant group stereochemistry on glycopolymer solution behavior. Complementary techniques, including variable temperature, rotating-frame Overhauser effect, and saturation transfer difference NMR spectroscopy, are employed to identify differences in inter- and intramolecular binding and the potential to impact the Aβ assembly processes. Glycopolymer aggregation alone and in the presence of Aβ peptide is evaluated via dynamic light scattering (DLS), gel permeation chromatography–multiangle laser light scattering (GPC-MALLS), and 8-anilinonaphthalene-1-sulfonic acid (ANS) fluorescence spectroscopy. Determining solution behavior as a function of structure in well-characterized systems will provide foundational information for the design of glycopolymers for biorecognition and specific binding interactions.
EXPERIMENTAL SECTION
Materials.
Dimethyl sulfoxide-d6 was purchased from Cambridge Isotope Laboratories. All other solvents and reagents were purchased from ThermoFisher Scientific (USA) or Sigma-Aldrich Corporation (USA) in the highest purity available and used without further purification unless indicated otherwise. Light scattering cells were high-precision cylindrical cuvettes purchased from LS Instruments (Switzerland). GalEAm and GlcEAm monomers as well as glycopolymers containing either β,D-galactose (PGalEAm, Figure 1A) or β,D-glucose (PGlcEAm, Figure 1B) pendant groups with a degree of polymerization (DP) of 350 were synthesized as outlined in a previous study.24 A second series of glycopolymers (denoted as S2) of DP 300 was synthesized in DMSO with details for the polymerization provided in the Supporting Information. Aβ monomer was purified as reported earlier.24
Glycopolymer–Aβ Interactions.
A 25 μM solution of freshly purified Aβ monomer was co-incubated with either PGalEAm or PGlcEAm for a final glycopolymer concentration of 75 μM in a 20 mM TRIS buffer pH 8.0 with 0.01% (w/v) NaN3 at 37 °C under quiescent conditions. The reactions were monitored every 24 h by dynamic light scattering.
Dynamic Light Scattering.
Variable-angle dynamic light scattering measurements were taken with a Brookhaven Instruments BI-200SM goniometer, an avalanche photodiode detector, a TurboCorr correlator, and a Spectra Physics Model 127 HeNe laser using an incident light of 633 nm operating at 40 mW. Light scattering measurements for each sample were taken at five angular positions (60°, 75°, 90°, 105°, and 120°), where measurements from each angle contributed to the calculated diffusion coefficient (D). Normalized autocorrelation functions were obtained for each angle (Figure 2A) and converted to plots of intensity as a function of relaxation time (Figure 2A) through inverse Laplace transformation using Brookhaven CONTIN analysis software. The hydrodynamic radius (Rh) for all individual distributions present in each sample was calculated using the relaxation time (τ) associated with the maximum of each distribution. The relaxation time is inversely related to the decay rate (Γ) of the autocorrelation function by eq 1:
| (1) |
Figure 2.

Example of data obtained through light scattering method (A) autocorrelation functions, which are converted to (B) intensity vs relaxation time plots, which are used to determine the decay rates via eq 1, (C) which are plotted as a function of q2 to determine the hydrodynamic radius through eqs 2–4.
The mutual diffusion coefficient (Dm) associated with each distribution within a sample was calculated (Figure 2C) from eq 2:
| (2) |
where q2 is the square of the scalar magnitude of the scattering vector and is calculated according to eq 3:
| (3) |
The hydrodynamic radius associated with each distribution was determined from the Stokes–Einstein equation (eq 4):
| (4) |
where kB is the Boltzmann’s constant, η is the solution viscosity, T is the temperature in Kelvin, and D0 is the self-diffusion coefficient. All samples were filtered through a 0.45 μm PVDF filter directly into the scattering cells prior to incubation.
Gel Permeation Chromatography–Multiangle Laser Light Scattering (GPC-MALLS).
Weight-average and number-average molecular weight (Mw and Mn, respectively), molecular weight distribution (i.e., shape of the curve), and dispersity for the glycopolymer samples were determined using a GPC system consisting of an Agilent 1260 Infinity II system operating at 30 °C with a PL aquagel MIXED-OH column, an online multiangle laser light scattering detector operating at 653 nm (Dawn Heleos II, Wyatt Technology Inc.), and an online differential refractometer (Optilab T-rEX, Wyatt Technology Inc.). TRIS buffer pH 8.0 was used as the mobile phase at a flow rate of 0.5 mL/min with a sample concentration of 2 mg/mL and an injection volume of 50 μL. Detector signals were simultaneously recorded, and absolute molecular weights and dispersities were calculated using ASTRA 7 software (Wyatt Technology Inc.). A dn/dc value of 0.16 mL/g was used for glycopolymers in water as measured by a Reichert ARIAS 500 refractometer.
Fourier Transform Infrared Spectroscopy.
Room temperature Fourier transform infrared (FTIR) spectra were obtained using a Nicolet 8700 spectrometer equipped with Omnic software. Samples were mixed with potassium bromide (KBr) at 0.67 wt % concentration (2 mg of PGlcEAm or PGalEAm in 300 mg of KBr) and pressed into pellets. IR data were recorded at a resolution of 2 cm−1 with 128 scans accumulated for each spectrum. A nitrogen purge was applied prior to and during sample measurement to reduce CO2 interference. All sample scans were performed in triplicate.
One-Dimensional (1D) Nuclear Magnetic Resonance Spectroscopy.
Nuclear magnetic resonance (NMR) 1D and 2D spectra were obtained using a Bruker Avance III (TopSpin 3.1p17) spectrometer operating at a proton frequency of 600.13 MHz. For 1H NMR spectra, an average of 512 scans (5 s delay) were acquired for small-molecule analogues (methyl β-D-galactopyranoside and methyl β-D-glucopyranoside) and 1024 scans (1 s delay, 0.909 s acquisition) for the PGalEAm and PGlcEAm glycopolymers. An average of 1024 scans (5 s delay) for small molecules and 4096 scans (1 s delay) for glycopolymers were acquired for 13C NMR spectra. Standard pulse sequences were used to obtain 1H and 13C spectra. Samples were prepared by dissolution into DMSO-d6 followed by subsequent loading into a 5 mm NMR tube. Proton and carbon NMR spectra were internally referenced to DMSO-d6 (δ 2.5 ppm and δ 39 ppm, respectively). Variable temperature 1H NMR (VT-NMR) 1D spectra were obtained over a temperature range of 30–80 °C. Samples for VT-NMR studies were dissolved in DMSO-d6 containing 0.5% (w/v) 3-(trimethylsilyl)propane-1-sulfonic acid (DSS) standard. Proton spectra for the small-molecule analogues (methyl β-D-galactopyranoside and methyl β-D-glucopyranoside) were obtained using an overall recycle delay of 18 or 21.5 s, a 1H 90 pulse width of 11.7 μs, and an acquisition time of 2.73 s. The number of co-added scans was 16, with 2 equilibrium scans implemented prior to data acquisition. The number of FID data points was 65,536. Samples were allowed to equilibrate for approximately 10–15 min upon attaining temperature. Spectra for PGalEAm and PGlcEAm were acquired using similar conditions, only differing by the number of scans (32) and the overall recycle delays (11 s).
Rotating-Frame Overhauser Spectroscopy (ROESY).
Rotating-frame Overhauser Spectroscopy (ROESY)30 spectra were acquired on a Bruker Avance III NMR spectrometer operating at a proton frequency of 600.13 MHz and using a 5 mm BBFO probe. Samples were dissolved in DMSO-d6 and transferred into 5 mm NMR tubes for NMR analysis. The acquisition parameters were as follows: The recycle delay was 2.0 s, the 90° pulse width was 11.9 μs, the 1H spectral width in both dimensions was 11.0 ppm, and the acquisition time was 155 ms. The number of t1 increments (FIDS) was 256 with 80 scans per increment. A 6.0 kHz spin-locking field was applied for 300 ms during the mixing period. States-TPPI phase cycling was used to obtain phase-sensitive data. The number of t1 and t2 points was increased to 4096 via linear prediction and zero-filling, respectively, and sine squared apodization applied to both time dimensions prior to 2-D Fourier transformation. The F1 and F2 baselines were corrected using the ablative algorithm as implemented in the Mestrec labs MNOVA software.
Saturation Transfer Difference (STD) NMR Spectroscopy.
STD spectra31,32 were acquired on a Bruker Avance III spectrometer operating at a frequency of 600.13 MHz for proton and using a 5 mm BBFO probe. Acquisition parameters were as follows: the prescan delay was 2 s, the 1H 90° pulse width was 11.90 μs, and the acquisition time was 2.48 s. The spectral width was 11.0 ppm, with the free induction decay (FID or NMR signal) composed of 32 K digitized points. The number of interleaved scans accumulated was 512; in addition, 16 steady-state scans were applied prior to data acquisition. The selective saturation pulse was 50 ms, which was looped 40 times to yield an overall saturation time of 2 s; the carrier cycled between 3 and −30 ppm; thus, the irradiation frequencies were 3 ppm (on resonance, saturation) and −30 ppm (off resonance, no saturation). The irradiation power was approximately 40 Hz (0.1 mW); this corresponds to a 6.25 ms 90° pulse width. Water suppression was achieved via the 3–9-19 binomial pulse sequence with gradients33 using a 75.73 μs delay between pulses. Samples were prepared by dissolution into a 75:25 mixture of TRIS buffer pH 8 and D2O followed by subsequent loading into a 5 mm NMR tube. Spectra were internally referenced to D2O (δ 4.79 ppm).
ANS Fluorescence.
The fluorescence of 8-anilinonaphthalene-1-sulfonic acid (ANS) upon binding to PGlcEAm or PGalEAm was measured using a Cary Eclipse spectrometer (Varian Inc.) in scan mode. Glycopolymer samples (25–200 μM) in 20 mM TRIS buffer pH 8.00 were equilibrated for 1 min in ANS dye (100 μM) before measuring the fluorescence using an excitation wavelength of 388 nm and scanning emission between 415 and 650 nm. A total of 10 scans were averaged for each sample.
RESULTS AND DISCUSSION
Dynamic light scattering was employed to understand the time-dependent aggregation behavior of the individual glycopolymers, monomeric Aβ42 peptide control, and glycopolymer-Aβ42 co-incubations (Figure 3). The bars in the graphs represent the hydrodynamic radius (Rh) of individual size distributions measured at specific time intervals, as described in the Experimental Section. The smallest size distribution (Rh ≤ 50 nm) is attributed to non-aggregated glycopolymers and small Aβ oligomers, while larger size distributions reflect aggregates of different sizes. Upon initial dissolution, all solutions except for the neat PGlcEAm display multiple size distributions. Size distributions with larger hydrodynamic radii appear at longer time intervals, indicating increased aggregation over the 72 h incubation period.
Figure 3.

Dynamic light scattering of samples over a 72 h period with measurements taken every 24 h. Upper row: PGalEAm, PGlcEAm, and Aβ controls. Lower row: Aβ/glycopolymer blends. The presence of PGalEAm does not alter the Aβ aggregation pathway, whereas the presence of PGlcEAm promotes the formation of small Aβ aggregates.
The PGalEAm control initially exhibits two size distributions (48 and 132 nm), indicating that aggregates form immediately upon dissolution. At longer time intervals, larger hydrodynamic radii structures appear (490 nm) presumably due to intra-molecular associations within the galactose saccharide moiety causing increased aggregation. The PGlcEAm control initially shows one size distribution (20 nm), and multiple size distributions (20 and 73 nm) are not observed until 48 h. After 72 h of incubation, PGlcEAm (85 nm) displays only small size distributions (≤150 nm), indicating limited self-aggregation. Aβ42 in the absence of glycopolymer initially exhibit aggregated states (50 and 314 nm), consistent with reports by Kodali et al.,34 who attributed early formation of Aβ42 oligomers and protofibrils due to hydrogen bonding and concentration effects. After 24 h of incubation, the Aβ42 display distributions with large hydrodynamic radii (705 nm), which are likely due to the formation of protofibrils in solution.
The Aβ-PGalEAm and Aβ-PGlcEAm reactions exhibit a different aggregation behavior over time, suggesting that the glycopolymers have dissimilar binding characteristics with the Aβ42. In the presence of PGalEAm, Aβ initially displays multiple size distributions, with larger hydrodynamic radii (602 nm) appearing at longer time intervals similar to that of the Aβ control, indicating that PGalEAm does not alter the latter’s aggregation. The large Rh distributions most likely consist of a mixture of PGalEAm aggregates and Aβ protofibrils. In the presence of PGlcEAm, however, no large Rh distributions (350+ nm) are observed for Aβ over the 72 h incubation period. We attribute this change in aggregation behavior to interactions between the Aβ peptides and PGlcEAm, resulting in smaller Aβ aggregates.
These data agree with previously reported findings in our laboratories,24 where fluorescence and AFM images demonstrated that Aβ incubated with PGalEAm generated protofibrils, whereas Aβ incubated with PGlcEAm led to oligomer formation. We hypothesize that the differences in the Aβ−glycopolymer interactions between the two systems result from different hydrogen bonding patterns within the pendant saccharide moieties.
DLS was also employed in both TRIS buffer and DMSO to understand the aggregation behavior of the individual glycopolymers as a function of concentration. The bar graphs in Figure 4 show Rh values measured at different concentrations immediately after dissolution. Both glycopolymers exhibited a significant decrease in hydrodynamic size in DMSO compared to TRIS buffer. DMSO is a strong polar solvent and hydrogen-bond acceptor and has been shown to disrupt intermolecular and intramolecular hydrogen bonds of natural polysaccharides.35–37 PGalEAm (Figure 4, left) at 1 mg/mL displays one size distribution in both aqueous and organic solvents (≤50 nm), attributed to the unaggregated molecule. This is assumed based on the theoretical calculation for the radius of gyration (Rg); for a polymer coil in a good solvent, Rg is approximated by eq 5:38
| (5) |
where N is the degree of polymerization. For a glycopolymer with a degree of polymerization of 350, the theoretical Rg is ∼37 nm.
Figure 4.

Dynamic light scattering of PGalEAmS2 and PGlcEAmS2 samples over a series of concentrations in aqueous (TRIS buffer, upper row) and organic (DMSO, lower row) solvent. PGalEAmS2 shows an increased hydrodynamic radius with an increase in concentration, while PGlcEAmS2 maintains the hydrodynamic size with an increase in concentration. Both PGalEAmS2 and PGlcEAmS2 show a significant decrease in hydrodynamic radius in DMSO compared to TRIS buffer.
At higher concentrations (3, 5, and 7 mg/mL), two distributions are observed in TRIS buffer, which are attributed to aggregates of different sizes. For PGalEAm, there is a strong correlation of size distribution with concentration, indicating that aggregate size increases with increasing concentration in both aqueous and organic solvent systems. PGlcEAm (Figure 4, right) displays a constant size distribution (≤150 nm) for all concentrations in both TRIS buffer and DMSO solution, showing that Rh is independent of concentration at the measured concentrations. Thus, the two glycopolymers have a different solution aggregation behavior both as a function of time and concentration.
GPC-MALLS was performed to compare the absolute molecular weights, dispersities, and molecular weight distributions of the two glycopolymers (Figure 5). PGalEAmS2 (Figure 5A) and PGlcEAmS2 (Figure 5B) display narrow unimodal peaks with low dispersity. The theoretical and absolute molecular weights for the two glycopolymers are reported in Table 1. The measured Mn is close to the theoretical Mn for both polymers.
Figure 5.

GPC traces of (A) PGalEAmS2 and (B) PGlcEAmS2.
Table 1.
Molecular Weight Data for Glycopolymers Determined via GPC
| GPC-MALLS |
||||
|---|---|---|---|---|
| polymer | theoretical | Mn | Mw | Đ |
| PGalEAmS2 | 63,400 | 64,700 | 73,100 | 1.13 |
| PGlcEAmS2 | 69,900 | 71,900 | 78,600 | 1.10 |
FTIR spectra for PGalEAm and PGlcEAm are shown in Figure 6A. All peak intensities were normalized to the 1654 cm−1 band, which is the amide I band associated with the polymer backbone.39 The PGalEAm and PGlcEAm spectra are identical with the exception of the bands between 1300 and 900 cm−1, highlighted in Figure 6B,C. Zhbankov et al.40 noted that the effects of inter/intramolecular associations within carbohydrates are observed in vibrational spectra, such as changes in intensity for closely spaced peaks, despite their identical structures. Socrates41 reported that carbohydrate hydroxyl groups participating in intramolecular hydrogen bonds have sharper peaks. The peaks for hydrogen bond acceptors such as C=O and C−O−C are also affected by intramolecular hydrogen bonding. We thus attribute the differences in the peak shape and intensity in the 1300–900 cm−1 region for the two copolymers to differences in the hydrogen bonding patterns of the pendant saccharide moieties. Vasko et al.42 established that the ∼1030 cm−1 band is associated with the C4-OH site of the saccharide structure; therefore, differences in its peak shape and position reflect stereochemical changes between PGalEAm and PGlcEAm that alter the inter/intramolecular hydrogen bonding at that site. Dashnau et al. have determined the hydrogen bonding patterns at each hydroxyl position within the saccharide.43 These results imply that the C4-OH site in PGalEAm participates in intramolecular hydrogen bonding within the pendant saccharide moiety resulting in preferential interactions with itself (i.e., hydrophobic interactions) leading to extensive aggregation, whereas in PGlcEAm, it undergoes intermolecular hydrogen bonding with its surroundings and minimizes self-aggregation events.
Figure 6.

FTIR spectra of PGalEAm (red) and PGlcEAm (black). (A) Full spectra of PGalEAm (red) and PGlcEAm (black). (B) Zoomed in region of spectra (1300–900 cm−1) displaying change in peak shift and shape at ∼1030 cm−1. (C) Overlay of PGalEAm (red) and PGlcEAm (black) spectra highlighting change in peak shift and shape. Change in peak size and shape indicates a change in hydrogen bonding patterns between PGalEAm and PGlcEAm.
Proton NMR spectroscopy was employed to investigate the effects of hydrogen bonding on the chemical environments of the hydroxyl protons in PGalEAm and PGlcEAm. The NMR spectra of the small-molecule analogues (methyl β,D-galactopyranoside and methyl β,D-glucopyranoside) and their corresponding glycopolymers are shown in Figure 7A–D. Here, small-molecule analogues were used to discern chemical shift changes for the saccharide structure in the glycopolymer spectra. Hydroxyl proton chemical shifts are between 4.0 and 5.3 ppm (DMSO-d6 solvent); the hydroxyl chemical shift positions for specific hydroxyl sites in the saccharide structure were assigned by HMBC 2D NMR spectra (Supplemental Figures S1 and S2). The chemical shift for the C4-OH proton is of particular interest due to stereochemical differences at the site in PGalEAm and PGlcEAm. In addition, the proton at the C4-OH site is the most accessible for hydrogen bonding interactions and therefore is the focus of the proton NMR analysis.
Figure 7.

1H NMR spectra in DMSO-d6 of (A) methyl β,D-galactopyranoside, (B) PGalEAm (C) methyl β,D-glucopyranoside, and (D) PGlcEAm. Chemical shifts of hydroxyl protons in small-molecule analogues are also present in glycopolymers; change in chemical shift between methyl β,D-galactopyranoside (label K, 4.32 ppm) and methyl β,D-glucopyranoside (label K, 4.86 ppm) of the C4-OH site can also be observed between PGalEAm (∼4.45 ppm) and PGlcEAm (∼4.93 ppm).
Figure 7A,B shows the 1H NMR data for methyl β,D-galactopyranoside and PGalEAm, respectively. The C4-OH proton in methyl β,D-galactopyranoside exhibits a chemical shift of 4.32 ppm (labeled K) and is also observed in the PGalEAm spectrum at ∼4.45 ppm, as indicated by the red arrow. Conversely, the C4-OH proton chemical shift in methyl β,D-glucopyranoside is 4.86 ppm (labeled K) is observed at ∼4.93 ppm in the PGlcEAm spectrum (indicated by the red arrow). Slight chemical shift changes of the C4-OH peaks between the small-molecule analogues and glycopolymer spectra are attributed to neighboring interactions between the glycopolymer repeat units due to conformational constraints, which are not present in the small-molecule structure. The similar chemical shifts of the small-molecule analogues and the glycopolymers suggest the analogous behavior between the small-molecule saccharides and the glycopolymer pendant saccharide groups.
The C4-OH hydroxyl proton chemical shift (K) for methyl β,D-galactopyranoside (Figure 7A) is upfield as compared with the same site for methyl β,D-glucopyranoside. This trend is also observed for the glycopolymers (∼4.45 ppm for PGalEAm versus ∼4.93 ppm for PGlcEAm, Figures 7B and 7D, respectively).
Variable temperature proton NMR spectroscopy (VT-NMR) was used to further probe the inter- and intramolecular hydrogen bonding patterns of both glycopolymers and their small-molecule analogues. The chemical shifts for the C4-OH proton (labeled K in Figure 7) for the glycopolymers and small-molecule analogues are plotted as a function of temperature in Figure 8; NMR spectra obtained at each temperature in the range of 30–80 °C are provided in the Supporting Information (Supplemental Figures S.7–S.10). The C4-OH proton peaks for PGlcEAmS2, methyl β,D-glucopyranoside, and methyl β,D-galactopyranoside exhibit downfield chemical shifts in a linear capacity with an increase in temperature; however, for PGalEAmS2, a linear trend in downfield chemical shifts is seen until 70 °C, where a slight upfield shift is observed when transitioning from 70 to 80 °C (Figure 8). The chemical shifts for the other hydroxyl protons (labeled M, N, and L in Figure 7) display linear downfield shifts with increasing temperature (Figure S.11). NMR chemical shift changes can potentially identify types of hydrogen bonding. Bekiroglu et al.44 reported that carbohydrate hydroxyl protons shifted upfield upon the formation of an intramolecular hydrogen bond, specifically to a ring oxygen; downfield shifts were characteristic of intermolecular hydrogen bonding. Thus, we infer that PGalEAm and PGlcEAm undergo differing conformational behaviors, with PGalEAm forming intramolecular and intermolecular associations, while PGlcEAm forms primarily intermolecular hydrogen bonds with the surrounding environment.
Figure 8.

Variable temperature proton NMR chemical shift of the C4-OH proton for each sample over a temperature range, where samples were measured at 30, 50, 70, and 80 °C. PGlcEAmS2, methyl β,D-glucopyranoside, and methyl β,D-galactopyranoside exhibit a linear decrease in chemical shift as a function of temperature, where PGalEAmS2 displays a slight upfield shift when transitioning from 70 to 80 °C. An upfield shift indicates the formation of intramolecular hydrogen bonds.
Carbon NMR spectroscopy was used to observe the effect of hydrogen bonding on electron density within the saccharide moiety of the small-molecule analogues and glycopolymers. The 13C NMR spectra of methyl β,D-galactopyranoside, PGalEAm, methyl β,D-glucopyranoside, and PGlcEAm are shown in Figure 9A–D. Again, small-molecule analogues of PGalEAm and PGlcEAm were used to discern chemical shift changes for the saccharide structure in the glycopolymer spectra. Carbon chemical shifts for the saccharide moiety are observed between 50 and 110 ppm, with chemical shift assignments for the small-molecule analogues determined by HSQC and HMBC 2D NMR methods (Supplemental Figures S1–S4). Note that the carbon peak labeled 7 in the small-molecule spectra is representative of the methoxy group not found in the glycopolymer structure. Additionally, the unlabeled peak at ∼67 ppm corresponds to the glycopolymer methylene carbon alpha to the glycosidic linkage not found in the small-molecule analogues.
Figure 9.

13C NMR spectra of (A) methyl β,D-galactopyranoside, (B) PGalEAm, (C) methyl β,D-glucopyranoside, and (D) PGlcEAm. Chemical shifts in small-molecule analogues are also present in glycopolymers; increased electron density at carbons 2, 3, 4, and 5 due to intramolecular associations within the saccharide moiety result in upfield chemical shifts in methyl β,D-galactopyranoside and PGalEAm in comparison to methyl β,D-glucopyranoside and PGlcEAm, respectively.
Figure 9A,B shows the 13C NMR spectra for methyl β,D-galactopyranoside and PGalEAm, respectively. The carbons labeled 1–5 in the methyl β,D-galactopyranoside spectrum have chemical shifts of 103, 69, 72, 67, and 74 ppm, respectively; these are also observed in the PGalEAm spectrum. The carbons labeled 1–5 in the methyl β,D-glucopyranoside spectrum (Figure 9C) exhibit chemical shift values of 103, 72, 77, 69, and 77 ppm, respectively. These are observed in the PGlcEAm spectrum (Figure 9D) at slightly different chemical shift values (102, 72, 76, 69, and 76 ppm). As postulated for the 1H NMR data, the similar chemical shift values of the glycopolymers and their small-molecules analogues suggest the analogous behavior between the small-molecule saccharides and the glycopolymer pendant saccharide moiety.
The methyl β,D-galactopyranoside carbon peaks for sites 2–5 in the spectrum are shifted upfield as compared with the same positions in the methyl β,D-glucopyranoside spectrum, a trend also observed in the PGalEAm and PGlcEAm spectra. Upfield carbon chemical shifts usually indicate increased electron density around the carbon atom.45,46
The spatial configuration of the pyranose ring when adopting the chair conformation has carbons 1, 3, and 5 in one plane with carbons 2 and 4 in a separate plane containing the ring oxygen.47 This causes upfield chemical shifts for carbons 2 and 4 in the methyl β,D-galactopyranoside and PGalEAm due to increased electron density via intramolecular associations within the pyranose ring, particularly with the ring oxygen. The same argument applies to carbons 3 and 5; in methyl β,D-galactopyranoside and PGalEAm spectra, these sites have different chemical environments caused by intramolecular interactions, thereby varying electron density in the sugar ring. In methyl β,D-glucopyranoside and PGlcEAm spectra, these interactions do not occur; thus, the C3 and C5 sites have approximately the same chemical shift. Perlin et al.47 reported that the upfield shifts of carbons 2 and 4 of other sugars in comparison with β,D-glucose may arise from transannular interactions within the pyranose ring, involving either the C1, C5, and ring oxygen or protons associated with C2, C4, and the ring oxygen.
To determine differences in hydrophobicity of the two glycopolymers, the extrinsic fluorescent dye 8-anilinonaphthalene-1-sulfonic acid (ANS) was used (Figure 10). ANS is known to bind to solvent exposed hydrophobic surfaces in proteins, resulting in a blue-shift in the emission spectrum.48 Both PGlcEAmS2 and PGalEAmS2 exhibit a linear increase in ANS fluorescence with increasing polymer concentration (Figure 10); however, a slightly blue-shifted peak at 480 nm is observed for PGalEAm (Figure 10a), not present in PGlcEAm (Figure 10b), suggesting that more hydrophobic surfaces are available in PGalEAm. We hypothesize that intramolecular hydrogen bonding within the PGalEAm pendant saccharide moiety creates an apolar patch on the backside of the sugar group,49 thereby promoting hydrophobic interactions with the glycopolymer backbone that cause the extensive aggregation behavior observed in DLS.
Figure 10.

ANS fluorescence spectra for glycopolymers (a) PGalEAmS2 and (b) PGlcEAmS2 as a function of increasing glycopolymer concentrations (25–200 μM ) in 20 mM TRIS in (pH 8.00) in the presence of 100 μM ANS. The spectra are corrected for blank ANS.
Rotating-frame Overhauser effect spectroscopy (ROESY) was employed to determine if through-space interactions50 were occurring within the saccharide pendant groups of PGalEAm (Figure 11A) and PGlcEAm (Figure 11B). ROESY is sensitive to spatial correlations, with cross peaks observed when protons are within a 4–5 Å distance of each other.51 Additionally, for synthetic polymers ROESY has the advantage of yielding only positive nuclear Overhauser effects (nOes) during the experiment, whereas other techniques such as NOESY may yield nOes that can be positive, negative, or nulled, depending on the mobility (i.e., molecular weight) of the macromolecule in solution. Of particular interest in the ROESY spectra is the spectral region containing the pendant saccharide group peaks; here, spectral information may determine if changes in through-space correlations, and thus intramolecular associations, are due to stereochemical changes at the C4-position.
Figure 11.

2D 1H, 1H-ROESY spectra of (A) PGalEAm and (B) PGlcEAm in DMSO-d6. In this topography, or contour, map, blue corresponds to negative contours (no new interactions, identical peak–peak correlation) and red corresponds to positive contours (new interactions, hetero peak–peak correlation). The diagonal crosspeak and crosspeak at 3.4 ppm correspond to either identical peak–peak correlation or solvent interactions. The PGalEAm spectrum shows new correlations between protons K, B/C, and L, G, indicating that stereochemistry influences intramolecular associations within the saccharide moiety. In the PGlcEAm spectrum, correlations between G, K, and B, C indicate minimal through-space interactions within the saccharide moiety.
In the PGalEAm 2D spectrum, two cross peaks are observed: ∼4.63 and ∼3.55 as well as ∼4.45 and ∼3.66 ppm, corresponding to sites labeled L and B/C as well as K and G, respectively. These cross peaks indicate that through-space molecular associations are occurring within the glycopolymer structure. The correlation between sites K and G indicates increased intramolecular associations within the PGalEAm pendant group; here, the formation of an intramolecular hydrogen bond between proton K and the cyclic ether, suggested by the deshielding of proton G observed in the 1D NMR spectra, allows additional interactions within the saccharide moiety. The increase in intramolecular associations within the PGalEAm pendant group is supported by the ANS fluorescence, where PGalEAm has increased hydrophobicity in comparison to PGlcEAm. This supports the hypothesis that extensive glycopolymer aggregation occurs in solution due to intramolecular associations, resulting in fewer interactions with Aβ peptides.
In the PGlcEAm 2D spectrum cross peaks are observed: ∼3.15 and ∼4.95 ppm as well as ∼3.75 and 3.5 ppm, corresponding to sites G and K as well as B and C, respectively. These cross peaks arise from protons bonded to the same carbon center, suggesting that through-space interactions are occurring due to relative proximity rather than molecular associations between pendant saccharide units.
Saturation transfer difference (STD) NMR spectroscopy was used to characterize binding interactions between the glycopolymers and Aβ peptides. STD NMR methods have been used previously for investigating ligand binding sites with target proteins52 by monitoring the transfer of proton magnetization from proteins to ligands or other bound moieties. This technique records NMR spectra under conditions of “on resonance” (STDon) or “off resonance” (STDoff) proton irradiation for the protein; bound ligands will exhibit enhanced proton signals as a function of irradiation time, observed in the difference spectra (i.e., STDdiff = STDon – STDoff).53 This technique is not limited to small-molecule ligands; results have been obtained for large molecules, such as glycopeptides,54 where binding sites can be readily detected.55
Figure 12 shows the STD spectra for PGalEAm in the presence of Aβ peptides. Figure 12A displays the reference spectrum for the blend with off resonance irradiation at 3 ppm and on-resonance irradiation at −30 ppm. Peaks for the PGalEAm pendant saccharide moiety are readily observed in the reference spectrum. Labeled 1H NMR spectra for PGalEAm and PGlcEAm in D2O are in Supporting Information, Figures S.5 and S.6. Figure 11A indicates little saturation transfer between PGalEAm and the Aβ peptides, with the difference spectrum containing only residual signals of ligand molecules. This indicates that there is little to no binding occurring between the pendant saccharide moiety and the peptides. This is consistent with the DLS data and confirms that PGalEAm does not alter the Aβ aggregation pathway.
Figure 12.

STD stacked spectra of (A) PGalEAm and Aβ reference spectrum and (B) PGalEAm and Aβ difference spectrum. PGalEAm saccharide pendant group protons have little to no binding to Aβ peptides.
Figure 13 shows the STD spectra for PGlcEAm in the presence of Aβ peptides. Figure 13B shows significant saturation transfer occurring between PGlcEAm and the Aβ peptide, indicating significant binding between PGlcEAm and the Aβ peptides. This confirms the DLS data, with PGlcEAm altering the Aβ aggregation pathway via intermolecular associations. In summary, the STD NMR spectra confirm that the two glycopolymers have different binding characteristics with Aβ caused by differences in the C4-position stereochemistry.
Figure 13.

STD stacked spectra of (A) PGlcEAm and Aβ reference spectrum and (B) PGlcEAm and Aβ difference spectrum. PGlcEAm saccharide pendant group protons strongly bind to Aβ peptides.
CONCLUSIONS
Analytical and physical characterization techniques were used to determine factors influencing glycopolymer aggregation behavior and subsequent binding affinity to Aβ peptides, specifically in regard to inter/intramolecular hydrogen bonding patterns within the pendant saccharide moiety. The change in stereochemistry at the C4-atom hydroxyl group between PGalEAm and PGlcEAm directly influences the formation of inter/intramolecular associations within the saccharide moiety. For PGalEAm, increases in intramolecular associations, either as a function of time or concentration, cause aggregate size increases, resulting in an overall reduction in the number of binding sites and interactions with Aβ42 peptide. These intramolecular associations include the formation of at least one intramolecular hydrogen bond in addition to apolar interactions with the hydrophobic glycopolymer backbone. PGlcEAm, on the other hand, participates in intermolecular associations with the surrounding environment including Aβ peptide, thereby minimizing the formation of glycopolymer aggregates and impacting the Aβ aggregation process. Understanding the glycopolymer solution behavior and gaining mechanistic understanding of Αβ/glycopolymer interactions provide a platform for improving the design of biologically relevant polymers, where stereochemistry plays a pivotal role in biological recognition and function. This report demonstrates the potential of preparing selective glycopolymers with pendant saccharide groups of specific stereochemistry to target interactions with biological molecules for applications within the biomedical field.
Supplementary Material
ACKNOWLEDGMENTS
Funding was provided by the National Institutes of Health (NIH RI5GM 123431) and the National Science Foundation National Research Traineeship (DG#1449999), National Institute of General Medical Sciences (R01 GM120634–01A1), and National Institute of Aging (R56AG062292) to V.R. The authors would also like to thank the Mississippi INBRE for the use of fluorescence spectroscopy facilities.
Footnotes
ASSOCIATED CONTENT
Supporting Information
The Supporting Information is available free of charge at https://pubs.acs.org/doi/10.1021/acs.biomac.0c01077.
Detailed description of synthesis and isolation of S2 polymers, HMBC NMR and HSQC NMR spectra of small-molecule analogues, stacked 1H NMR spectra of glycopolymers with small-molecule analogues, stacked variable temperature NMR spectra of glycopolymers and small-molecule analogues, and temperature coefficient plots of hydroxyl proton shifts for glycopolymers and small-molecule analogues (PDF)
Complete contact information is available at: https://pubs.acs.org/10.1021/acs.biomac.0c01077
Notes
The authors declare no competing financial interest.
Contributor Information
Ashleigh N. Bristol, School of Polymer Science and Engineering, The University of Southern Mississippi, Hattiesburg, Mississippi 39406-5050, United States
Jhinuk Saha, Department of Chemistry and Biochemistry, The University of Southern Mississippi, Hattiesburg, Mississippi 39406-5050, United States.
Hannah E. George, School of Polymer Science and Engineering, The University of Southern Mississippi, Hattiesburg, Mississippi 39406-5050, United States
Pradipta K. Das, School of Polymer Science and Engineering, The University of Southern Mississippi, Hattiesburg, Mississippi 39406-5050, United States
Lisa K. Kemp, School of Polymer Science and Engineering, The University of Southern Mississippi, Hattiesburg, Mississippi 39406-5050, United States
William L. Jarrett, School of Polymer Science and Engineering, The University of Southern Mississippi, Hattiesburg, Mississippi 39406-5050, United States
Vijayaraghavan Rangachari, Department of Chemistry and Biochemistry, The University of Southern Mississippi, Hattiesburg, Mississippi 39406-5050, United States.
Sarah E. Morgan, School of Polymer Science and Engineering, The University of Southern Mississippi, Hattiesburg, Mississippi 39406-5050, United States.
REFERENCES
- (1).Muñoz-Bonilla A; Fernández-Garcia M. Glycopolymeric Materials for Advanced Applications. Materials 2015, 8, 2276–2296. [Google Scholar]
- (2).Chen Y; Star A; Vidal S. Sweet carbon nanostructures: carbohydrate conjugates with carbon nanotubes and graphene and their applications. Chem. Soc. Rev 2013, 42, 4532–4542. [DOI] [PubMed] [Google Scholar]
- (3).Yu K; Lai BFL; Kizhakkedathu JN Carbohydrate Structure Dependent Hemocompatibility of Biomimietic Functional Polymer Brushes on Surfaces. Adv. Healthcare Mater. 2012, 1, 199–213. [DOI] [PubMed] [Google Scholar]
- (4).Ahmed M; Lai BFL; Kizhakkedathu JN; Nariain R. Hyperbranched Glycopolymers for Blood Biocompatibility. Bioconjugate Chem. 2012, 23, 1050–1058. [DOI] [PubMed] [Google Scholar]
- (5).Ladmiral V; Semsarilar M; Canton I; Armes SP Polymerization-Induced Self-Assembly of Galactose-Functionalized Biocompatible Diblock Copolymers for Intracellular Delivery. J. Am. Chem. Soc 2013, 135, 13574–13581. [DOI] [PMC free article] [PubMed] [Google Scholar]
- (6).Wang Y; Zhang X; Yu P; Li C. Glycopolymer micelles with reducible ionic cores for hepatocytes-targeting delivery of DOX. Int. J. Pharm 2013, 441, 170–180. [DOI] [PubMed] [Google Scholar]
- (7).Smith AE; Sizovs A; Grandinetti G; Xue L; Reineke TM Diblock Glycopolymers Promote Colloidal Stability of Polyplexes and Effective pDNA and siRNA Delivery under Physiological Salt and Serum Conditions. Biomacromolecules 2011, 12, 3015–3022. [DOI] [PubMed] [Google Scholar]
- (8).Li H; Cortez MA; Phillips HR; Wu Y; Reineke TM Poly(2-deoxy-2-methacrylamido glucopyranose)-b-Poly(methacrylate amine)s: Optimization of Diblock Glycopolycations for Nucleic Acid Delivery. ACS Macro Lett. 2013, 2, 230–235. [DOI] [PMC free article] [PubMed] [Google Scholar]
- (9).Zheng Y; Luo Y; Feng K; Zhang W; Chen G. High Throughput Screening of Glycopolymers: Balance between Cytotoxicity and Antibacterial Property. ACS Macro Lett. 2019, 8, 326–330. [DOI] [PubMed] [Google Scholar]
- (10).Mammen M; Choi S-K; Whitesides GM Polyvalent Interactionsin Biological Systems: Implications for Design and Use of Multivalent Ligands and Inhibitors. Angew. Chem., Int. Ed 1998, 37, 2754–2794. [DOI] [PubMed] [Google Scholar]
- (11).Courtney AH; Bennett NR; Zwick DB; Hudon J; Kiessling LL Synthetic Antigens Reveal Dynamics of BCR Endocytosis during Inhibitory Signaling. ACS Chem. Biol 2013, 9, 202–210. [DOI] [PMC free article] [PubMed] [Google Scholar]
- (12).Gibson MI; Barker CA; Spain SG; Albertin L; Cameron NR Inhibition of Ice Crystal Growth by Synthetic Glycopolymers: Implications for the Rational Design of Antifreeze Glycoprotein Mimics. Biomacromolecules 2009, 10, 328–333. [DOI] [PubMed] [Google Scholar]
- (13).Lee J; Lin E-W; Lau UY; Hedrick JL; Bat E; Maynard HD Trehalose Glycopolymers as Excipients for Protein Stabilization. Biomacromolecules 2013, 14, 2561–2569. [DOI] [PMC free article] [PubMed] [Google Scholar]
- (14).Mancini RJ; Lee J; Maynard HD Trehalose Glycopolymers for Stabilization of Protein Conjugates to Environmental Stressors. J. Am. Chem. Soc 2012, 134, 8474–8479. [DOI] [PubMed] [Google Scholar]
- (15).Pelegri-O’Day EM; Lin E-W; Maynard HD Therapeutic Protein-Polymer Conjugates: Advancing Beyond PEGylation. J. Am. Chem. Soc 2014, 136, 14323–14332. [DOI] [PubMed] [Google Scholar]
- (16).Becer CR The Glycopolymer Code: Synthesis of Glycopolymers and Multivalent Carbohydrate-Lectin Interactions. Macromol. Rapid Commun 2012, 33, 742–752. [DOI] [PubMed] [Google Scholar]
- (17).Ambrosi M; Cameron NR; Davis BG Lectins: tools for the molecular understanding of the glycocode. Org. Biomol. Chem 2005, 3, 1593–1608. [DOI] [PubMed] [Google Scholar]
- (18).Gabius H-J; Siebert H-C; André S; Jiménez-Barbero J; Rüdiger H. Chemical Biology of the Sugar Code. ChemBioChem 2004, 5, 740–764. [DOI] [PubMed] [Google Scholar]
- (19).Sun P; Lin M; Zhao Y; Chen G; Jiang M. Stereoisomerism effect on sugar-lectin binding of self-assembled glyco-nanoparticles of linear and brush copolymers. Colloids Surf., B 2015, 133, 12–18. [DOI] [PubMed] [Google Scholar]
- (20).Prevette LE; Kodger TE; Reineke TM; Lynch ML Deciphering the Role of Hydrogen Bonding in Enhancing pDNA-Polycation Interactions. Langmuir 2007, 23, 9773–9784. [DOI] [PubMed] [Google Scholar]
- (21).Madeira d. O. J.; Mastrotto F; Francini N; Allen S; van der Walle CF; Stolnik S; Mantovani G. Synthetic glycopolymers as modulators of protein aggregation: influences of chemical composition, topology, and concentration. J. Mater. Chem. B 2018, 6, 1044–1054. [DOI] [PubMed] [Google Scholar]
- (22).Haass C; Selkoe DJ Soluble protein oligomers in neurodegeneration: lessons from the Alzheimer’s amyloid β-peptide. Nat. Rev. Mol. Cell Biol 2007, 8, 101–112. [DOI] [PubMed] [Google Scholar]
- (23).Winklhofer KF; Tatzelt J; Haass C. The two faces of protein misfolding: gain-and loss-of-function in neurodegenerative diseases. EMBO J. 2008, 27, 336–349. [DOI] [PMC free article] [PubMed] [Google Scholar]
- (24).Das PK; Dean DN; Fogel AL; Liu F; Abel BA; McCormick CL; Kharlampieva E; Rangachari V; Morgan SE Aqueous RAFT Synthesis of Glycopolymers for Determination of Saccharide Structure and Concentration Effects on Amyloid β Aggregation. Biomacromolecules 2017, 18, 3359–3366. [DOI] [PMC free article] [PubMed] [Google Scholar]
- (25).Yanagisawa K. Role of gangliosides in Alzheimer’s disease. Biochim. Biophys. Acta, Biomembr 2007, 1768, 1943–1951. [DOI] [PubMed] [Google Scholar]
- (26).Miura Y; Yasuda K; Yamamoto K; Koike M; Nishida Y; Kobayashi K. Inhibition of Alzheimer Amyloid Aggregation with Sulfated Glycopolymers. Biomacromolecules 2007, 8, 2129–2134. [DOI] [PubMed] [Google Scholar]
- (27).Rajaram H; Palanivelu MK; Arumugam TV; Rao VM; Shaw PN; McGeary RP; Ross BP ″Click″ assembly of glycoclusters and discovery of a trehalose analogue that retards Aβ40 aggregation and inhibits Aβ40 neurotoxicity. Bioorg. Med. Chem. Lett 2014, 24, 4523–4528. [DOI] [PubMed] [Google Scholar]
- (28).Mees MA; Effenberg C; Appelhans D; Hoogenboom R. Sweet Polymers: Poly (2-ehtyl-2-oxazoline) Glycopolymers by Reductive Amination. Biomacromolecules 2016, 17, 4027–4036. [DOI] [PubMed] [Google Scholar]
- (29).Liang Y-Z; Li Z-C; Li F-M Self-Association of Poly[2-(β-D-glucosyloxy)ethyl Acrylate] in Water. J. Colloid Interface Sci 2000, 224, 84–90. [DOI] [PubMed] [Google Scholar]
- (30).Bax A; Davis DG Practical Aspects of Two-Dimensional Transvese NOE Spectroscopy. J. Magn. Reson 1985, 63, 207–213. [Google Scholar]
- (31).Mayer M; Meyer B. Characterization of Ligand Binding by Saturation Transfer Difference NMR Spectroscopy. Angew. Chem., Int. Ed 1999, 38, 1784–1788. [DOI] [PubMed] [Google Scholar]
- (32).Mayer M; Meyer B. Group Eitope Mapping by Saturation Transfer Difference NMR To Identify Segments of a Ligand in Direct Contact with a Protein Receptor. J. Am. Chem. Soc 2001, 123, 6108–6117. [DOI] [PubMed] [Google Scholar]
- (33).Sklenar V; Piotto M; Leppik R; Saudek V. Gradient-Tailored Water Suppression for 1H-15N HSQC Experiments Optimized to Retain Full Sensitivity. J. Magn. Reson., Ser. A 1993, 102, 241–245. [Google Scholar]
- (34).Kodali R; Wetzel R. Polymorphism in the intermediates and products of amyloid assembly. Curr. Opin. Struct. Biol 2007, 17, 48–57. [DOI] [PubMed] [Google Scholar]
- (35).Chand A; Chowdhuri S. Effects of dimethyl sulfoxide on the hydrogen bonding structure and dynamics of aqueous N-methylacetamide solution. J. Chem. Sci 2016, 128, 991–1001. [Google Scholar]
- (36).Ding Q; Zhang L; Wu C. Formation and structure of pachyman aggregates in dimethyl sulfoxide containing water. J. Polym. Sci., Part B: Polym. Phys 1999, 37, 3201–3207. [Google Scholar]
- (37).Wang W; Wang H; Jin X; Wang H; Lin T; Zhu Z. Effects of hydrogen bonding on starch granule dissolution, spinnability of starch solution, and properties of electrospun starch fibers. Polymer 2018, 153, 643–652. [Google Scholar]
- (38).Hiemenz PC; Lodge TP Polymer Chemistry, Second Edition Taylor & Francis: 2007; DOI: 10.1201/9781420018271. [DOI] [Google Scholar]
- (39).Katsumoto Y; Tanaka T; Sato H; Ozaki Y. Conformational change of Poly(N-isopropylacrylamide) during the coil-glubule transition investigated by Attenuated total refelection/Infrared Spectroscopy. J. Phys. Chem. A 2002, 106, 3429–3435. [DOI] [PubMed] [Google Scholar]
- (40).Zhbankov RG; Firsov SP; Grinshpan DD; Baran J; Marchewka MK; Ratajczak H. Vibrational spectra and noncovalent interactions of carbohydrates molecules. J. Mol. Struct 2003, 645, 9–16. [Google Scholar]
- (41).Socrates G, Infrared and Raman Characteristic Group Frequencies: Tables and Charts; Wiley: 2004. [Google Scholar]
- (42).Vasko PD; Blackwell J; Koenig JL Infrared and Raman Spectroscopy of Carbohydrates Part I: Identification of O-H and C-H-related virbrational modes for D-glucose, maltose, cellobiose, and dextran by deuterium-substitution methods. Carbohydr. Res 1971, 19, 297–310. [Google Scholar]
- (43).Dashnau JL; Sharp KA; Vanderkooi JM Carbohydrate Intramolecular Hydrogen bonding Cooperativity and Its Effect on Water Structure. J. Phys. Chem. B 2005, 109, 24152–24159. [DOI] [PubMed] [Google Scholar]
- (44).Bekiroglu S; Sandström A; Kenne L; Sandström C. Ab initio and NMR studies on the effect of hydration on the chemical shift of hydroxyprotons in carbohydrates using disaccharides and water/methanol/ethers as model systems. Org. Biomol. Chem 2004, 2, 200–205. [DOI] [PubMed] [Google Scholar]
- (45).Cheney BV; Grant DM Carbon-13 Magnetic Resonance. VIII. The Theory of Carbon-13 Chemical Shifts Applied to Saturated Hydrocarbons. J. Am. Chem. Soc 1967, 89, 5319–5327. [Google Scholar]
- (46).Gerbst AG; Krylov VB; Vinnitskiy DZ; Dmitrenok AS; Shashkov AS; Nifantiev NE 13C-NMR glycosylation effects in (1→3)-linked furanosyl-pyranosides. Carbohydr. Res 2015, 417, 1–10. [DOI] [PubMed] [Google Scholar]
- (47).Perlin AS; Casu B; Koch HJ Configurational and conformational influences on the carbon-13 chemical shifts of some carbohydrates. Can. J. Chem 1970, 48, 2596–2606. [Google Scholar]
- (48).Gasymov OK; Glasgow BJ ANS Fluorescence: Potential to Augment the Identification of the External Binding Sites of Proteins. Biochim. Biophys. Acta, Proteins Proteomics 2007, 1774, 403–411. [DOI] [PMC free article] [PubMed] [Google Scholar]
- (49).del Carmen Fernández-Alfonso M; Diaz D; Alvaro Berbis M; Marcelo F; Canada J; Jimenez-Barbero J. Protein-Carbohydrate Interactions Studied by NMR: From Molecular Recognition to Drug Design. Curr. Protein Pept. Sci 2012, 13, 816–830. [DOI] [PMC free article] [PubMed] [Google Scholar]
- (50).Breton RC; Reynolds WF Using NMR to identify and characterize natural products. Nat. Prod. Rep 2013, 30, 501–524. [DOI] [PubMed] [Google Scholar]
- (51).Jahed V; Zarrabi A; Bordbar A.-k.; Hafezi MS NMR (1H, ROESY) spectroscopic and molecular modelling investigations of supramolecular complex of β-cyclodextrin and curcumin. Food Chem. 2014, 165, 241–246. [DOI] [PubMed] [Google Scholar]
- (52).Viegas A; Manso J; Nobrega FL; Cabrita EJ Saturation-Transfer Difference (STD) NMR: A Simple and Fast Method for Ligand Screening and Characterization of Protein Binding. J. Chem. Educ 2011, 88, 990–994. [Google Scholar]
- (53).Wagstaff JL; Taylor SL; Howard MJ Recent developments and applications of saturation transfer difference nuclear magnetic resonance (STD NMR) spectroscopy. Mol. BioSyst 2013, 9, 571–577. [DOI] [PubMed] [Google Scholar]
- (54).Möller H; Serttas N; Paulsen H; Burchell JM; Talyor-Papadimitriou J; Meyer B. NMR-based determination of the binding epitope and conformational analysis of MUC-1 glycopeptides and peptides bound to the breast cancer-selective monoclonal antibody SM3. Eur. J. Biochem 2002, 269, 1444–1455. [DOI] [PubMed] [Google Scholar]
- (55).Meinecke R; Meyer B. Determination of the binding specificity of an integral membrane protein by saturation transfer difference NMR: RGD peptide ligands binding to integrin αIIbβ3. J. Med. Chem 2001, 44, 3059–3065. [DOI] [PubMed] [Google Scholar]
Associated Data
This section collects any data citations, data availability statements, or supplementary materials included in this article.