

Keywords: aristolochic acid, chronic kidney disease, integrin, kidney fibrosis, transforming growth factor-β
Abstract
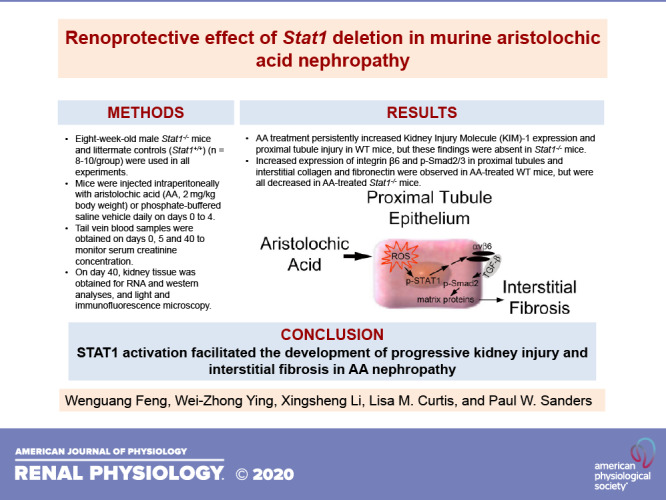
Injured tubule epithelium stimulates a profibrotic milieu that accelerates loss of function in chronic kidney disease (CKD). This study tested the role of signal transducer and activator of transcription 1 (STAT1) in the progressive loss of kidney function in aristolochic acid (AA) nephropathy, a model of CKD. Mean serum creatinine concentration increased in wild-type (WT) littermates treated with AA, whereas Stat1−/− mice were protected. Focal increases in the apical expression of kidney injury molecule (KIM)-1 were observed in the proximal tubules of WT mice with AA treatment but were absent in Stat1−/− mice in the treatment group as well as in both control groups. A composite injury score, an indicator of proximal tubule injury, was reduced in Stat1−/− mice treated with AA. Increased expression of integrin-β6 and phosphorylated Smad2/3 in proximal tubules as well as interstitial collagen and fibronectin were observed in WT mice following AA treatment but were all decreased in AA-treated Stat1−/− mice. The data indicated that STAT1 activation facilitated the development of progressive kidney injury and interstitial fibrosis in AA nephropathy.
INTRODUCTION
Chronic kidney disease (CKD) is a significant public health issue that is present in nearly 14% (∼40 million) of the United States population (1) and represents the ninth leading cause of death in the United States (2). As one indicator of disease burden, total annual Medicare spending for treatment of patients with CKD and those requiring kidney replacement therapy has been over $120 billion, or almost 34% of total Medicare fee-for-service spending (3). Recognizing an unmet need to prevent and treat kidney disease, the present study focused on mechanisms of tubular atrophy and associated fibrosis, which are invariant findings in CKD regardless of the underlying disease process (4).
Increasingly, research efforts have considered injury to the epithelium of the proximal tubule as a proximate cause of the development of a fibrosis-generating milieu that promotes progressive loss of kidney function in CKD (5–8). One potential focus is the signal transducer and activator of transcription (STAT) family, which comprises a well-known class of seven transcriptional regulatory proteins that control multiple cellular processes. Despite sequence homology, STAT proteins direct different cytokine/growth factor responses and are not interchangeable (9–11). STAT1 serves as an important mediator of interferon-γ (IFNγ) and Toll-like receptor 4 (TLR4) inflammatory pathways (12) and is expressed in proximal tubule epithelium and may be activated by oxidative stress (13, 14). Examination of age-associated transcriptional changes in the human kidney showed a relationship of inflammation in the aging kidney with increased expression of STAT1, along with two other transcription factors, NF-κB and STAT3 (15). During metabolism of immunoglobulin free light chains (FLC), reactive oxygen species injured proximal tubule epithelium and activated STAT1. STAT1 served as the seminal signaling molecule that produced the profibrotic agent, transforming growth factor-β (TGF-β), by this portion of the nephron and an associated tubulointerstitial fibrosis in vivo (14). The present study was therefore designed to test the hypothesis that STAT1 accentuates the loss of kidney function in aristolochic acid (AA) nephropathy, another model of CKD.
METHODS
Animal and Tissue Preparation
A breeding pair of heterozygous Stat1+/− mice was obtained from a mouse colony that had been derived from B6.129S(Cg)-Stat1tm1Dlv/J mice that had been backcrossed at least five generations onto the C57BL/6J genetic background (Stock No. 012606, Jackson Laboratory). Colonies of mice with homozygous deletion of Stat1 (termed Stat1−/− mice) and littermate controls (termed Stat+/+ mice) were established by cross-breeding heterozygous Stat1+/− mice, with genotyping confirmed using a PCR-based strategy previously described (14). Colonies were maintained in a gnotobiotic facility throughout the study. All animal studies included both Stat+/+ and Stat1−/− mice and were conducted using animal biosafety level 3 laboratory and Sealsafe cages with high-efficiency particulate air filters, and personnel wore personal protective equipment. Stat1−/− mice grew normally and were phenotypically normal under these conditions.
Epidemiological evidence suggested a slower clinical progression of AA nephropathy in female patients compared with male patients, and subsequent studies in mice confirmed a renal protective effect of 17β-estradiol in AA nephropathy (16). Although resistant to AA, tubular injury and interstitial fibrosis also develop in female mice (17). We followed the protocol described by Gewin’s group (18) and limited study to male mice. Eight-week-old male Stat1+/+ and Stat1−/− mice (n = 8–10/group) were used in all the experiments. To produce a model of CKD, aristolochic acid I (AA; A9451-50MG, MilliporeSigma, St. Louis, MO) was dissolved in phosphate-buffered saline (PBS; Invitrogen, Carlsbad, CA). The animals were intraperitoneally injected daily with either this solution (2 mg/kg body wt in PBS, 10 ml/kg body wt) or vehicle (PBS) on days 0 to 4, and were euthanized on day 40. Tail vein blood samples were obtained on days 0, 5, and 40 to monitor serum creatinine concentration (Fig. 1A).
Figure 1.

Timeline of the experimental protocol and effect of aristolochic acid (AA) treatment on serum creatinine concentration. A: following an initial tail vein collection of blood, Stat1−/− and littermate wild-type mice received 2 mg/kg AA or vehicle as daily intraperitoneal injections for 5 days. Blood was drawn again on day 5 and at the termination of the study on day 40, when the animals were euthanized and tissues harvested for analysis. B: after the daily AA injections on day 5 of study, compared with vehicle-treated mice, serum creatinine was higher [F(1, 22) = 10.92, P = 0.0032] in the AA-treated groups; the test for interaction between the presence of STAT1 and AA was not significant. By day 40, mean serum creatinine concentration of the group of AA-treated wild-type mice was greater (*P < 0.0001) than mean creatinine levels of the other three groups; the interaction between presence of STAT1 and AA was also significant [F(1, 35) = 28.67, P < 0.0001]. n = 8–12 animals in each group. Bld, phlebotomy; STAT1, signal transducer and activator of transcription 1; WT, wild type. Two-way ANOVA with Tukey’s multiple-comparisons test was used.
At the end of the experiment, mice were anesthetized using isoflurane and euthanized after the kidneys were removed. Kidneys were cut transversely, and slices were fixed in 10% neutral buffered formalin (Cat. No. SF100-4, Thermo Fisher Scientific, Waltham, MA) overnight and processed for paraffin embedding blocks. Kidney tissue samples were also fixed in 4% paraformaldehyde in PBS overnight at 4°C and cryopreserved in 20% sucrose solution at 4°C overnight before embedding in Tissue-Tek Optimal Cutting Temperature compound (Sakura Finetek). Fresh kidney tissues were also snap frozen in liquid nitrogen for Western blotting and in RNALater buffer (Cat. No. AM7020, Invitrogen, Thermo Fisher Scientific) for real-time RT-PCR analyses. Serum creatinine was assayed using liquid chromatography tandem mass spectrometry (Waters 2795 LC-MS/MS, Waters Corporation, Milford, MA) by the UAB-UCSD George M. O’Brien Kidney and Urological Research Center.
Analysis of Tissue Injury and Fibrosis and Immunofluorescence Microscopy of Kidney Tissues
Embedded kidney tissues were sectioned at 3 µm thickness and stained using hematoxylin and eosin (H&E), performed by the UAB Comparative Pathology Laboratory. Stained sections were imaged and analyzed at ×40 magnification by light microscopy (Model DMI6000 B, Leica, Buffalo Grove, IL). Morphological analysis was conducted by a blinded observer using six to eight images of H&E-stained sections for each animal. The number of pyknotic nuclei within cells per high powered field (HPF) was quantified. Brush border loss and presence of casts, either proteinaceous or cellular in nature, were evaluated as the number of tubule cross-sections per HPF. A composite injury score was produced by summing each of the three markers of injury. For quantification of tubulointerstitial fibrosis, 3-µm-thick sections were stained with picrosirius red using a kit (Catalog No. IW-3012, NovaUltra Picro-Sirius Red Stain Kit, IHC World, Woodstock, MD). Stained sections were imaged and analyzed at ×40 magnification using polarized microscopy (Leica). Quantification of the area of staining of each image was performed using ImageJ (v. 1.51, NIH).
The kidney paraffin sections underwent standard antigen retrieval methods using a kit (Cat. No. H-3300, Vector Laboratories, Burlingame, CA). Nonspecific staining in the sections was blocked by incubation in 2% normal horse or goat serum in PBS for 1 h, followed by incubation with specific primary antibodies overnight at 4°C. The antibodies included rabbit anti-phosphorylated (p-)Stat1 (Tyr701) (No. 9167S, Cell Signaling Technology, Danvers, MA), rabbit anti-Smad3 (No. 9523S, Cell Signaling Technology), mouse anti-TIM-1/KIM-1/HAVCR (AF1817, R&D Systems, Minneapolis, MN), rabbit anti-p-Smad2 (S465/467; No. 18338, Cell Signaling Technology), and rabbit anti-integrin subunit β6 (ITGB6) (ab233519, Cambridge, MA). Nuclei were identified using DAPI label in the mounting media (Cat. No. H-1500, VectaShield, Vector Laboratories, Burlingame, CA). Negative controls for each experiment included staining with IgG of corresponding species (Cat. No. I-1000, Lot No. X0112, and Cat. No. I-5000, Lot No. X0404, from Vector Laboratories, and Cat. No. 559478, BD PharMingen, San Jose, CA) and no primary antibody. Autofluorescence was reduced using Vector TrueVIEW (SP-8400, Vector Laboratories). Lotus tetragonolobus lectin (LTL; FL-1321, Vector Laboratories, Burlingame, CA) was used to identify the proximal tubule in the cortex and outer medulla. Secondary antibodies used for tissue immunofluorescence experiments included Alexa Fluor 594 goat anti-rabbit (Cat. No. A11072), Alexa Fluor 488 goat anti-rabbit (Cat. No. A11070), and Alexa Fluor 594 donkey anti-rat (Cat. No. A21209), all from Thermo Fisher, Waltham, MA. Stained sections were viewed by epifluorescence microscopy (model BZ-X800, Keyence, Itasca, IL).
Real-Time RT-PCR Analysis of mRNA Expression
Total RNA was extracted from the kidney cortex with TRIzol (Invitrogen, Thermo Fisher Scientific, Waltham, MA) and treated with DNAase I to remove genomic DNA and then purified with use of an RNA purification kit (Cat. No. 12183025, Invitrogen, Thermo Fisher Scientific). The DNA-free RNA was reverse transcribed to cDNA with use of the SuperScript IV RT Kit (Cat. No. 18091050, Invitrogen, Thermo Fisher Scientific). cDNA was amplified with SYBR Green PCR in the LightCycler 480 system (Roche Diagnostics, Indianapolis, IN) and specific primers (Table 1) for 40 cycles. Steady-state mRNA levels was calculated according to threshold cycle generated with the LightCycler 480 software. Expression of each mRNA was normalized to GAPDH.
Table 1.
List of primer sequences used in analysis of steady-state mRNA levels of genes of interest
| GenBank Accession No. | Gene | Forward Sequence | Reverse Sequence |
|---|---|---|---|
| NM_007742.4 | Collagen type I-α1 | 5′-TGGTCAAGATGGTCGCC-3′ | 5′-CCAGCCTTTCCAGGTTCT-3′ |
| NM_009930.2 | Collagen type III-α1 | 5′-GCCCACAGCCTTCTACAC-3′ | 5′-CCAGGGTCACCATTTCTC-3′ |
| BC043317.1 | Collagen type IV-α5 | 5′-CTGGTCAAGCTTTGGAAGGT-3′ | 5′-GAGGACCTTCTGTACCTGGT-3′ |
| BC138421.1 | Fibronectin 1 | 5′-CGAGTACGTTGTCAGCATCA-3′ | 5′-ATGACCTCCAGATCTCTCGG-3′ |
| AJ009862 | Tgfb1 | 5′-GCTTCAGCTCCACAGAGAAG-3′ | 5′-ACAGAAGTTGGCATGGTAGC-3′ |
| U06924.1 | Stat1 | 5′-TGCTGCTCCACAAGATGTTT-3′ | 5′-GAGTGTTCTGAGTGAGCTCG-3′ |
Stat1, signal transducer and activator of transcription 1; Tgfb1, transforming growth factor-β1.
Western Blot Analyses
Tissue lysates were produced using modified radioimmunoprecipitation assay (RIPA) buffer that contained 10 mM Tris·HCl, pH 7.4, 100 mm NaCl, 1 mM EDTA, 1 mM EGTA, 0.5% sodium deoxycholate, 1% Triton X-100, 10% glycerol, 0.1% SDS, 20 mM sodium pyrophosphate, 2 mM Na3VO4, 1 mM NaF, 1 mM PMSF, and a protease inhibitor cocktail (No. 1861284, Thermo Scientific, Rockford, IL). Total protein concentration was determined using a BCA Protein Assay Reagent Kit (Thermo Fisher Scientific Pierce Protein Research Products, Rockford, IL). Protein extracts (20–60 µg) were boiled for 3 min in Laemmli buffer and separated by 7–12% SDS-PAGE (Bio-Rad Laboratories, Hercules, CA), before electrophoretic transfer onto Immobilon-FL membranes (No. IPFL00010, Millipore, Temecula, CA). The membranes were blocked in 5% nonfat milk and then probed individually with an antibody (diluted 1:1,000) that specifically recognized STAT1 (No. 9172S) and p-STAT1 (No. 9167S, Cell Signaling Technology), Smad2/3 (C4T, Millipore), and p-Smad2/3 (Ser465/467 and Ser423/425) (D27F4) (Cell Signaling Technology), ITGB6 (ab233519), fibronectin (ab2413), and GAPDH (ab8245, Abcam). After washes, the blots were incubated for 1 h at room temperature with Alexa Fluor 680- or 790-conjugated AffiniPure secondary antibody (1:10,000 dilution). Bands were detected using Odyssey Infrared Imaging System (Li-Cor Biosciences, Lincoln, NE), and densitometry was performed using Image Studio Software (Li-Cor Biosciences, Lincoln, NE).
Statistics
All data are expressed as means ± SE. For multiple group comparisons, either one-way analysis of variance (ANOVA) or two-way ANOVA, followed by Tukey’s multiple-comparisons test, was performed using Prism, v. 8.4.3. Two-way ANOVA, which determines how a response was affected by two factors, partitioned the overall variance of the outcome variable into three components, plus a residual (or error) term. It computed P values that tested three null hypotheses: an interaction P value for the null hypothesis that there was no interaction between the two factors on the response as well as P values for the null hypotheses that each factor had no effect on the response. P values and associated F statistics are provided in the figures, where appropriate as well as the significance demonstrated through subsequent post hoc testing. P < 0.05 was considered statistically significant.
Study Approval
This study was carried out in strict accordance with the recommendations in the Guide for the Care and Use of Laboratory Animals of the National Institutes of Health. The Institutional Animal Care and Use Committee at the University of Alabama at Birmingham approved the project.
RESULTS
STAT1 Participated in Kidney Injury and Loss of Renal Function in CKD
From day 0 to day 40, mean serum creatinine concentration of littermate control (Stat1+/+) mice treated with AA increased eightfold from 0.076 ± 0.006 to 0.608 ± 0.109 mg/dL and was greater (P < 0.0001) than mean creatinine levels of the other three groups at day 40 (Fig. 1B). The interaction between presence of STAT1 and AA was also significant [F(1, 35) = 28.67, P < 0.0001] at day 40. In contrast, from day 0 to day 40, mean serum creatinine concentrations (0.098 ± 0.004 vs. 0.121 ± 0.004 mg/dL; P = 0.975) did not change in the group of 12 AA-treated Stat1−/− mice.
Ichimura et al. (19) demonstrated that kidney injury molecule (KIM)-1 expression is nearly absent in the normal kidney but increases significantly in proliferating, dedifferentiated cells in the injured proximal tubule. Focal increases in the apical expression of KIM-1 were observed in the proximal tubules, which were identified by staining with Lotus tetragonolobus lectin (LTL, green fluorescence) of Stat1+/+ mice in the treatment group (Fig. 2) (20). In contrast, KIM-1 expression was absent in the other three groups, which included Stat1−/− mice in the AA-treated group and littermate control and Stat1−/− mice in the vehicle-treated groups. Along with KIM-1 expression, Stat1+/+ mice that received AA also showed focal areas of tubular injury with dilatation, luminal debris, and loss of the brush border (Fig. 3A). As done previously (14), a blinded observer quantified tubule epithelial cell injury in hematoxylin and eosin (H&E)-stained kidney sections (n = 6–8 animals in each group) by generating a composite injury score that was based on the numbers of pyknotic nuclei, brush border loss, and proteinaceous/cellular casts in cortical sections. At the end of the study period, kidneys of Stat1+/+ mice treated with AA showed higher mean composite injury scores than kidneys from corresponding control groups of Stat1+/+ and Stat1−/− mice. Mean composite injury score of Stat1+/+ mice in the AA-treated group was also greater than composite injury scores of the corresponding treatment group of Stat1−/− mice (Fig. 3B).
Figure 2.
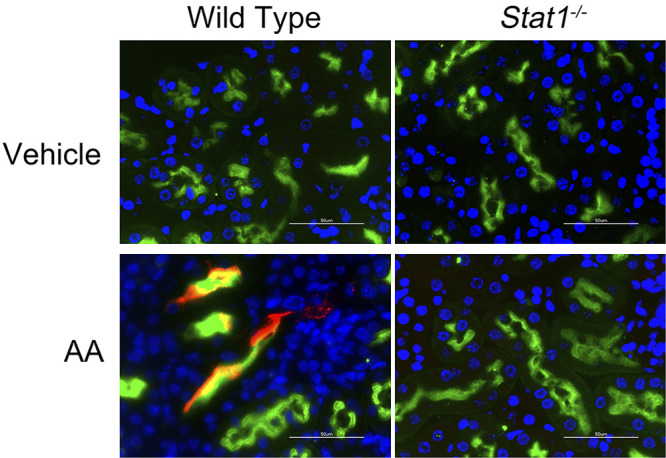
Apical expression of KIM-1 is focally increased in the proximal tubules of AA-treated wild-type mice. Expression of KIM-1 is low in normal kidney but increases in regenerating proximal epithelial cells (17). In this model of CKD, KIM-1 (red fluorescence) increased and was usually colocalized with Lotus tetragonolobus lectin (LTL, green fluorescence), specifically in the AA-treated wild-type littermates. Nuclei were counterstained with DAPI (blue fluorescence). Occasionally, KIM-1 was found in tubules with low or no LTL staining, presumably because LTL binds to the brush border of differentiated proximal tubules (25). KIM-1 expression was absent in tissue sections from the other groups that included AA-treated Stat1−/− mice (bottom right) and vehicle-treated Stat1−/− and littermate control mice (top). White bars = 50 µm. AA, aristolochic acid; CKD, chronic kidney disease; KIM-1, kidney injury molecule-1; STAT1, signal transducer and activator of transcription 1.
Figure 3.
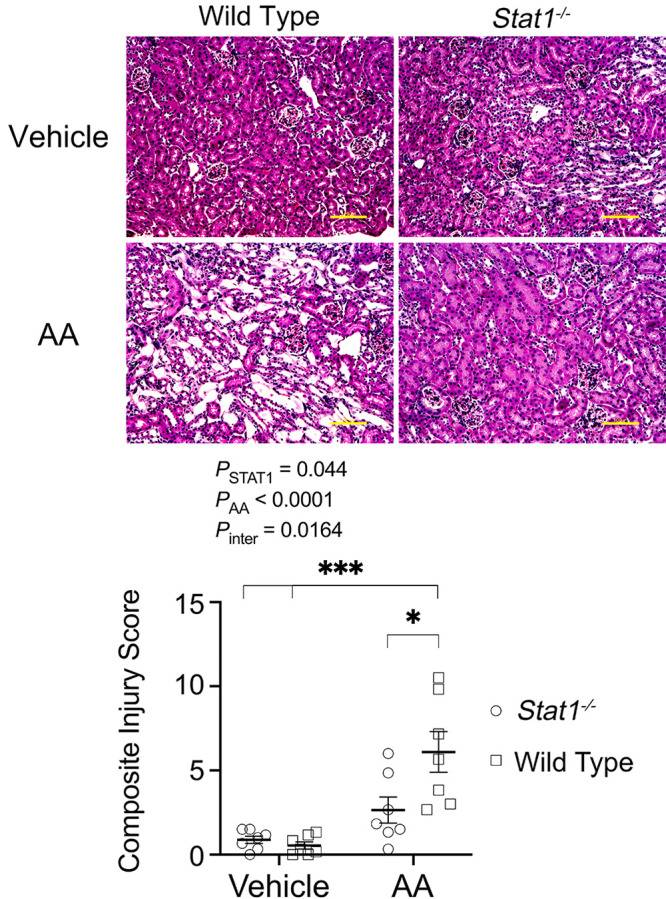
Histological changes observed in groups of mice under study. A: littermate control mice that received AA also showed focal areas of injury with tubular dilatation, luminal debris, and loss of brush border (bottom left). These changes were not prominent in the vehicle-treated groups (top) and in the AA-treated Stat1−/− mice (bottom right). Yellow bars = 100 µm. B: blinded analysis of H&E-stained kidney tissues (n = 6–8 animals in each group) generated a composite injury score that reflected proximal tubular cell injury revealed by increases in injury markers: apoptotic body or pyknotic nucleus, brush border disruption or breaks in the epithelial barrier, or presence of cellular casts in the tubular lumen. Kidneys of Stat1+/+ mice treated with AA showed higher mean composite injury scores than kidneys from corresponding control groups of Stat1+/+ and Stat1−/− mice. Composite injury scores of Stat1+/+ mice in the AA-treated groups were also greater then composite injury scores of the corresponding AA-treatment group of Stat1−/− mice. The interaction between presence of STAT1 and AA was also significant [F(1, 24) = 6.662, P = 0.0164]. *P = 0.0139; ***P < 0.0003 (two-way ANOVA with Tukey’s multiple-comparisons test). AA, aristolochic acid; H&E, hematoxylin and eosin; STAT1, signal transducer and activator of transcription 1.
STAT1 Facilitated Interstitial Matrix Protein Deposition
AA treatment of wild-type mice promoted an increase in p-STAT1 (Tyr701) compared with kidney lysates from wild-type mice that received the vehicle or sham treatment (Fig. 4A). Immunofluorescence microscopy showed activation of STAT1 in LTL-positive tubules of AA-treated wild-type mice. As anticipated, Stat1−/− mice did not express p-STAT1 (Tyr701) or STAT1 (Fig. 4B). Because our prior study showed a critical function of integrin-β6 in the regulation of TGF-β activity during STAT1 activation (14), Western analysis of lysates of the kidney cortex was performed and also showed increased expression of integrin-β6 in AA-treated wild-type mice (Fig. 5A). Consistent with the Western blot analysis, immunofluorescence microscopy found linear expression of integrin-β6 specifically in proximal tubules of the wild-type mice in the treatment group (Fig. 5B).
Figure 4.
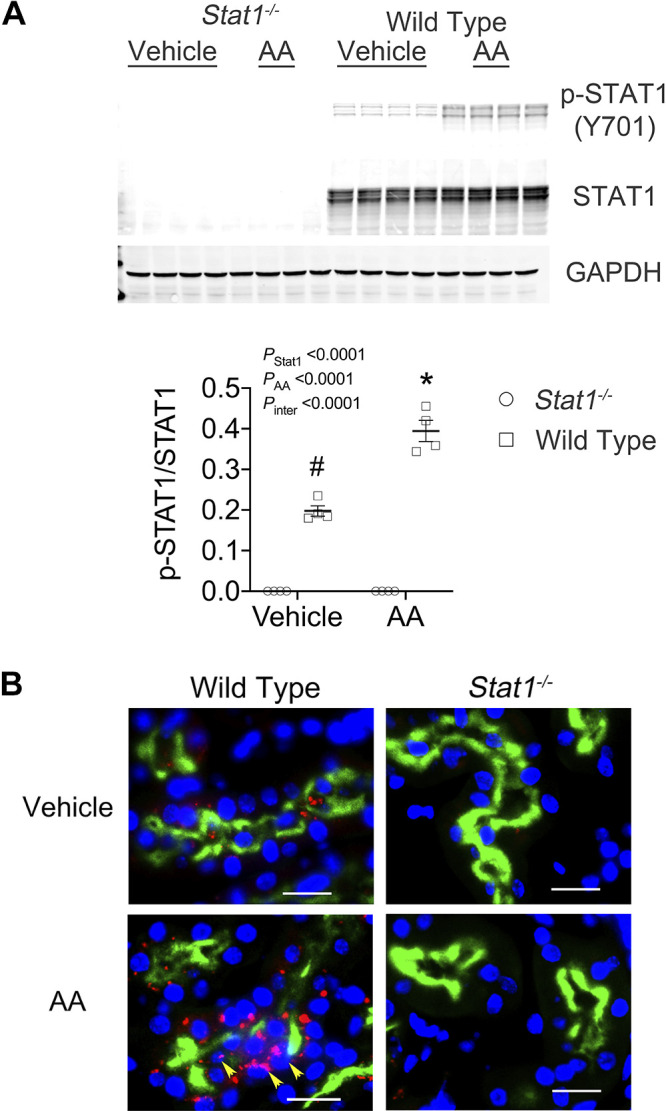
STAT1 was activated in the kidney cortex of AA-treated wild-type mice. A: Western blot analyses of lysates of the kidney cortex confirmed the lack of STAT1 in the Stat1−/− mice. The experimental treatment promoted in the wild-type mice an increase in p-STAT1 (Y701). The interaction between presence of STAT1 and the experimental treatment was also significant [F(1, 12) = 46.30, P < 0.0001). *P < 0.0001, compared with the other three groups; #P < 0.001, compared with the two groups of Stat1−/− mice in each experiment (n = 4 mice in each group; two-way ANOVA with Tukey’s multiple-comparisons test). B: consistent with the Western blot analyses, immunofluorescence images (figures at right) detected specifically the presence of p-STAT1 (Y701; red fluorescence) in the cytoplasm and nuclei (yellow arrows) of proximal tubules, which were labeled with LTL (green fluorescence), and interstitial cells of wild-type mice treated with AA (bottom left). The presence of p-STAT1 (Y701) in the proximal tubules was not observed in tissue sections from the groups that included vehicle-treated Stat1−/− mice and AA-treated Stat1−/− mice (right) and was sparsely present in vehicle-treated littermate control mice (top left). Nuclei were counterstained with DAPI (blue fluorescence). White bars represented 20 µm. AA, aristolochic acid; LTL, Lotus tetragonolobus lectin; STAT1, signal transducer and activator of transcription 1.
Figure 5.

Integrin β6 increased in the kidney cortex of AA-treated wild-type mice. A: Western analyses of lysates of the kidney cortex showed increased expression of integrin β6 specifically in wild-type mice following AA treatment. The interaction between presence of STAT1 and the experimental treatment was also significant [F(1, 12) = 16.51, P = 0.0016]. *P < 0.0001, compared with the other three groups (n = 4 mice in each group; two-way ANOVA with Tukey’s multiple-comparisons test). B: immunofluorescence experiments using anti-integrin β6 (red fluorescence) detected linear staining (arrow) along the basolateral surfaces of LTL-labeled (green fluorescence) proximal tubules of wild-type mice treated with AA (bottom left). Staining for integrin β6 was absent in tissue sections from the other groups in the study. Nuclei were counterstained with DAPI (blue fluorescence). White bars represented 50 µm. AA, aristolochic acid; LTL, Lotus tetragonolobus lectin; STAT1, signal transducer and activator of transcription 1.
To determine if the activity of TGF-β was increased, Western blot analyses of p-Smad2/3 (Ser465/467), total Smad2/3 and GAPDH were performed in the four groups. As observed previously (14), the expression of total Smad2/3 was reduced in the Stat1−/− mice, so expression of p-Smad2/3 was factored by levels of total Smad2/3 in each sample. p-Smad2/3 increased in lysates of the kidney cortex from wild-type mice in the treatment group. When compared with corresponding groups of Stat1−/− mice, the control-treated wild-type mice also showed a small but significant increase (P < 0.05) in levels of p-Smad2/3 (Fig. 6A). Immunofluorescence microscopy demonstrated that expression of p-Smad2 (Ser465/467) in proximal tubules of wild-type mice in the treatment group was increased compared with the other groups in the study (Fig. 6B). Cortical tissues from wild-type mice in the AA treatment group confirmed increased steady-state mRNA expression of collagen type I-α1 (Col1a1), collagen type III-α1 (Col3a1), collagen type IV-α5 (Col4a5), fibronectin (Fn1), Transforming Growth Factor-beta 1 gene (Tgfb1), and Stat1 compared with Stat1−/− mice in the AA treatment group and mice in the vehicle treatment groups (Fig. 7). We analyzed interstitial fibrosis, specifically the contribution of collagen deposition, using picrosirius-stained sections under polarized microscopy (21, 22). Stat1−/− mice in the treatment group did not show the increase in deposition of interstitial collagen observed in the wild-type mice (Fig. 8, A and B). Western blot analyses also confirmed that fibronectin increased in the kidney cortex of AA-treated wild-type mice but not in the kidneys of AA-treated Stat1−/− mice and the two vehicle-treated groups (Fig. 9).
Figure 6.
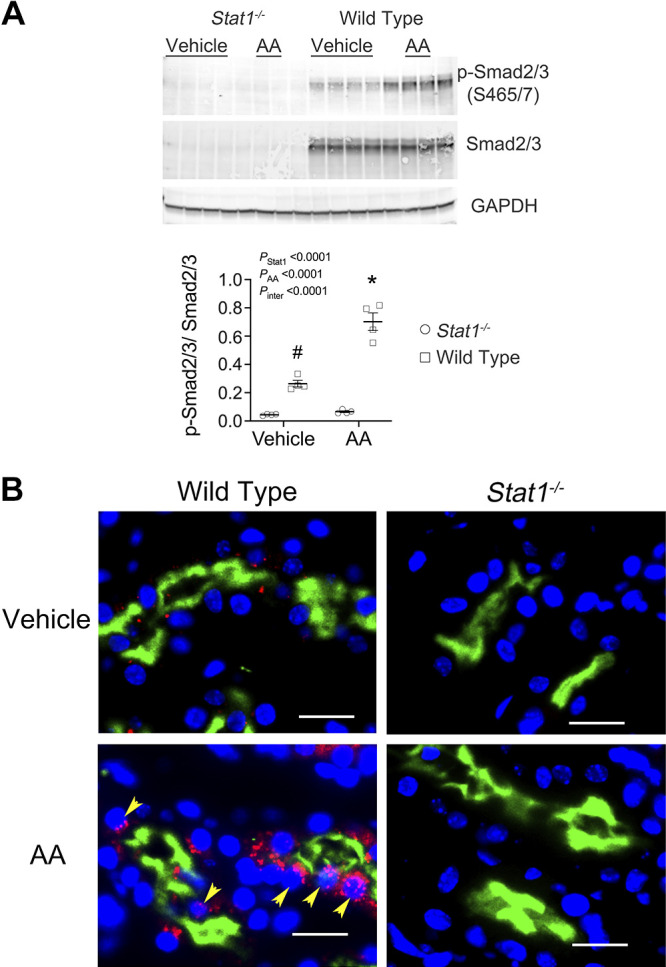
Expression of p-Smad2/3 (S465/7) increased in the kidney cortex of wild-type mice in the treatment group. A: because the expression of total Smad2/3 was reduced in the Stat1−/− mice, a finding observed previously (14), expression of p-Smad2/3 was factored by levels of total Smad2/3 in each sample. Western blot analyses of lysates of the kidney cortex showed increased expression of p-Smad2/3 in wild-type mice following AA treatment. Compared with corresponding control group of Stat1−/− mice, vehicle-treated and sham-treated wild-type mice also showed increased (P < 0.007) levels of p-Smad2/3. The interaction between presence of STAT1 and the experimental treatment was also significant [F(1, 12) = 38.49, P < 0.0001]. *P < 0.0001, compared with the other three groups; #P < 0.007, compared with the two groups of Stat1−/− mice in the experiment (n = 4 mice in each group; two-way ANOVA with Tukey’s multiple-comparisons test). B: immunofluorescence microscopy using anti-p-Smad2 antibody detected the presence of p-Smad2 (red fluorescence) in proximal tubules, which were labeled with LTL (green fluorescence), and other unidentified cells in the interstitium of wild-type mice following AA treatment (bottom left). p-Smad2 was detected in nuclei (yellow arrows) and cytoplasm. p-Smad2 (S465/467)-related fluorescence was not detected in tissue sections from the Stat1−/− mice (right) and was sparsely detected in the vehicle-treated littermate control mice (top left). Nuclei were counterstained with DAPI (blue). Yellow bars = 20 µm. AA, aristolochic acid; LTL, Lotus tetragonolobus lectin; STAT1, signal transducer and activator of transcription 1.
Figure 7.

Steady-state levels of mRNA of Stat1, Tgfb1, Col1a1, Col3a1, and Fn1 increased in the kidney cortex of AA-treated wild-type mice. Steady-state mRNA levels were determined in the kidney cortex of the four groups of mice in the study (n = 5–9 mice/group). Cortical tissues from wild-type mice in the AA treatment group demonstrated increases in steady-state mRNA of collagen type I-α1 (Col1a1), collagen type III-α1 (Col3a1), fibronectin (Fn1), transforming growth factor-β1 (Tgfb1), and Stat1, but not collagen type I-α5 (Col4a5), compared with Stat1−/− mice in the AA treatment group and mice in the vehicle-treatment groups in each of the experiments. Data were analyzed using two-way ANOVA with Tukey’s multiple-comparisons test. AA, aristolochic acid; Stat1, signal transducer and activator of transcription 1.
Figure 8.
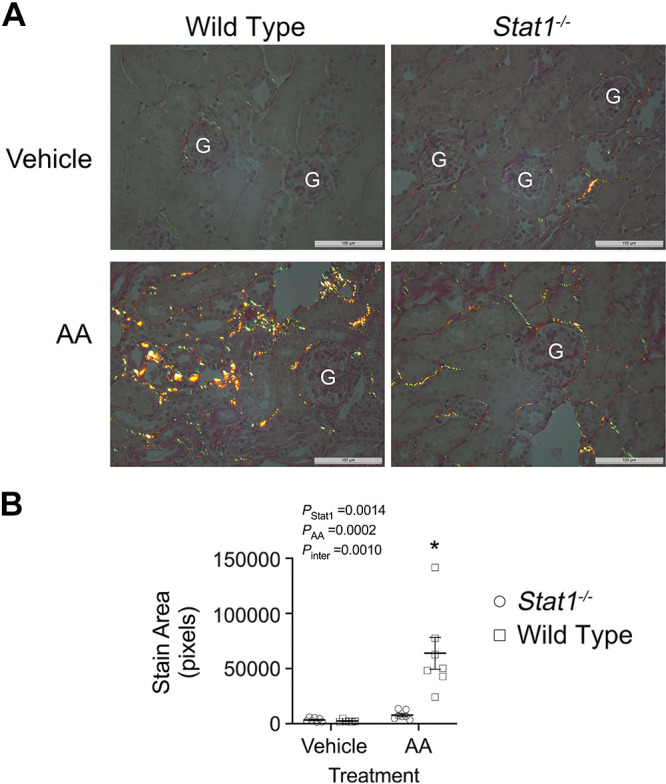
Deletion of Stat1 prevented the development of interstitial collagen deposition following AA treatment. A: picrosirius stain detected the presence of collagen (red, green, and yellow fluorescence) in the interstitium of kidney sections from the four groups (6–7 mice/group). Representative images for each group are shown in the figure. G, glomerulus. Nuclei were counterstained with hematoxylin. White bars = 100 µm. B: stained sections were quantified using an image-processing program (ImageJ, v. 1.51, NIH) and examining polarized microscopic images at ×40 magnification. The interactions between presence of STAT1 and the experimental treatment was significant [F(1, 23) = 14.21, P = 0.0010]. The increase in collagen deposition observed in AA-treated littermates was not observed in the AA-treated Stat1−/− mice. *P < 0.0002, compared with the other three groups (two-way ANOVA with Tukey’s multiple-comparisons test). AA, aristolochic acid; STAT1, signal transducer and activator of transcription 1.
Figure 9.

Fibronectin increased in the kidney cortex of wild-type mice in the treatment group. A: Western blot analyses of lysates of the kidney cortex showed increased fibronectin in wild-type mice following AA treatment (n = 4 mice in each group). B: the interaction between presence of STAT1 and the experimental treatment was significant [F(1, 12) = 8.103, P = 0.0147]. Compared with the control groups and Stat1−/− mice in the treatment group, wild-type mice in the treatment group showed increased (*P < 0.05) levels of fibronectin (two-way ANOVA with Tukey’s multiple-comparisons test). AA, aristolochic acid; STAT1, signal transducer and activator of transcription 1.
DISCUSSION
Originally marketed as a weight reduction agent in Chinese herbal preparations, epidemiological research subsequently found that AA caused progressive kidney failure from tubular atrophy and interstitial fibrosis (23). Metabolites of AA, which were generated through metabolism by the liver, have been shown to accumulate in the proximal tubule through organic anion transporters (24). AA, along with these toxic metabolites, promoted mitochondrial damage, oxidative stress, and activation of the nucleotide-binding domain, leucine-rich repeat family pyrin domain containing 3 (NLRP3) inflammasome pathway (24–28). Altered proximal tubular function resulted in apoptosis, release of inflammatory cytokines and growth factors, and collagen transcription (6). The final result was tubular atrophy and interstitial fibrosis (6, 25–28). By demonstrating increases in mean serum creatinine levels by day 40 in wild-type but not Stat1−/− mice, the present study found that STAT1 participated directly in the loss of kidney function in the AA model of CKD. Persistent STAT1 activation, indicated by phosphorylation of the tyrosine residue at position 701 (42), tubular injury, and increased integrin β6, p-Smad2/3, fibronectin, and interstitial deposition of collagen, were observed only in AA-treated wild-type mice. Overall, the renoprotective effect of loss of Stat1−/− on AA-induced tubular injury and fibrosis was striking.
Activation of the canonical TGF-β pathway was significantly reduced in AA-treated Stat1−/− mice. Although multiple potential pathways can initiate TGF-β activity, integrin αvβ6 has been shown to promote a localized activation of TGF-β (30–34). Binding to the arginine-glycine-aspartate (RGD) sequence on latency-associated peptide produces a conformational change in the latent complex to permit activation of TGF-β (32). Expression of integrin β6, the limiting subunit in the production of the transmembrane αvβ6 heterodimer, is virtually undetectable in the normal adult kidney but represents an epithelial cell response to injury and inflammation (35). Interruption of the αvβ6-dependent activation of TGF-β mitigated the development of interstitial fibrosis in unilateral ureteral obstruction (UUO) (31) and in other kidney diseases including proximal tubulopathy from metabolism of certain immunoglobulin free light chains (14, 30). Consistent with these studies, AA-treated wild-type mice, but not AA-treated Stat1−/− mice, showed focal increases in integrin β6 (Fig. 5) and p-Smad2/3 (Fig. 6) in the proximal tubules. Picrosirius staining, an indicator of collagen deposition (21, 22), demonstrated increased interstitial collagen and fibronectin in the AA-treated wild-type mice. Because these effects were not observed in Stat1−/− mice, the results revealed a STAT1-dependent process leading to expression of integrin β6 in the proximal tubule, activation of TGF-β, and interstitial matrix protein deposition. The combined findings supported not only a potential cytoprotective role for inhibition of STAT1 but especially prevention of a profibrotic milieu in the interstitium in this model.
Our findings are concordant with other publications in this field, with one exception noted below. A recent analysis of proximal tubule-specific gene expression during UUO suggested that proinflammatory and profibrotic transcription factors such as interferon regulatory factor 1 (Irf1), Nfkb1, and Stat3 served as drivers of progression of renal fibrosis (8). Because STAT1 is obligately required to upregulate IRF1 (9), our present results were therefore consistent with these findings. Also consistent with the present study, two studies of diabetic kidney disease have associated an increase in activation of STAT1 in the proximal tubules of human kidney specimens and kidneys of diabetic mice with the development of interstitial fibrosis (36, 37). Production of IRF1, which is upregulated by STAT1 (23), promoted the proinflammatory response that occurs early on in experimental ischemic acute kidney injury (AKI); loss of Irf1 ameliorated the loss of renal function in this model (uninephrectomy followed by 17 min of warm ischemia to the remaining kidney) (38). The authors concluded that the mechanism of activation of IRF1 involved the generation of reactive oxygen species, which also activates the STAT1 pathway (13, 14). Kemmner et al. (39) also showed a role for STAT1 in limiting tubular injury and inflammation in their model of ischemia-reperfusion injury. However, semiquantitative histological evidence of interstitial fibrosis present late in the healing phase in Stat+/+ mice appeared even worse in Stat1−/− mice (39). A possible explanation for this conclusion, which differs from that of the present study, was the use of a method of kidney injury (30 min of warm ischemia to right kidney) that was much more severe than the kidney injury processes used in the present study. Although a precise reason for the differing conclusions is not available, multiple fibrosis remodeling mechanisms in addition to integrin β6 may activate TGF-β (7, 40) and produce the final common pathway of tubulointerstitial fibrosis.
Perspectives and Significance
By demonstrating that mice lacking Stat1−/− showed less pathophysiological evidence of tubular injury and interstitial fibrosis, this novel study confirmed a direct influence of STAT1 on outcome in AA-induced nephropathy. The cytoprotective role of STAT1 inhibition was supported by recent publications that demonstrated the activation and involvement of STAT1 in other animal models of renal tubular injury, including the proximal tubulopathy from monoclonal immunoglobulin free light chains (14), ischemia-reperfusion injury (41), and cisplatin-induced cytotoxicity (42). With activation of STAT1, expression of integrin β6 increased along with activation of TGF-β. Because TGF-β also promotes the transcription of integrin β6 (43), the initiation of Smad signaling in the proximal tubule facilitates a potential localized positive feedback loop that results in interstitial fibrosis. The findings lend credence to the concept that interstitial fibrosis may be an active process in CKD. One caveat is that STAT1 may enhance apoptosis from DNA damage (44). Although prior studies showed that the major mechanism of AA-induced apoptosis involved mitochondrial dysfunction and oxidative stress (25–27), AA also promotes genotoxic stress (45), which may contribute to this process. Mitigation of these effects by Stat1 deletion was not explored in the present study. Although STAT1 is expressed in proximal tubules and activated by oxidative stress (13, 14) and the primary target of AA is the proximal tubule (6, 25–28), STAT1 is also expressed in glomeruli and participates, for example, in glucose-mediated podocyte injury (46). A second limitation of our paper therefore was our focus on the tubular nephron, leaving open the question of an additional role for STAT1 in the event of concomitant glomerular injury. Ruxolitinib, a clinically available selective JAK/STAT1 inhibitor, has demonstrated efficacy in multiple myeloma (47, 48) and in FLC-mediated proximal tubule activation and injury in vitro (14). It is clear that CKD represents a clinically heterogeneous final common pathway initiated and perpetuated by multiple etiological pathways, so subsequent confirmation of the findings in additional CKD models would provide an opportunity to expand the use of JAK1/2 inhibitors to patients with progressive CKD that results from diseases that activate the STAT1 pathway.
GRANTS
This work was supported by Merit Award 2 I01 CX001326 from the US Department of Veterans Affairs Clinical Sciences R&D Service and by the National Institute of Diabetes and Digestive and Kidney Diseases UAB-UCSD George M. O'Brien Kidney and Urological Research Centers Program (Grant 2P30DK079337; to P.W.S. and L.M.C.).
DISCLOSURES
No conflicts of interest, financial or otherwise, are declared by the authors.
AUTHOR CONTRIBUTIONS
W.F., L.M.C., and P.W.S. conceived and designed research; W.F., W-Z.Y., X.L., L.M.C., and P.W.S. performed experiments; W.F., W-Z.Y., X.L., L.M.C., and P.W.S. analyzed data; W.F., W-Z.Y., X.L., L.M.C., and P.W.S. interpreted results of experiments; W.F., W-Z.Y., X.L., L.M.C., and P.W.S. prepared figures; W.F., W-Z.Y., X.L., L.M.C., and P.W.S. drafted manuscript; W.F., W-Z.Y., X.L., L.M.C., and P.W.S. edited and revised manuscript; W.F., W-Z.Y., X.L., L.M.C., and P.W.S. approved final version of manuscript.
REFERENCES
- 1.Centers for Disease Control and Prevention. Chronic Kidney Disease Surveillance System-United States. Website: cdc.gov/ckd.
- 2.Heron M. Deaths: leading causes for 2017. Natl Vital Stat Rep 68: 1–77, 2019. [PubMed] [Google Scholar]
- 3.US Renal Data System. 2019 USRDS annual data report: Epidemiology of kidney disease in the United States. National Institutes of Health, National Institute of Diabetes and Digestive and Kidney Diseases, Bethesda, MD, 2019. “The data reported here have been supplied by the United States Renal Data System (USRDS). The interpretation and reporting of these data are the responsibility of the authors and in no way should be seen as an official policy or interpretation of the U.S. government”. [Google Scholar]
- 4.Nath KA. Tubulointerstitial changes as a major determinant in the progression of renal damage. Am J Kidney Dis 20: 1–17, 1992. doi: 10.1016/S0272-6386(12)80312-X. [DOI] [PubMed] [Google Scholar]
- 5.Chung KW, Dhillon P, Huang S, Sheng X, Shrestha R, Qiu C, Kaufman BA, Park J, Pei L, Baur J, Palmer M, Susztak K. Mitochondrial damage and activation of the STING pathway lead to renal inflammation and fibrosis. Cell Metab 30: 784–799, 2019. e785 doi: 10.1016/j.cmet.2019.08.003. [DOI] [PMC free article] [PubMed] [Google Scholar]
- 6.Fragiadaki M, Witherden AS, Kaneko T, Sonnylal S, Pusey CD, Bou-Gharios G, Mason RM. Interstitial fibrosis is associated with increased COL1A2 transcription in AA-injured renal tubular epithelial cells in vivo. Matrix Biol 30: 396–403, 2011. doi: 10.1016/j.matbio.2011.07.004. [DOI] [PubMed] [Google Scholar]
- 7.Gewin LS. Renal fibrosis: Primacy of the proximal tubule. Matrix Biol 68-69: 248–262, 2018. doi: 10.1016/j.matbio.2018.02.006. [DOI] [PMC free article] [PubMed] [Google Scholar]
- 8.Wu H, Lai CF, Chang-Panesso M, Humphreys BD. Proximal tubule translational profiling during kidney fibrosis reveals proinflammatory and long noncoding RNA expression patterns with sexual dimorphism. JASN 31: 23–38, 2020. doi: 10.1681/ASN.2019040337. [DOI] [PMC free article] [PubMed] [Google Scholar]
- 9.Meraz MA, White JM, Sheehan KC, Bach EA, Rodig SJ, Dighe AS, Kaplan DH, Riley JK, Greenlund AC, Campbell D, Carver-Moore K, DuBois RN, Clark R, Aguet M, Schreiber RD. Targeted disruption of the Stat1 gene in mice reveals unexpected physiologic specificity in the JAK-STAT signaling pathway. Cell 84: 431–442, 1996. doi: 10.1016/S0092-8674(00)81288-X. [DOI] [PubMed] [Google Scholar]
- 10.Rawlings JS, Rosler KM, Harrison DA. The JAK/STAT signaling pathway. J Cell Sci 117: 1281–1283, 2004. doi: 10.1242/jcs.00963. [DOI] [PubMed] [Google Scholar]
- 11.Santos CI, Costa-Pereira AP. Signal transducers and activators of transcription-from cytokine signalling to cancer biology. Biochim Biophys Acta 1816: 38–49, 2011. doi: 10.1016/j.bbcan.2011.03.003. [DOI] [PubMed] [Google Scholar]
- 12.Sikorski K, Chmielewski S, Olejnik A, Wesoly JZ, Heemann U, Baumann M, Bluyssen H. STAT1 as a central mediator of IFNgamma and TLR4 signal integration in vascular dysfunction. JAKSTAT 1: 241–249, 2012. doi: 10.4161/jkst.22469. [DOI] [PMC free article] [PubMed] [Google Scholar]
- 13.Huang JS, Chuang LY, Guh JY, Huang YJ, Hsu MS. Antioxidants attenuate high glucose-induced hypertrophic growth in renal tubular epithelial cells. Am J Physiol Renal Physiol 293: F1072–F1082, 2007. doi: 10.1152/ajprenal.00020.2007. [DOI] [PubMed] [Google Scholar]
- 14.Ying WZ, Li X, Rangarajan S, Feng W, Curtis LM, Sanders PW. Immunoglobulin light chains generate proinflammatory and profibrotic kidney injury. J Clin Invest 129: 2792–2806, 2019. doi: 10.1172/JCI125517. [DOI] [PMC free article] [PubMed] [Google Scholar]
- 15.O’Brown ZK, Van Nostrand EL, Higgins JP, Kim SK. The inflammatory transcription factors NFkappaB, STAT1 and STAT3 drive age-associated transcriptional changes in the human kidney. PLoS Genet 11: e1005734, 2015. doi: 10.1371/journal.pgen.1005734. [DOI] [PMC free article] [PubMed] [Google Scholar]
- 16.Shi M, Ma L, Zhou L, Fu P. Renal protective effects of 17beta-estradiol on mice with acute aristolochic acid nephropathy. Molecules 21: 1391, 2016. doi: 10.3390/molecules21101391. [DOI] [PMC free article] [PubMed] [Google Scholar]
- 17.Lin CE, Chang WS, Lee JA, Chang TY, Huang YS, Hirasaki Y, Chen HS, Imai K, Chen SM. Proteomics analysis of altered proteins in kidney of mice with aristolochic acid nephropathy using the fluorogenic derivatization-liquid chromatography-tandem mass spectrometry method. Biomed Chromatogr 32, 2018. doi: 10.1002/bmc.4127. [DOI] [PubMed] [Google Scholar]
- 18.Nlandu-Khodo S, Neelisetty S, Phillips M, Manolopoulou M, Bhave G, May L, Clark PE, Yang H, Fogo AB, Harris RC, Taketo MM, Lee E, Gewin LS. Blocking TGF-beta and beta-catenin epithelial crosstalk exacerbates CKD. J Am Soc Nephrol 28: 3490–3503, 2017. doi: 10.1681/ASN.2016121351. [DOI] [PMC free article] [PubMed] [Google Scholar]
- 19.Ichimura T, Bonventre JV, Bailly V, Wei H, Hession CA, Cate RL, Sanicola M. Kidney injury molecule-1 (KIM-1), a putative epithelial cell adhesion molecule containing a novel immunoglobulin domain, is up-regulated in renal cells after injury. J Biol Chem 273: 4135–4142, 1998. doi: 10.1074/jbc.273.7.4135. [DOI] [PubMed] [Google Scholar]
- 20.Kusaba T, Lalli M, Kramann R, Kobayashi A, Humphreys BD. Differentiated kidney epithelial cells repair injured proximal tubule. Proc Natl Acad Sci U S A 111: 1527–1532, 2014. [Erratum in Proc Natl Acad Sci USA 111: 5754, 2014]. doi: 10.1073/pnas.1310653110. [DOI] [PMC free article] [PubMed] [Google Scholar]
- 21.Lattouf R, Younes R, Lutomski D, Naaman N, Godeau G, Senni K, Changotade S. Picrosirius red staining: a useful tool to appraise collagen networks in normal and pathological tissues. J Histochem Cytochem 62: 751–758, 2014. doi: 10.1369/0022155414545787. [DOI] [PubMed] [Google Scholar]
- 22.Sund S, Grimm P, Reisaeter AV, Hovig T. Computerized image analysis vs semiquantitative scoring in evaluation of kidney allograft fibrosis and prognosis. Nephrol Dial Transplant 19: 2838–2845, 2004. doi: 10.1093/ndt/gfh490. [DOI] [PubMed] [Google Scholar]
- 23.Debelle FD, Vanherweghem JL, Nortier JL. Aristolochic acid nephropathy: a worldwide problem. Kidney Int 74: 158–169, 2008. doi: 10.1038/ki.2008.129. [DOI] [PubMed] [Google Scholar]
- 24.Chang SY, Weber EJ, Sidorenko VS, Chapron A, Yeung CK, Gao C, Mao Q, Shen D, Wang J, Rosenquist TA, Dickman KG, Neumann T, Grollman AP, Kelly EJ, Himmelfarb J, Eaton DL. Human liver-kidney model elucidates the mechanisms of aristolochic acid nephrotoxicity. JCI Insight 2: e95978, 2017. doi: 10.1172/jci.insight.95978. [DOI] [PMC free article] [PubMed] [Google Scholar]
- 25.Liu X, Wu J, Wang J, Feng X, Wu H, Huang R, Fan J, Yu X, Yang X. Mitochondrial dysfunction is involved in aristolochic acid I-induced apoptosis in renal proximal tubular epithelial cells. Hum Exp Toxicol 39: 673–682, 2020. doi: 10.1177/0960327119897099. [DOI] [PubMed] [Google Scholar]
- 26.Pozdzik AA, Salmon IJ, Debelle FD, Decaestecker C, Van den Branden C, Verbeelen D, Deschodt-Lanckman MM, Vanherweghem JL, Nortier JL. Aristolochic acid induces proximal tubule apoptosis and epithelial to mesenchymal transformation. Kidney Int 73: 595–607, 2008. doi: 10.1038/sj.ki.5002714. [DOI] [PubMed] [Google Scholar]
- 27.Quan Y, Jin L, Luo K, Jin J, Lim SW, Shin YJ, Ko EJ, Chung BH, Yang CW. Assessment of nephrotoxicity of herbal medicine containing aristolochic acid in mice. Korean J Intern Med 35: 400–407, 2020. doi: 10.3904/kjim.2018.280. [DOI] [PMC free article] [PubMed] [Google Scholar]
- 28.Yu M, Man YL, Chen MH, Wu LH, Zhou Y, Zhou XL, Chen N, Ma R, Sun LN. Hirsutella sinensis inhibits NLRP3 inflammasome activation to block aristolochic acid-induced renal tubular epithelial cell transdifferentiation. Hum Cell 33: 79–87, 2020. doi: 10.1007/s13577-019-00306-9. [DOI] [PubMed] [Google Scholar]
- 29.Verhoeven Y, Tilborghs S, Jacobs J, De Waele J, Quatannens D, Deben C, Prenen H, Pauwels P, Trinh XB, Wouters A, Smits ELJ, Lardon F, van Dam PA. The potential and controversy of targeting STAT family members in cancer. Semin Cancer Biol 60: 41–56, 2019. doi: 10.1016/j.semcancer.2019.10.002. [DOI] [PubMed] [Google Scholar]
- 30.Hahm K, Lukashev ME, Luo Y, Yang WJ, Dolinski BM, Weinreb PH, Simon KJ, Chun Wang L, Leone DR, Lobb RR, McCrann DJ, Allaire NE, Horan GS, Fogo A, Kalluri R, Shield CF 3rd,Sheppard D, Gardner HA, Violette SM. Alphav beta6 integrin regulates renal fibrosis and inflammation in Alport mouse. Am J Pathol 170: 110–125, 2007. doi: 10.2353/ajpath.2007.060158. [DOI] [PMC free article] [PubMed] [Google Scholar]
- 31.Ma LJ, Yang H, Gaspert A, Carlesso G, Barty MM, Davidson JM, Sheppard D, Fogo AB. Transforming growth factor-beta-dependent and -independent pathways of induction of tubulointerstitial fibrosis in beta6(-/-) mice. Am J Pathol 163: 1261–1273, 2003. doi: 10.1016/S0002-9440(10)63486-4. [DOI] [PMC free article] [PubMed] [Google Scholar]
- 32.Munger JS, Huang X, Kawakatsu H, Griffiths MJ, Dalton SL, Wu J, Pittet JF, Kaminski N, Garat C, Matthay MA, Rifkin DB, Sheppard D. The integrin alpha v beta 6 binds and activates latent TGF beta 1: a mechanism for regulating pulmonary inflammation and fibrosis. Cell 96: 319–328, 1999. doi: 10.1016/S0092-8674(00)80545-0. [DOI] [PubMed] [Google Scholar]
- 33.Pittet JF, Koh H, Fang X, Iles K, Christiaans S, Anjun N, Wagener BM, Park DW, Zmijewski JW, Matthay MA, Roux J. HMGB1 accelerates alveolar epithelial repair via an IL-1beta- and alphavbeta6 integrin-dependent activation of TGF-beta1. PLoS One 8: e63907, 2013. [Erratum in PLoS One. 2013;8(10). doi:10.1371/annotation/88f820f2-18dd-4d3b-8989-68f170b26b04]. doi: 10.1371/journal.pone.0063907. [DOI] [PMC free article] [PubMed] [Google Scholar]
- 34.Puthawala K, Hadjiangelis N, Jacoby SC, Bayongan E, Zhao Z, Yang Z, Devitt ML, Horan GS, Weinreb PH, Lukashev ME, Violette SM, Grant KS, Colarossi C, Formenti SC, Munger JS. Inhibition of integrin alpha(v)beta6, an activator of latent transforming growth factor-beta, prevents radiation-induced lung fibrosis. Am J Respir Crit Care Med 177: 82–90, 2008. doi: 10.1164/rccm.200706-806OC. [DOI] [PMC free article] [PubMed] [Google Scholar]
- 35.Breuss JM, Gallo J, DeLisser HM, Klimanskaya IV, Folkesson HG, Pittet JF, Nishimura SL, Aldape K, Landers DV, Carpenter W, , et al. Expression of the beta 6 integrin subunit in development, neoplasia and tissue repair suggests a role in epithelial remodeling. J Cell Sci 108: 2241–2251, 1995. [DOI] [PubMed] [Google Scholar]
- 36.Huang F, Wang Q, Guo F, Zhao Y, Ji L, An T, Song Y, Liu Y, He Y, Qin G. FoxO1-mediated inhibition of STAT1 alleviates tubulointerstitial fibrosis and tubule apoptosis in diabetic kidney disease. EBioMedicine 48: 491–504, 2019. doi: 10.1016/j.ebiom.2019.09.002. [DOI] [PMC free article] [PubMed] [Google Scholar]
- 37.Huang F, Zhao Y, Wang Q, Hillebrands JL, van den Born JJL, An T, Qin G. Dapagliflozin attenuates renal tubulointerstitial fibrosis associated with type 1 diabetes by regulating STAT1/TGFbeta1 signaling. Front Endocrinol (Lausanne) 10: 441, 2019. doi: 10.3389/fendo.2019.00441. [DOI] [PMC free article] [PubMed] [Google Scholar]
- 38.Wang Y, John R, Chen J, Richardson JA, Shelton JM, Bennett M, Zhou XJ, Nagami GT, Zhang Y, Wu QQ, Lu CY. IRF-1 promotes inflammation early after ischemic acute kidney injury. JASN 20: 1544–1555, 2009. doi: 10.1681/ASN.2008080843. [DOI] [PMC free article] [PubMed] [Google Scholar]
- 39.Kemmner S, Bachmann Q, Steiger S, Lorenz G, Honarpisheh M, Foresto-Neto O, Wang S, Carbajo-Lozoya J, Alt V, Schulte C, Chmielewski S, Bluyssen HAR, Heemann U, Baumann M, Lech M, Schmaderer C. STAT1 regulates macrophage number and phenotype and prevents renal fibrosis after ischemia-reperfusion injury. Am J Physiol Renal Physiol 316: F277–F291, 2019. doi: 10.1152/ajprenal.00004.2018. [DOI] [PubMed] [Google Scholar]
- 40.Meng X-M, Nikolic-Paterson DJ, Lan HY. TGF-beta: the master regulator of fibrosis. Nat Rev Nephrol 12: 325–338, 2016. doi: 10.1038/nrneph.2016.48. [DOI] [PubMed] [Google Scholar]
- 41.Xie LB, Chen B, Liao X, Chen YF, Yang R, He SR, Pei LJ, Jiang R. LINC00963 targeting miR-128-3p promotes acute kidney injury process by activating JAK2/STAT1 pathway. J Cell Mol Med 24: 5555–5564, 2020. doi: 10.1111/jcmm.15211. [DOI] [PMC free article] [PubMed] [Google Scholar]
- 42.Tsogbadrakh B, Ryu H, Ju KD, Lee J, Yun S, Yu KS, Kim HJ, Ahn C, Oh KH. AICAR, an AMPK activator, protects against cisplatin-induced acute kidney injury through the JAK/STAT/SOCS pathway. Biochem Biophys Res Commun 509: 680–686, 2019. doi: 10.1016/j.bbrc.2018.12.159. [DOI] [PubMed] [Google Scholar]
- 43.Tatler AL, Goodwin AT, Gbolahan O, Saini G, Porte J, John AE, Clifford RL, Violette SM, Weinreb PH, Parfrey H, Wolters PJ, Gauldie J, Kolb M, Jenkins G. Amplification of TGFbeta induced ITGB6 gene transcription may promote pulmonary fibrosis. PLoS One 11: e0158047, 2016. doi: 10.1371/journal.pone.0158047. [DOI] [PMC free article] [PubMed] [Google Scholar]
- 44.Townsend PA, Scarabelli TM, Davidson SM, Knight RA, Latchman DS, Stephanou A. STAT-1 interacts with p53 to enhance DNA damage-induced apoptosis. J Biol Chem 279: 5811–5820, 2004. doi: 10.1074/jbc.M302637200. [DOI] [PubMed] [Google Scholar]
- 45.Kathuria P, Singh P, Sharma P, Wetmore SD. Replication of the aristolochic acid I adenine adduct (ALI-N(6)-A) by a model translesion synthesis DNA polymerase: structural insights on the induction of transversion mutations from molecular dynamics simulations. Chem Res Toxicol 33: 2573–2583, 2020. doi: 10.1021/acs.chemrestox.0c00183. [DOI] [PubMed] [Google Scholar]
- 46.Wang H, Zhang Y, Xia F, Zhang W, Chen P, Yang G. Protective effect of silencing Stat1 on high glucose-induced podocytes injury via Forkhead transcription factor O1-regulated the oxidative stress response. BMC Mol Cell Biol 20: 27, 2019. doi: 10.1186/s12860-019-0209-0. [DOI] [PMC free article] [PubMed] [Google Scholar]
- 47.Quintas-Cardama A, Vaddi K, Liu P, Manshouri T, Li J, Scherle PA, Caulder E, Wen X, Li Y, Waeltz P, Rupar M, Burn T, Lo Y, Kelley J, Covington M, Shepard S, Rodgers JD, Haley P, Kantarjian H, Fridman JS, Verstovsek S. Preclinical characterization of the selective JAK1/2 inhibitor INCB018424: therapeutic implications for the treatment of myeloproliferative neoplasms. Blood 115: 3109–3117, 2010. doi: 10.1182/blood-2009-04-214957. [DOI] [PMC free article] [PubMed] [Google Scholar]
- 48.Ramakrishnan V, Kimlinger T, Haug J, Timm M, Wellik L, Halling T, Pardanani A, Tefferi A, Rajkumar SV, Kumar S. TG101209, a novel JAK2 inhibitor, has significant in vitro activity in multiple myeloma and displays preferential cytotoxicity for CD45+ myeloma cells. Am J Hematol 85: 675–686, 2010. doi: 10.1002/ajh.21785. [DOI] [PMC free article] [PubMed] [Google Scholar]