Keywords: albumin, carbamylation, cubilin, FcRn, intravital microscopy, protein charge, proximal tubule, small angle X-ray Scattering
Abstract
Chronic kidney disease results in high serum urea concentrations leading to excessive protein carbamylation, primarily albumin. This is associated with increased cardiovascular disease and mortality. Multiple methods were used to address whether carbamylation alters albumin metabolism. Intravital two-photon imaging of the Munich Wistar Frömter (MWF) rat kidney and liver allowed us to characterize filtration and proximal tubule uptake and liver uptake. Microscale thermophoresis enabled quantification of cubilin (CUB7,8 domain) and FcRn binding. Finally, multiple biophysical methods including dynamic light scattering, small-angle X-ray scattering, LC-MS/MS and in silico analyses were used to identify the critical structural alterations and amino acid modifications of rat albumin. Carbamylation of albumin reduced binding to CUB7,8 and FcRn in a dose-dependent fashion. Carbamylation markedly increased vascular clearance of carbamylated rat serum albumin (cRSA) and altered distribution of cRSA in both the kidney and liver at 16 h post intravenous injection. By evaluating the time course of carbamylation and associated charge, size, shape, and binding parameters in combination with in silico analysis and mass spectrometry, the critical binding interaction impacting carbamylated albumin’s reduced FcRn binding was identified as K524. Carbamylation of RSA had no effect on glomerular filtration or proximal tubule uptake. These data indicate urea-mediated time-dependent carbamylation of albumin lysine K524 resulted in reduced binding to CUB7,8 and FcRn that contribute to altered albumin transport, leading to increased vascular clearance and increased liver and endothelial tissue accumulation.
INTRODUCTION
Carbamylation is a nonenzymatic addition of a carbamoyl moiety to either a primary amine or a free sulfhydryl group of a protein by urea-derived isocyanate (1). Carbamylation can change protein charge, conformation, enzymatic activity, hormonal activity, binding properties, receptor-drug interaction, and cellular expression and responses (2). It is well documented that individuals with chronic kidney disease (CKD) have a 10- to 20-fold higher incidence of cardiovascular mortality, and the level of carbamylated albumin correlates with the blood urea nitrogen level (BUN) (3). This has been assumed to be due to elevated urea levels but could also be due to reduced renal clearance secondary to glomerular filtration rate (GFR) reduction in CKD. Patients with CKD who reach end-stage renal disease (ESRD) have higher levels of carbamylated albumin, which has been identified as a risk factor for mortality in patients with CKD and ESRD (3).
Albumin is composed of three homologous domains that interact with a variety of ligands, fatty acids, drugs, end products, proteins, and many small molecules such as sugars and cyanates (4, 5). Serum albumin, because of its long serum half-life of 19 days, undergoes multiple nonenzymatic, post-translational modifications mediated by both small and large molecules (6). These alterations lead to abnormal cellular handling and modified interactions with its binding partners and ligands (7, 8). Because of these changes, albumin’s cellular metabolism can be altered, contributing to certain diseases and health complications. For instance, studies have shown that glycated proteins, including albumin, derived from modification by sugars, are associated with hyperglycemia and albuminuria (9, 10). In addition, many studies have implicated albumin-bound uremic toxins as contributing to cellular inflammation and clinical abnormalities. Moreover, it has been shown that carbamylated albumins are more inflammatory and nephrotoxic than unmodified albumin in amphibian kidneys (11). Thus, an understanding of how carbamylated albumin is processed by proximal tubule (PT) cells and how it contributes to kidney and cardiovascular toxicity is of utmost importance because of known risk factors for mortality in patients with kidney disease.
MATERIALS AND METHODS
Animals
Munich Wistar Frömter (MWF) rats (9–12 wk old) were derived from a colony generously provided by Dr. Roland Blantz (UCSF, San Diego, CA.) and maintained in the Indiana University LARC facility. Male Sprague-Dawley (SD) rats were purchased from Harlan. All rats received water and food ad libitum throughout the study. All experiments followed NIH Guide for the Care and Use of Laboratory Animals guidelines and were approved by the Animal Care and Use Committee at the Indiana University School of Medicine.
Proteins
Rat serum albumin (RSA) was purchased from Sigma and the carbamylated is designated cRSA. Soluble rat FcRn (FcRn) was purified from Chinese hamster ovary cell lines as described earlier (8). The cubilin 7,8 protein (CUB7,8) containing a COOH-terminus 6X HIS domain was produced using the Thermo Fisher Expi293 Expression system. Purification consisted of a NiNTA column (Qiagen) followed by Gel Filtration on a Toyopearl HW55S column. CUB7,8 was deglycosylated with PNGaseF using the nondenaturing reaction conditions as outlined by New England Biolabs.
Carbamylated Albumins and Fluorescent Tagging
RSA, 150 µM, was treated with 1 M potassium cyanate (KCNO) for different incubation times (30 min, 2 h, and 4 h) at 37°C. KCNO was removed by 48 h of dialysis against H2O with a minimum of three changes to achieve >1,000-fold buffer exchange before aliquoting and lyophilization (Spectrum Float-A-Lyzer G2 dialysis device, Repligen Co., Waltham, MA). Carbamylated rat albumins are abbreviated as follows: 30 min = cRSA30min, 2 h = cRSA2h, and 4 h = cRSA4h.
Albumins were conjugated with a fluorescent tag (Texas Red-X, succinimidylester #474, AAT Bioquest or Oregon Green-X succinimidylester #06185, Thermo Fisher) using standard procedures to consistently achieve a final dye:protein molar ratio of 1:1. Briefly, proteins were dissolved in 100 mM sodium bicarbonate buffer, pH 8.3, at 15 mg/mL, and the dye dissolved in HPLC grade N′N-dimethylformamide (DMF) (Millipore Sigma, Burlington, MA) and mixed for 1 h at room temperature on a rocker. The solution was then dialyzed in 0.9% normal saline for 2 days at 4°C with 5 × 4 L changes to remove all hydrolyzed, unconjugated free dye. At the 1:1 ratio, the six-carbon -X-spacer covalent link does not alter binding to CUB7,8 or FcRn (8).
Carbamylated albumins for intravital studies used the 1:1 fluorescent tagged albumin and followed the same KCNO carbamylation method as used for unlabeled albumin.
Fluorescent Compounds
In addition to the fluorescent albumins studied, three other fluorescent compounds were infused to label other subcellular structures. A 10 kDa Cascade Blue-dextran (Fisher #D1976) was used as a lysosome marker to label the lysosomes of renal proximal tubule cells and vascular endothelial cells of the liver. It was infused at a dose of 4–6 mg/kg. When studying proximal tubule albumin/lysosomal colocalization, the dextran was given 16 h before imaging, and for intravital liver studies, the dextran was given intravenously 60 min before imaging. FluoSpheres [carboxylate-modified 2.0 µm blue, 365/415 (Thermo Fisher #F8824)] were initially dialyzed in water to remover the sodium azide preservative. Approximately 100 µL of the dialyzed stock was diluted with 400 µL of 0.9% saline and infused in 1 h before intravital liver imaging to label the Kupffer cells, along with the Cascade Blue-dextran. These two markers are easily distinguished; the Cascade Blue-dextran produces small, very blue punctate accumulations, whereas the FluoSpheres are circular, uniformly 2.0 µm in size, and cyan in color. Hoechst 33342 (Fisher #H3570) was given intravenously at a dose of ∼1 mg/kg to label cell nuclei.
Two-Photon Microscopy
All imaging was conducted using an Olympus FV1000 microscope adapted for two-photon microscopy with high-sensitivity gallium arsenide nondescanned photomultiplier tubes or a Leica Dive SP-8 multiphoton microscope (Leica Microsystems, Buffalo Grove, IL) using the same acquisition parameters as that used on the Olympus FV1000(12, 13). Intravital hepatic imaging was conducted as reported by Dunn et al. (14). Animals were anesthetized with isofluorane. A jugular venous line was used to introduce the fluorescent probes [albumin, 10 kDa Cascade Blue-dextran (Fisher #D1976), FluoSpheres carboxylate-modified microspheres, 2.0 µm blue fluorescent 365/415 (Thermo Fisher #F8824), Hoechst 33342 nuclear dye (Fisher #H3570)] in 0.9% saline as described for each study. As previously described, animal body temperature, saline bath temperature in the dish, and heart rate and blood pressure (90 mmHg average) were measured using LabChart 6 (AD Instruments, Colorado Springs, CO). All rats had normal body temperature during the imaging procedure, and blood pressure and hydration were maintained by saline infusion (12, 15). Once the intravital renal images were acquired, the rats were flushed with 60 mL of PBS via heart perfusion, followed by dissection of the liver and kidney, and immersion-fixed in 4% paraformaldehyde (Electron Microscopy Sciences, Redding, CA) in PBS (pH 7.4). These tissues were imaged after overnight fixation using the same imaging parameters.
Rat Clearance Experiments
Male SD rats (180–220 g) were acclimated for 4 days. Blood and 24-h urines were obtained to establish baseline values. Rats were anesthetized with isofluorane, and 1.5 mg of fluorescently tagged (Oregon Green-X or Texas Red-X) control and carbamylated RSA were injected by tail vein. Blood was collected post injection at 15 min, 2 h, and 24 h in heparinized tubes, spun, and then assayed for fluorescence using a Molecular Devices SpectraMax M5 plate reader. The 15-min collection time point was set to 100%, and the decrease in fluorescence quantified at 2 h and 24 h. All rats had normal serum creatinine and urine protein values before infusion and at the end of the study.
Image Analysis
Glomerular sieving coefficients.
Glomerular sieving coefficients (GSCs) were determined using our previously published method (13). A series of publications have described in detail the proper parameters to set the detector offset (black level), which is crucial for correctly detecting the low-intensity signal coming from fluorescent albumin in Bowman’s space (13, 16–18). Briefly, z-stack images of the glomerulus before fluorescent RSA infusion were collected to enable background fluorescent levels of Bowman’s space and glomerular capillaries to be quantified. These values were subtracted from the same region after the fluorescent albumin infusion.
Quantitative analysis of PT S1 albumin uptake and colocalization to dextran.
For these 2-h uptake studies, the animals were given 10 kDa Cascade Blue-dextran intravenously 16 h before imaging. Multiple studies have documented that dextrans are delivered to and get accumulated in lysosomes and remain present for over 24 h (15, 19–22). Different albumins were infused following collection of preimages at our standard gain and power settings using our published method (18, 23). As we have shown, once preimages are collected, infusion of fluorophore conjugated albumin must proceed carefully to avoid any saturation that would impair the accurate calculation of GSCs (13, 16–18). To control for natural variability between animals when quantifying albumin uptake and lysosome delivery, the measured Texas Red-RSA (TR-RSA) capillary intensity for each S1 region was quantified at 7–13 min post infusion. (These capillary values are calculated as done for the GSC measurements.) The capillary values for each animal were averaged and used to normalize capillary intensity between animals. To quantify the total albumin, and albumin in lysosomes (defined as Cascade Blue-dextran region), an ImageJ macro was used. The macro consists of the following steps: 1) A region of interest (ROI) is drawn around the S1 region of both pre- and postinfusion images. The S1 region is identified by having an opening to the glomerulus. 2) The average intensity in all preimages is calculated and subtracted from postinfusion image. This is done separately for each animals’ values. 3) The subtracted TR postinfusion image is used to make a mask defining the total RSA whose total mean intensity is calculated. 4) The total RSA mask is then used to select colocalization with lysosomes that are defined by an Otsu dark Auto Threshold. 5) The mean intensity of the TR-RSA in the lysosome region is then calculated. These calculations were performed using ImageJ. Graphing and statistical analyses were performed using Microsoft Excel (Redmond, CA), KaleidaGraph (Synergy Software, Reading, PA), and GraphPad Prism 5 (La Jolla, CA). In total, three rats received TR-RSA with 21 S1s analyzed, and in total, four rats received TR-cRSA with 25 S1s analyzed. Results are presented as means ± SE.
Normal and carbamylated albumin dosing.
The fluorescence intensity of each albumin was read on a CLARIOstar spectrophotometer (BMG Labtech, Inc. Cary, NC) to monitor and control for any fluorescent albumin variation. This was important, as no preimages or early time points would be collected as with the 2-h uptake studies. The cRSAs were made from presynthesized TR-RSA; the values of fluorescence units per microgram per milliliter were nearly identical, and plasma values taken at 5 min post infusion verified no difference in fluorescent albumins that were infused.
Quantitation of vascular/interstitial accumulation of albumins in renal tissues.
Thirty-micrometer three-dimensional (3-D) volumes of renal glomeruli and S1 segments were taken to assess accumulation in proximal tubules. These same images were reconstructed, and the areas of extratubular accumulation were highlighted through thresholding of higher intensity values using Metamorph v7.1 (San Jose, CA). For RSA, the tubular accumulation nearly matched the intensity of extrarenal accumulation, so the nearly saturating regions of the tubules (which were always at the center) were highlighted using the free-hand draw tool, and values of zero were pasted onto those regions to prevent further detection when thresholding the high values in the interstitial/vascular space. The highlighted values were recorded as number of pixels, and ratioed to the total number of pixels in a 512 × 512 region (262,144 pixels). The percentage ratios were then normalized to the normal albumin values and “fold increases” reported. This also was used to provide a measurement in square micron of the respective RSA in the endothelial/interstitial area.
Microscale Thermophoresis
Microscale thermophoresis (MST) was used to characterize binding affinity between purified FcRns, CUB7,8, and albumin. Binding assays were performed with the Monolith NT.115 MST device using standard capillaries (NanoTemper Technologies, Munich, Germany). Measurements were performed at 25°C in 67 mM NaPO4 buffer, 150 mM NaCl, and 0.05% Tween 20 at pH 6.0 for FcRn or pH 7.4 + 1 mM CaCl2 for cubilin. The infrared laser power was between 20% and 60%, and 40–70% LED power was used. A laser on time of 30 s and a laser off time of 5 s were used. Data from a minimum of three replicate binding assays were analyzed using NanoTemper analysis, Origin 9.0, and GraphPad Prism software.
SDS-PAGE and Isoelectric Focusing
Novex Tris-glycine gels were used for SDS-PAGE (Thermo Fisher) (24). Novex pH 3–10 isoelectric focusing (IEF) protein gels and SERVA Liquid Mix IEF Marker pI 3.5–10.7 were purchased from Life Technologies. Three to five micrograms of each protein sample were used, and gels were run according to the manufacturer’s protocol, fixed with 12% TCA, and stained with Pierce GelCode Blue (Fisher Scientific).
Size and Zeta Potential Measurement
Measurements were carried out by using a Malvern Zetasizer Nano ZS instrument [Physical Biochemistry Instrumentation Facility (PBIF), Indiana University, Bloomington, IN] in a folded capillary cell (DTS1060). Zeta potential measurements and size distribution were carried out for albumin and its carbamylated versions in aqueous saline solution at 2 mg/mL. Before measurement, protein solutions were filtered (0.22 µm).
SEC-SAXS Data Sample Preparation and Acquisition
Size-exclusion chromatography small angle X-ray scattering (SEC-SAXS) measurements were performed at Advanced Photon Source BioCAT (APS-BioCAT) beamline at Argonne National Laboratory. All proteins were injected onto an inline AKTA pure SEC column (Superdex 200) equilibrated in buffer 137 mM NaCl, 10 mM phosphate, and 2.7 mM KCl, pH 7.4, with 2% glycerol added to avoid radiation damage. Before injection, samples were centrifuged at 14,000 g for 20 min to remove any potential aggregates. The eluted protein was then passed through the SAXS flow cell (1.5-mm ID quartz capillary, 10-µm walls) with UV detection monitored. The Pilatus3 1 M detector was used to record the scattering intensity data. Data reduction and preliminary analysis used BioXTAS RAW (25), with further analyses accomplished with the ATSAS suite (26). For the FcRn-albumin complex, the complex was assembled in 1:1 ratio at room temperature and then injected into the SEC column (Superdex200) equilibrated with pH 6 buffer (137 mM NaCl, 10 mM phosphate, 2.7 mM KCl, and 2% glycerol), and a similar method was used for data collection and reduction. Initially, all the desmeared files were examined for lack of aggregation and polydispersity.
SAXS Data Analysis and Ab-Initio Shape Restoration
Flanking regions of elution peaks were subtracted from the elution peak for buffer subtraction, and the topmost region of the SEC profile was used to create I(Q) versus Q desmeared file in BioXTAS RAW by beamline scientist. The desmeared I(Q) files obtained were further analyzed by SAS data analysis of ATSAS suite. Radius of gyration function of SAS data analysis was used for Guinier analysis assuming globular (Rg) and rod (Rc) approximations. The Kratky plot from desmeared files qualitatively assesses the flexibility, and/or degree of unfolding in the samples was plotted as I(Q)*Q2 versus Q. The maximum linear dimension of the proteins and complex (Dmax) were computed by the distance distribution function of the SAS data analysis, which uses indirect Fourier transformation to calculate the pair-wise distribution function of all the interatomic vectors, P(r). DAMMIF, a rapid ab-initio modeling software of the ATSAS suite, was then used to generate 10 independent uniform density models (27). Averaging and refinement of the model by DAMMIN created the SAXS envelope. SAXS models were selected on the basis of normalized spatial discrepancy (NSD) values to find the best alignment of models, and the DAMMIN refined model was overlaid on albumin-FcRn complex PDBID 4N0F by SUPCOMB function using the homology model by aligning inertial axes in three dimensions. Molecular weight estimation, of the scattering species based on volume correlation (VC), used the DATMOW function of ATSAS (28). FoXS server was used to compute the theoretical SAXS profile of albumin’s crystal structure and compare it with experimental SAXS data (29). PyMOL was used for visualization and representation of SAXS data models (30). The SAXS data collection and beamline parameters are listed in Supplemental Table S1 (all Supplemental Material is available at https://doi.org/10.6084/m9.figshare.12789581).
Mass Spectrometry Sample Preparation
Lyophilized RSA proteins were resuspended in water at the concentration of 1 µg/µL. Ten micrograms of each sample were diluted to 50 µL using 50 mM ABC aqueous solution and denatured at 80°C for 10 min. Denatured proteins were reduced, alkylated, enzymatically digested, and prepared for LC-MS analysis following previous reports with modifications (31, 32). Endoproteinase GluC was used for the enzymatic digestion.
MALDI-TOF Analysis and LC-MS/MS Analysis
Matrix-assisted laser desorption ionization-time of flight (MALDI-TOF) analysis for intact RSAs were performed as previously described with modifications (33). Sinapinic acid was dissolved in 50% ACN/49.9% water/0.1% trifluoroacetic acid at a concentration of 50 mM as the MALDI matrix. For each spectrum, 1,280 shots were lasered (80 subspectrums, 16 shots per subspectrum). A Dionex Ultimate 3000 nano-LC system (Thermo Scientific, San Jose, CA) interfaced to an LTQ Orbitrap Velos mass spectrometer (Thermo Scientific) equiped with a nano-electrospray ionization (nano-ESI) source was used to analyze the proteolysates of RSA samples. For each sample, a 1-µg aliquot of peptides was injected. The separation conditions used in the previous study were adopted to achieve the online purification and separation (31). The LTQ Orbitrap Velos mass spectrometer was operated in positive ion mode. Two scan events in data-dependent acquisition mode were performed. The first scan event was a full MS scan with a detection range of 400–2,000 m/z and mass resolution of 30,000. Whereas in the second scan event, the top 10 intense ions detected from the previous full MS scan were selected to perform collision-induced dissociation (CID) tandem mass spectrometry (MS/MS). The parameters for MS/MS were set as previously reported (31).
Data Processing
Data aquired from LC-MS/MS analyses were first converted to mascot generic files (*.mgf) using Proteomie Discoverer version 1.4 (Thermo Scientific). The .mgf files was then sumitted to MASCOT 2.4.0 (Matrix Science, Boston, MA) for peptide sequencing. Database searching parameters were set to search carbamidomethylation on cysteine as fixed modification. Variable modifications included oxidation and carbamidomethylation on methione, carbamylation on lysine. The enzyme was specified as endoproteinase GluC. A maximum of two missed cleavages of peptides was accounted for. The mass tolerence was set to 10 ppm for precursor mass and 0.5 Da for MS/MS fragment matching. The output of peptide sequencing was exported and submitted to Scaffold version 3.6.3 (Proteome Software Inc., Portland, OR) for further filtering and visulization. Only peptide identifications with a probability >95% were accepted. The quantitation of the peptides was based on the peak area of corresponding extracted ion chromatopghraphic peak. Peaks were constructed in Xcalibur Qual Browser by extracting theoretical m/z values of peptides identified by MASCOT and Scaffold with tolerence of 10 ppm. The integration function in Xcalibur Qual Brower was used to obtain peak area (A). The percentage of carbamylation was calculated as:
Circular Dichroism
Circular dichroism (CD) data were collected on Jasco J-715 CD spectropolarimeter interfaced with thermal sample control and on Spectra Manager software for instrument control and analysis at PBIF (Indiana University, Bloomington, IN).
RESULTS
Vascular Clearance of Carbamylated Albumin Is Increased
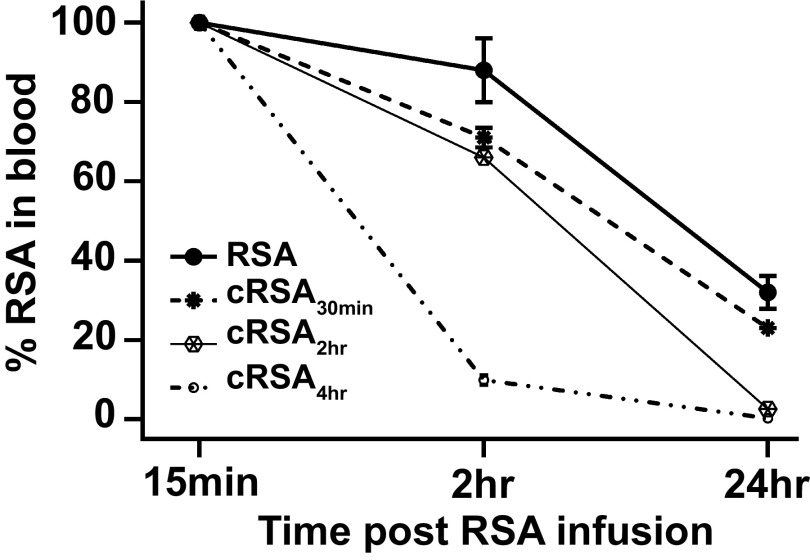
Figure 1 shows the vascular clearance of the carbamylated albumins in SD rats over 24 h. Note the dramatic increase in clearance of the carbamylated albumin at 2 h for cRSA4h. There was a dose response with increasing carbamylation. We previously showed that glycated albumin had an increased vascular clearance (8), whereas another study documented altered intracellular sorting of albumin with decreased FcRn affinity (34). These results are similar to what we measured for glycated albumin (8).
Figure 1.
Vascular clearance of carbamylated rat serum albumin (cRSA) is greater than RSA. Fluorescently tagged (Texas Red-X or Oregon Green-X) RSA) and cRSA were injected into the same rat, and blood was collected post injection at 15 min, 2 h, and 24 h. Each albumin was evaluated in four rats (male Sprague–Dawley rats, 180–220 g) that received both control and carbamylated albumin. The 15-min collection time point was set to 100%, and the decrease in fluorescence followed at 2 h and 24 h. Note the dose-dependent increase in carbamylation was associated with an increase in vascular clearance. GraphPad Prism was used to graph means ± SD for each 2- and 24-h time point.
Two-Photon Imaging Shows No Increase in the GSC for Carbamylated Albumin and a Similar Rate of S1 Uptake
To evaluate whether glomerular filtration or PT uptake of albumin was impacted by carbamylation, MWF rats were infused with fluorophore-conjugated carbamylated albumin, cRSA4h. The GSC for cRSA was 0.010 ± 0.004 consistent with our previously published values for RSA in MWF rats 0.010 ± 0.001 (12). To evaluate albumin uptake/accumulation in S1 PTs, intravital microscopy was performed 16 h following albumin infusion. Figure 2 shows representative high-power images from five time points highlighting the appearance of RSA (Fig. 2B) and cRSA4h (Fig. 2D) along with the corresponding Cascade Blue-dextran signal for each image (Fig. 2, A and C). ImageJ LUT HiLow (saturated pixels appear red) was used to follow RSA and cRSA4h accumulation. Total S1 accumulation/uptake for each RSA was quantified and is presented in Fig. 2E. Both RSA and cRSA4h were rapidly taken up, with no significant difference observed at these time points. Figure 2F shows the amount of each RSA colocalized with dextran infused 16 h before the albumins. A red-green color overlay of these images is shown in Supplemental Fig. S1. Previous studies have documented differences in trafficking due to FcRn interaction alterations (34–37). Under the in vivo and labeling conditions used here, no significant changes in dextran colocalization for either RSA or cRSA4h were observed.
Figure 2.
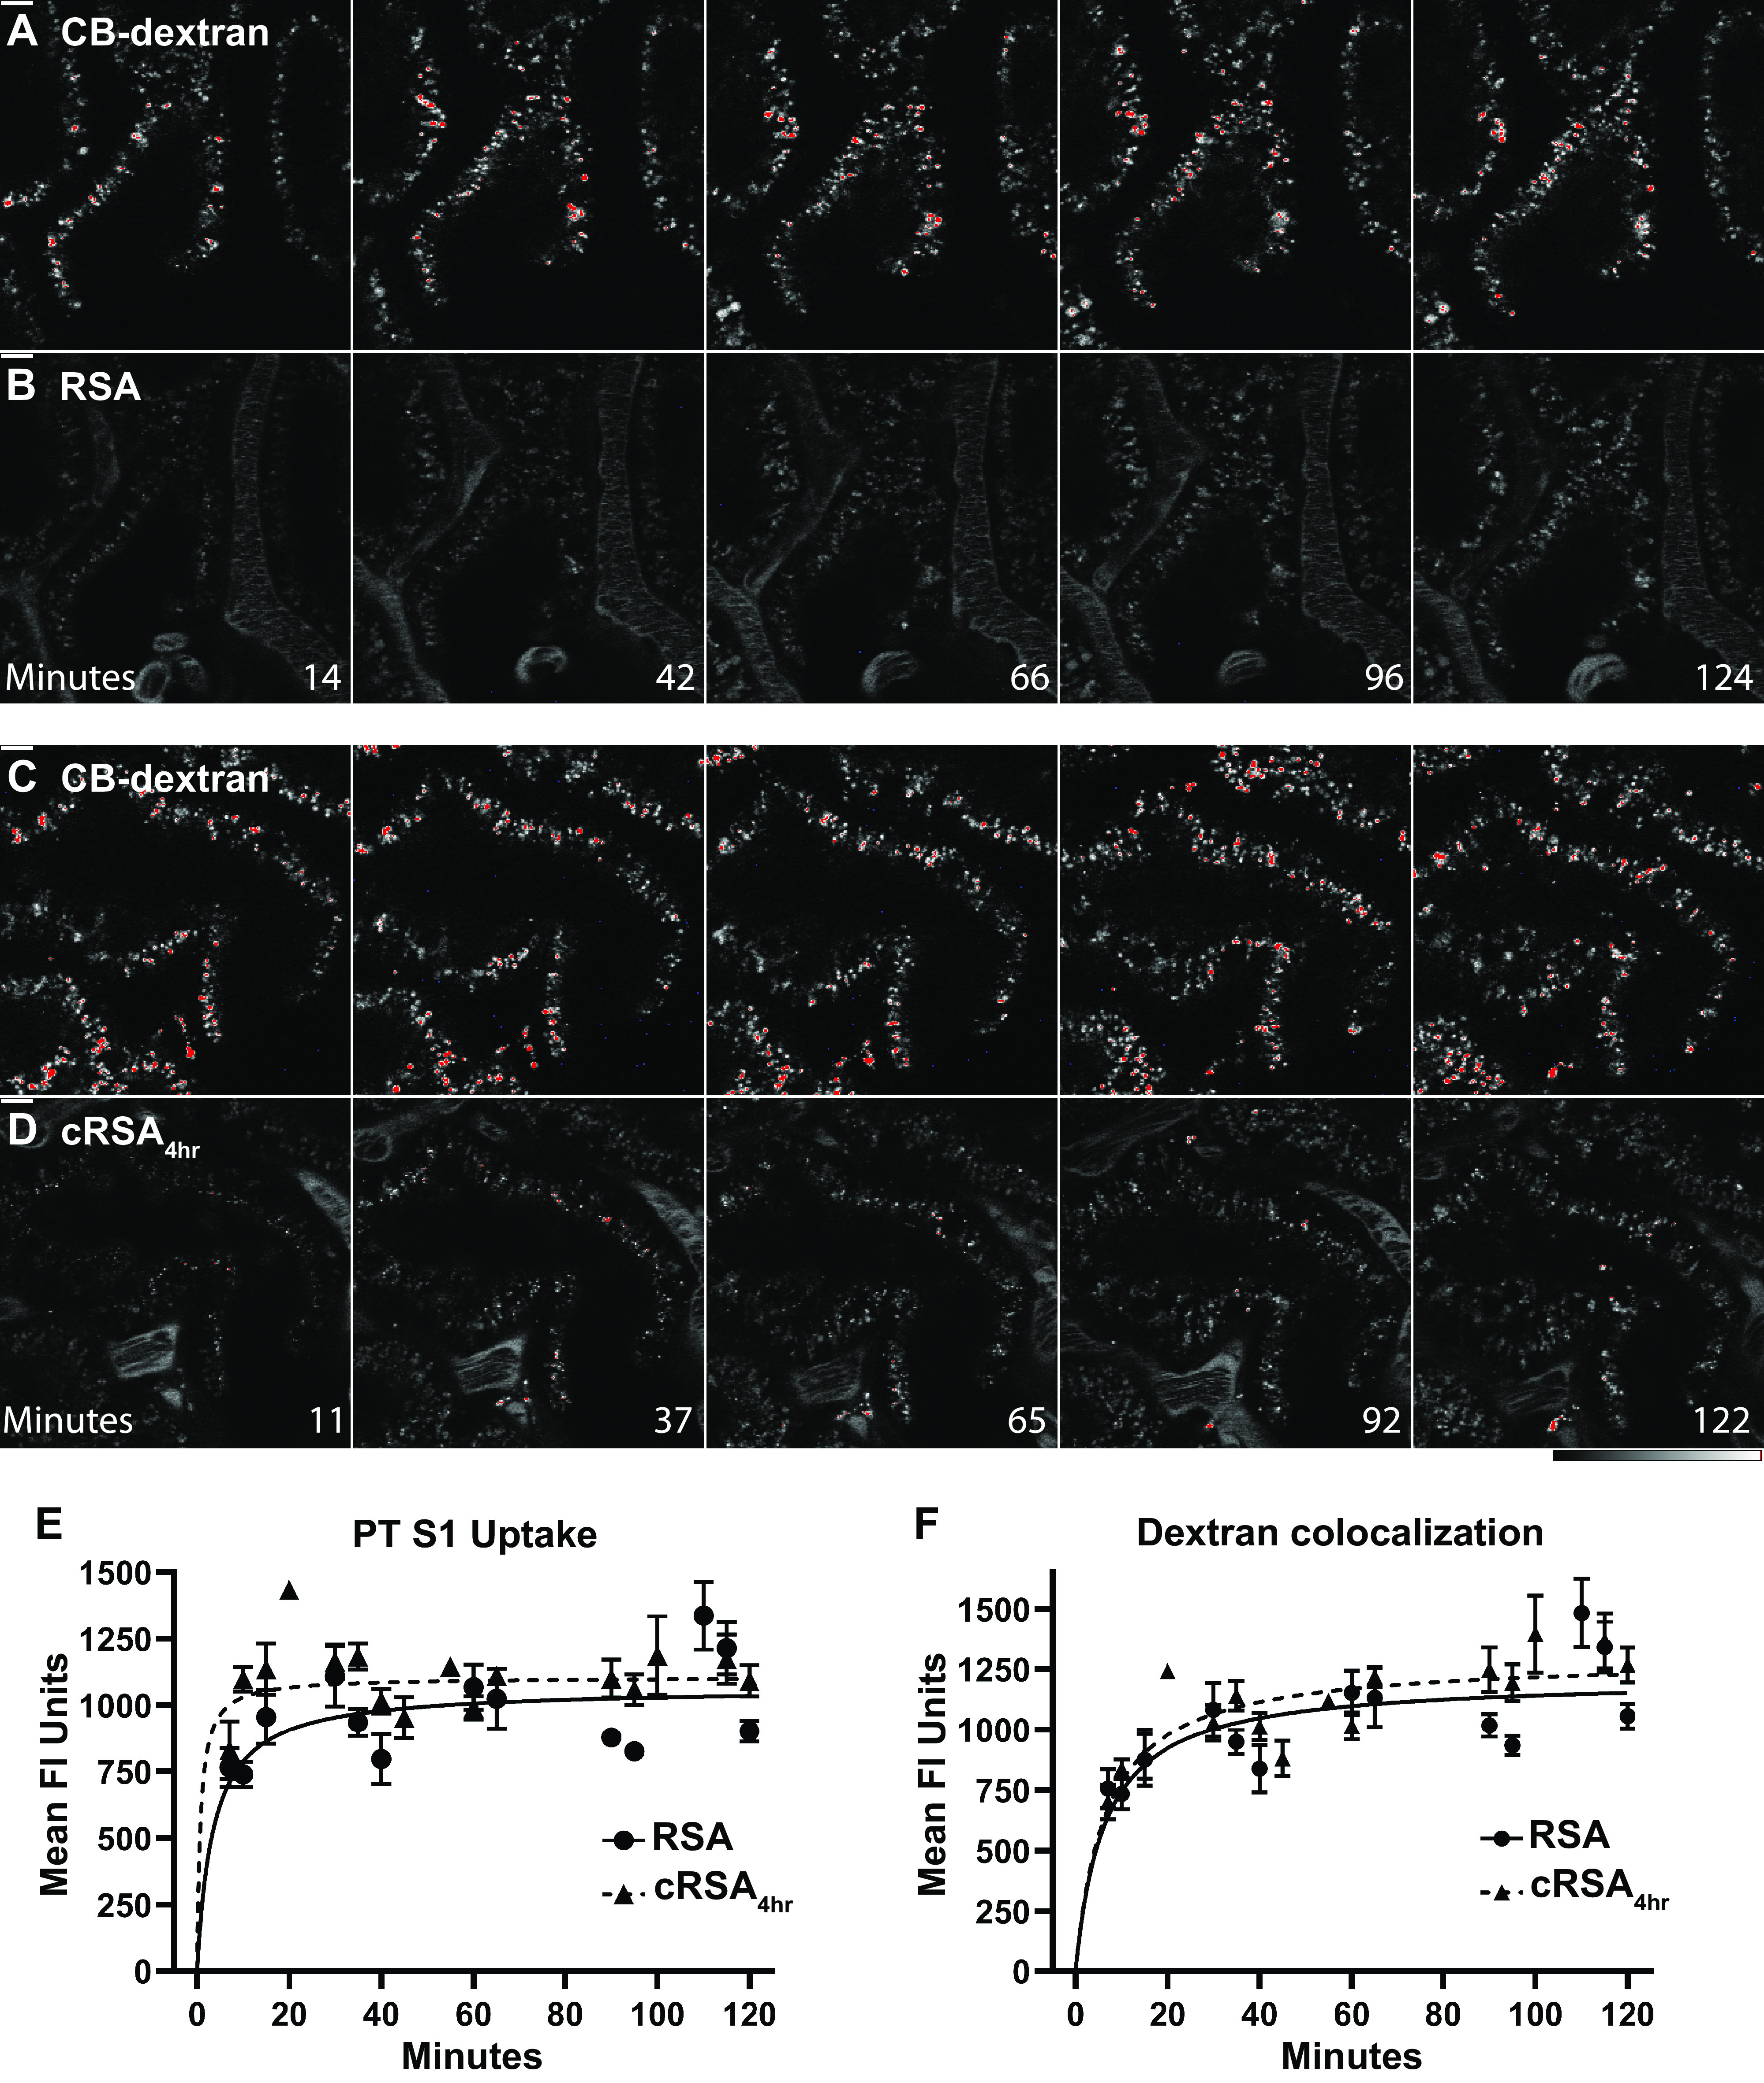
Intravital 2-photon microscopy shows uptake of rat serum albumin (RSA) (B) and carbamylated RSA (cRSA)4h (D) over 2 h along with corresponding 10 kDa Cascade Blue (CB)-dextran signal infused 16 h before imaging (A and C). ImageJ HiLow LUT was used for (A–D) (bottom right bars). Bars in the top left of the initial time points are 10 µm, and images are at the same magnification. All images are single planes and show a representative S1 region from each rat followed for 2 h following the respective albumin infusion. In E, quantification of proximal tubule (PT) S1 uptake for both RSA and cRSA4h is shown. Note that each have a similar rate of S1 uptake. To quantify dextran accumulation (F), the same background-subtracted region of interest (ROI) was used along with an automated Otsu dark Auto Threshold to define the CB-dextran locations. The background-subtracted mean fluorescence of RSA in the dextran region was then calculated and graphed. A minimum of 3 rats and 21 S1 segments were analyzed at each time interval. GraphPad Prism was used to graph means ± SE. A color overlay of these images is available (see Supplemental Fig. S1).
Carbamylated Albumin Accumulates in the Liver 16 h Post Infusion
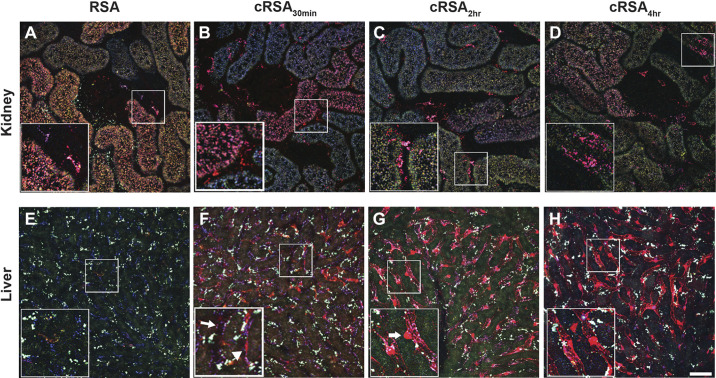
The increased vascular clearance of cRSA suggested that other tissues involved in albumins’ homeostasis could be having a role. Because the liver is a key player in albumin metabolism, and FcRn has been shown to be involved in its handling in hepatocytes and endothelial cells, the presence of cRSA was explored (38–40). Figure 3 shows the significant accumulation of cRSA 16 h after infusion [cRSA30min (Fig. 3F), cRSA2h (Fig. 3G), and cRSA4h (Fig. 3H)]; note the lack of RSA present at this time point (Fig. 3E). These accumulations appear to clearly highlight continuous regions of the hepatic vasculature consistent with endothelial cell uptake. The kidney, at 16 h post infusion, showed the expected presence of RSA in the PT (Fig. 3A), as we have previously observed (13). However, there was reduced presence of cRSAs in the kidney PTs at 16 h cRSA30min (Fig. 3B), cRSA2h (Fig. 3C), and cRSA4h (Fig. 3D). Interestingly, cRSA was present in distinct accumulations often at the base of PTs, i.e., endothelial cells [see insets in Fig. 3, B–D). The individual channels for Fig. 3 are shown in Supplemental Fig. S2. Quantification of this endothelial/interstitial albumin revealed a 3.6-fold significant increase for cRSA2h (t test, P ≤ 0.009) and a 2.3-fold significant increase for cRSA4h (t test, P ≤ 0.030) over RSA (Fig. 4).
Figure 3.
Carbamylated albumin accumulates in endothelial and interstitial cells within the kidney and liver 16 h post infusion. A–D: three-dimensional (3-D)-reconstructed 30-µm images of the proximal tubule (PT) taken in vivo 16 h after infusion of 10-kDa Cascade Blue-dextran and Texas Red (TR)-labeled albumins. Accumulation in kidney interstitial areas along the peritubular vasculature and surrounding Bowman’s space revealed a 3.6-fold increase for carbamylated rat serum albumin (cRSA2h) (C) and a 2.3-fold increase for cRSA4h (D) over RSA (A). Although not readily visible in these color micrographs, circulating plasma levels of TR-RSA were still detectable in only normal RSA-treated rats; both carbamylated albumins had no discernible circulating levels within the plasma at this time point. E–H: 3-D reconstructions of matched formaldehyde-fixed liver tissue. Note the dramatic accumulation of cRSAs relative to RSA in the liver tissues. The accumulation of cRSA2h and cRSA4h (G and H, respectively) appears to clearly highlight continuous regions of the hepatic vasculature. The inset in G highlights what appears to be a Kupffer cell (arrow) localized outside the microvasculature, whereas apparent flat endothelials cells have significant accumulation contained within the vascular lumen (H, inset, right of asterisk). F: accumulation of cRSA30min. Although cRSA30min lacks the same continuous accumulation seen in G and H, the inset shows two blood vessels—one with little to no accumulation of cRSA30min (arrow) and the other with significant uptake along the vessel (arrowhead). Bars = 50 µm in full-sized images and 25 µm in enlargements. Note that the white punctate signal, more prominent in the liver, is autofluorescence. Individual channels for each figure are available (see Supplemental Fig. S2).
Figure 4.
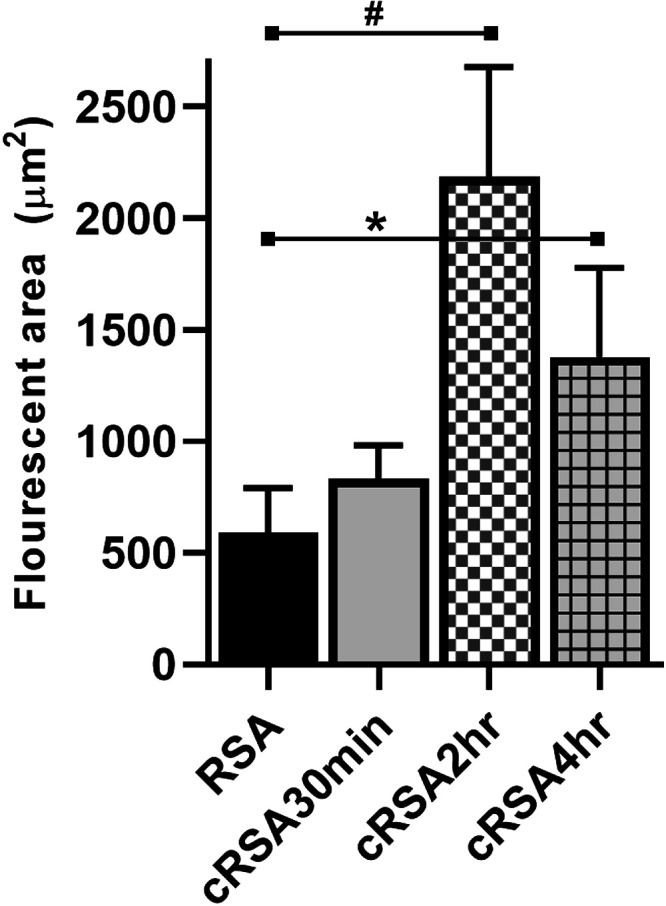
Albumin in kidney endothelial/interstitial regions. Quantification of albumins in kidney endothelial/interstitial regions showed significant increases in accumulation between rat serum albumin (RSA) vs. carbamylated RSA (cRSA)2h. #P < 0.05 and RSA vs. cRSA4h; *P < 0.05.
Carbamylated Albumin is Rapidly Taken up in the Liver
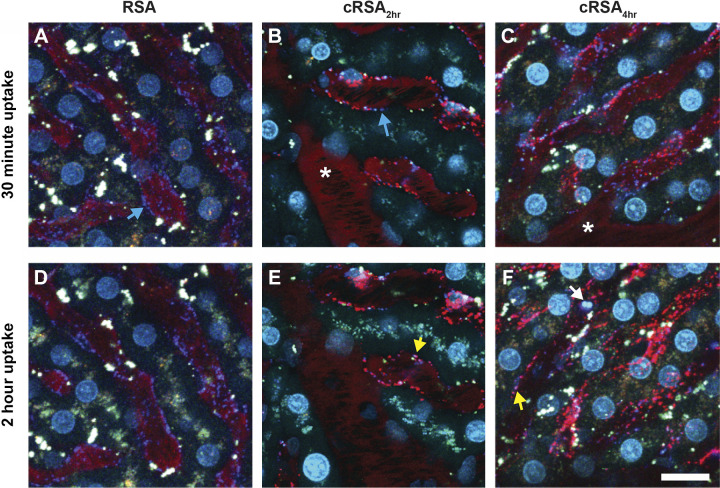
Intravital imaging was conducted to better determine the kinetics of carbamylated albumin (cAlb) uptake in the liver. Dextran (marker of fluid-phase endocytosis), 2-µm beads (marker for Kupffer cells), and Hoeschst nuclear dye were preinfused to label lysosomes, Kupffer cells, and nuclei, respectively. Images were collected for up to 2 h following the albumin(s) infusion. Figure 5 shows an early (30-min) and late (2-h) time point image for RSA (Fig. 5, A and D), cRSA2h (Fig. 5, B and E), and cRSA4h (Fig. 5, C and F). Note the clear linear staining and punctate distribution often next to elongated nuclei—both are consistent with significant liver sinusoidal endothelial cell uptake. Kupffer cells also had uptake, whereas hepatocyte uptake was not as evident. No cRSA30min uptake in the liver was observed at this early time point, nor did we observe RSA uptake. The individual channels for Fig. 5 are shown in Supplemental Fig. S3.
Figure 5.
Carbamylated albumin (cAlb) is rapidly taken up in the liver. B and C: accumulation of carbamylated rat serum albumin (cRSA)2h and cRSA4h, respectively, within the smaller hepatic blood vessels at 30 min post infusion. The uptake of cAlb occurs rapidly with clear punctate vesicles visible within 10 min (data not shown). Cyan arrows (A and B) identify the lysosomes of the vascular endothelial cells via accumulation of 10-kDa Cascade Blue-dextran. Yellow arrows (E and F) show colocalization of the internalized albumin (red) and dextran (blue) to produce a magenta color. The white arrow in F shows two of the blue FluoSphere microspheres. Normal albumin (A and D) and cAlb30min (data not shown) showed little to no accumulation even after 2 h. An area that consistently lacked uptake for all albumins were the larger vessels (see * in B and C). Bars = 10 µm. Individual channels for each figure are available (see Supplemental Fig. S3).
Albumin Binding to Both Cubilin and FcRn Is Reduced by Carbamylation
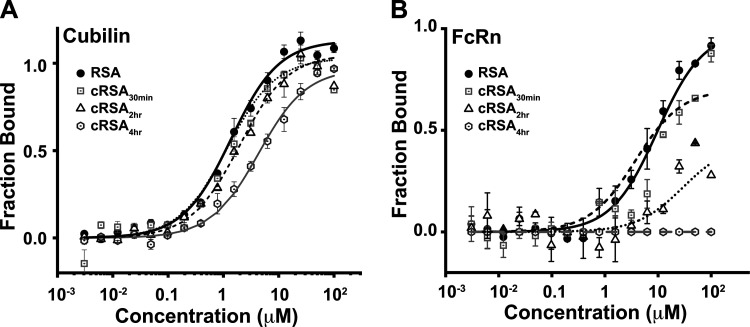
The intravital imaging studies showed no significant difference between the control and carbamylated albumins in the kidneys (Fig. 2), but by 16 h post infusion, significant differences were observed in both the kidney and liver (Fig. 3). To address whether albumin binding to cubilin or FcRn is affected by carbamylation of albumin binding was evaluated with MST using the CUB7,8 domain for cubilin (Fig. 6A) and the sFcRn domain for FcRn (Fig. 6B and Table 1). Note that the albumin affinity for both these receptors is consistent with our previous results for FcRn and what others have observed for both cubilin (whole cubilin and CUB7,8) and FcRn (8, 41–43). However, CUB7,8 affinity was reduced >10-fold for cRSA4h. A more significant reduction was observed for FcRn, leading to no binding for the highly carbamylated cRSA4h. The reduced binding to CUB7,8 suggests that the normal uptake observed for cRSA4h (Fig. 2) may be due to albumins’ interaction with other sites of cubilin or possibly a higher order structure of cubilin is present (44, 45). Alternatively, albumin may be internalized by a fluid-phase mechanism. However, the reduced binding to FcRn would result in albumin unable to undergo transcytosis and being transported to lysosomes for degradation (34, 46).
Figure 6.
Carbamylation reduces rat serum albumin (RSA) binding affinity to both cubilin (A) and FcRn (B). Microscale thermophoresis (MST) was used to characterize albumin-binding affinity between purified cubilin (CUB7,8 domain) or FcRn. Binding assays were performed with the Monolith NT.115 microscale thermophoresis device using standard capillaries (NanoTemper Technologies, Munich, Germany). Measurements were performed at 25°C in 67 mM NaPO4 buffer, 150 mM NaCl, and 0.05% Tween 20 at pH 6.0 (for FcRn binding) or 7.4 + 1 mM CaCl2 (for cubilin binding). Data from a minimum of three replicate binding assays were analyzed using NanoTemper analysis and GraphPad Prism or Origin software. Means ± SD are presented. A progressive loss of albumin binding was measured for both cubilin (0.5 µM to >15 µM) and FcRn (10 µM to >100 µM) as carbamylation increased.
Table 1.
MST analysis of RSA binding to FcRn or cubilin
| Ligand | Binding Affinity(kD µM) | |
|---|---|---|
| Cub7,8, pH 7.4 | RSA | 0.5–1 µM |
| Cub7,8, pH 7.4 | cRSA30min | 2–4 µM |
| Cub7,8, pH 7.4 | cRSA2h | ∼5 µM |
| Cub7,8, pH 7.4 | cRSA4h | >15 µM |
| rFcRn, pH 6 | RSA | 10 µM |
| rFcRn, pH 6 | cRSA30min | 19.5 ± 3 µM |
| rFcRn, pH 6 | cRSA2h | ∼80–100 µM |
| rFcRn, pH 6 | cRSA4h | >100 µM or ND |
| rFcRn, pH 7.4 | RSA | ND |
cRSA, carbamylated rat serum albumin; MST, microscale thermophoresis; ND, not determined; RSA, rat serum albumin.
Evaluation of Charge and Size Using SDS-PAGE, IEF, and Zetasizer
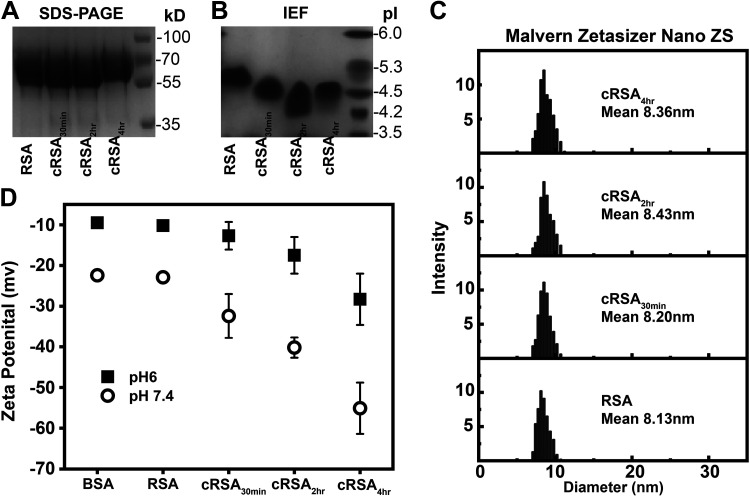
Multiple techniques were used to define the effects of albumin carbamylation on albumin charge and size. As expected, SDS-PAGE revealed a minor increase in size for cRSA4h (Fig. 7A) due to carbamylation. IEF documented a dose-related negative charge increase with carbamylation at 30 and 120 min, but, interestingly, cRSA4h had a slight positive shift (Fig. 7B). To further quantify charge and shape changes, the Malvern Zetasizer Nano ZS instrument was used. Figure 7C and Table 2 show the increase in mean diameter, as measured by dynamic light scattering, with carbamylation. In a separate experiment, the zeta potentials of albumin were measured (Fig. 7D and Table 2). An increase in the negative charge of albumin occurred with increasing carbamylation. The increased net negative charge, along with the increased size of carbamylated albumin, might contribute to the disruption of albumin binding to cubilin and FcRn. Finally, evaluation of carbamylated albumins’ secondary structure using CD showed no difference in signature α-helix profile (Supplemental Fig. S4).
Figure 7.
Modulation of size and charge parameters of rat serum albumin (RSA) upon carbamylation. Evaluation of size by SDS-PAGE showed a minor increase (A), while that by an isoelectric focusing (IEF) gel showed an increase in albumin’s negative charge with carbamylation (B). Further characterization of size and diameter was done using dynamic light scattering (DLS), which showed an increase in mean diameter of carbamylated albumins (C). Measurement of surface charge or zeta potential in a folded capillary cell (DTS1060) clearly showed a dose-dependent increase in negative charge for carbamylated albumins at both pH 6 and 7.4 (D). Zetasizer and zeta potential measurements were recorded on a Malvern Zetasizer Nano ZS instrument (PBIF, Indiana University, Bloomington, IN). Data from a minimum of three assays were combined for DLS, and zeta potential was performed in triplicate, with means ± SD shown.
Table 2.
Parameters obtained by DLS and zeta potential
| Protein | mV, pH 6.0 | mV, pH 7.4 | DLS Diameter, nm |
|---|---|---|---|
| BSA | −9.5 | −22.4 | 8.1 |
| RSA | −10.2 | −22.9 | 8.13 |
| cRSA30min | −12.7 | −32.4 | 8.20 |
| cRSA2h | −17.5 | −40.2 | 8.43 |
| cRSA4h | −28.3 | −55.1 | 8.36 |
cRSA, carbamylated rat serum albumin; DLS, dynamic light scattering; RSA, rat serum albumin.
SAXS Data of Carbamylated Albumins and Its Complex with FcRn
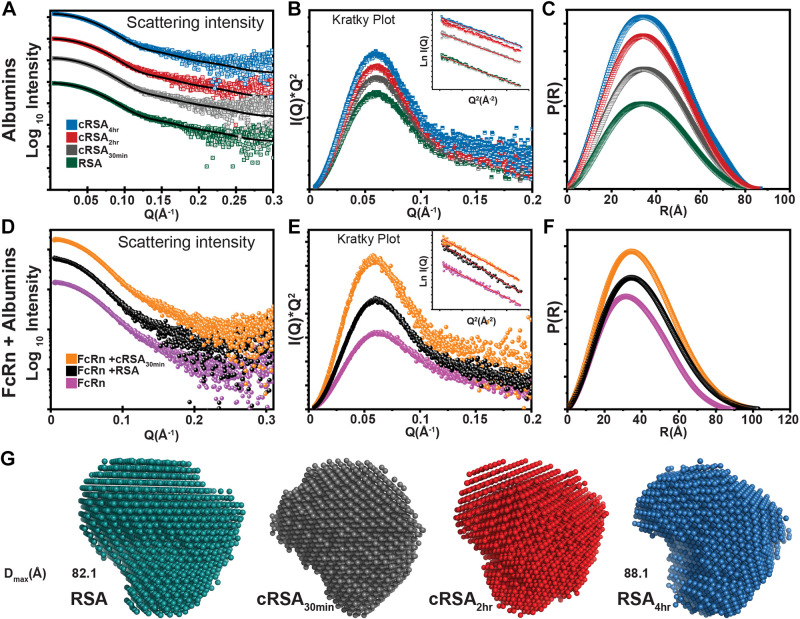
Scattering intensity obtained from SEC-SAXS of albumin and carbamylated albumins free in solution and bound with FcRn were plotted as log10 intensity versus Q (Å). Note that for both unbound albumins (Fig. 8A) and complexes with FcRn (Fig. 8D), a flat curve was observed in the low Q region, indicating monodispersity in the sample and lack of aggregation. Monodispersity in the samples was further confirmed by linear fit [ln I(Q) versus Q2] in the Guinier region for all individual albumins (Fig. 8B, inset) and complexes (Fig. 8E, inset). In addition, RG values, calculated from the slope of the Guinier region, showed an increase from 28.0 Å for noncarbamylated RSA to 28.8 Å for cRSA4h. Calculation of RC used the radius of gyration function of SAS data analysis and showed minimal difference. Next, Kratky profiles I(Q)*Q2 versus Q (Å) were examined, and the observed bell-shaped curves are consistent with a folded globular nature for albumins and complexes (Fig. 8, B and E, and Table 3). The distance distribution [plot P(R) versus R (Å)] from Fig. 8, C and F, was used for calculation of maximum linear dimension Dmax and showed a change from 82 to 88 Å for cRSA4h and 100.3 to 102.5 Å for RSA:FcRn complexes (Fig. 8G and Table 3). The shape parameters of unmodified RSA ± FcRn are consistent with previously published data (8). The P(R) analysis depicts the monomeric nature of the proteins and removes the possibility of oligomerization, which was further confirmed by the DATMOW calculation of molecular weight (Table 3) (28). SAXS profiles obtained from P(R) were used for generating models by DAMMIF software using uniform density modeling (Fig. 8G) (27). Experimental I(Q) profiles were analyzed by FoXS fast X-ray scattering server, and the output fit plot file was plotted with observed χ2 of 1.4 for albumin and χ2 of 1.8 for cRSA4h. The results support induced local changes in the shape of carbamylated albumins. These SAXS envelopes were superimposed on the crystal structure of albumin lE78 by the SUPCOMB function of the ATSAS suite (Supplemental Fig. S5). Note that these SAXS envelopes of complexes FcRn-RSA and FcRn-cRSA30min showed similar shapes and dimensions (Table 3 and Supplemental Fig. S5). This structural analysis showed three key changes to carbamylated albumin. First, carbamylation doesn’t induce any type of oligomerization/denaturation as per intensity plots, P(R), and Kratky plots and remains in fully folded conformation. Second, carbamylation increases Rg and Dmax of the protein as per Guinier and IFT calculations. Third, carbamylation might induce local conformational changes based on overall altered shape parameters (Table 3).
Figure 8.
Determination of shape/structural parameters of carbamylated albumins and albumin-FcRn complex using small-angle X-ray scattering (SAXS). A logarithmic plot of scattering intensity of albumins, log10 Intensity vs. Q, showed a flat curve at a low Q region, indicating lack of aggregation and monodispersity in all samples (A and D). The black line in A shows fit files obtained from the FoXS server plotted over scattered intensity profiles to track the changes in χ2 of experimental profiles and known crystal structure. The Guinier plot [ln I(Q) vs. Q2] in the low Q region showed a linear fit for all rat serum albumins (RSAs) and complexes (inset, B and E). Kratky profiles [I(Q)*Q2 vs. Q (Å)] observed that bell-shaped curves are consistent with a globular nature for albumins (B) and their complexes with FcRn (E). The pairwise distribution plot [P(R)] suggested a slight increase in Dmax of the RSAs (C) and RSA-FcRn complex (F), as shown in Table 3. Uniform-density SAXS models (G) generated and averaged by Dammif software and further refined by Dammin software using SAS data analysis of ATSAS clearly showed no large global shape changes of the albumins upon carbamylation, but there was a slight increase in the Dmax of the protein.
Table 3.
Structural parameters of RSAs alone and bound to FcRn as deduced from Guinier analysis and indirect Fourier transform of SAXS I(Q) profiles
| Guinier Analysis Indirect Fourier Transformation |
||||||||
|---|---|---|---|---|---|---|---|---|
| Protein | Concentration, mg/mL | RG, Å | RC, Å | L, Å | RG, Å | Dmax, Å | Datmow, Da | State |
| RSA | ∼2 | 28.0 | 16.9 | 77.5 | 28.2 | 82 | 64,102 | Monomer |
| cRSA30min | ∼2 | 28.2 | 17.1 | 77.6 | 28.7 | 83 | 65,079 | Monomer |
| cRSA2h | ∼2 | 28.3 | 17.3 | 77.4 | 28.6 | 86 | 68,364 | Monomer |
| cRSA4h | ∼2 | 28.8 | 17.0 | 80.7 | 29 | 88 | 71,823 | Monomer |
| RSA + rFcRn | 30.22 | 17.1 | 86.3 | 30.8 | 100 | 98,000 | 1:1 | |
| cRSA30min + rFcRn | 31.7 | 17.0 | 92.8 | 30.9 | 102 | 98,000 | 1:1 | |
cRSA, carbamylated rat serum albumin; RSA, rat serum albumin.
LC-MS/MS Determination of Modified Sites and Degree of Carbamylation
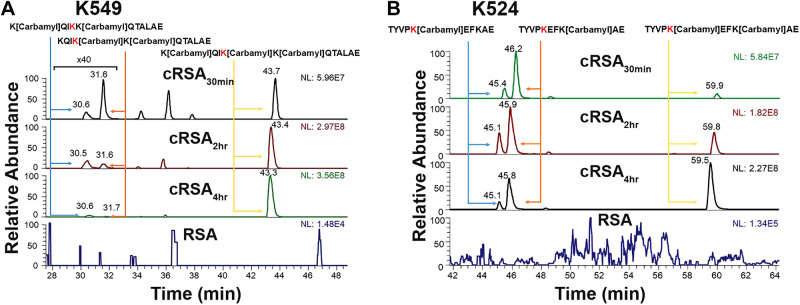
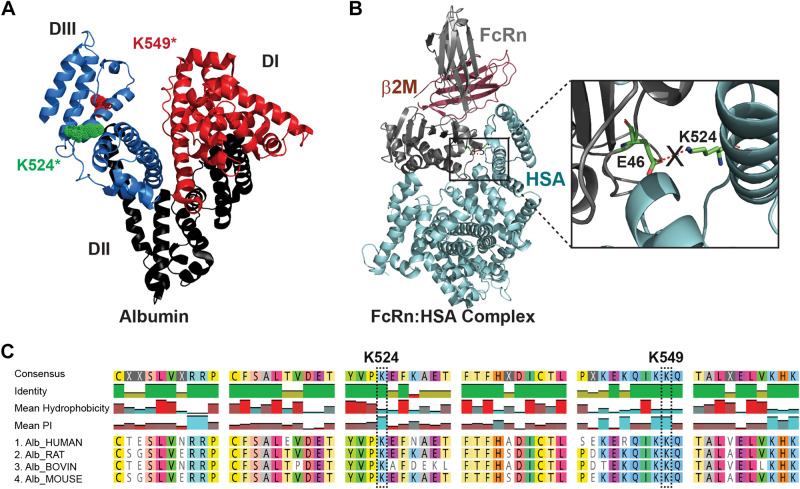
Mass spectrometry was then used to define the specific carbamylated peptides and modified lysine residues. Note the increasing number of lysines modified, as expected, with increasing duration of carbamylation (Table 4 and Supplemental Fig. S6). Some lysines were clearly more prone to carbamylation, with the previously reported peptide KQIKKQTALAE (K549) 99–100% carbamylated at 30 min (Fig. 9A and Supplemental Fig. S7) (3). The ion chromatogram shows the comparison of RSA peptides and cRSA30min, cRSA2h, and cRSA4h peptides. No carbamylated peptide was detected in RSA (Supplemental Table S2). These results agree with a study showing that K549 is the most favorable site for carbamylation (3). To address the impact of albumin carbamylation on FcRn receptor binding, we performed in silico analysis. Analysis of the crystal structure of human FcRn complexed with human serum albumin (Fig. 10A), PDB ID 4N0F, revealed one critical salt bridge between albumins’ K524 and FcRns’ E46 (Fig. 10B). Intensity and percent carbamylation observed for TYVPKEFKAE (K524) in our LC-MS/MS data showed a significant increase in carbamylation with time: 20.6% carbamylated at 30 min, 40.8% at 2 h, and 61.1% after 4 h (Fig. 9B and Supplemental Table S3 and Supplemental Fig. S7). This progressive increase in K524 carbamylation coincided with the reduced binding observed by MST for the carbamylated albumins.
Table 4.
MALDI-TOF data
| Albumin | Calculated Mass, Da | Mass Shift, Da | Lysines Modified |
|---|---|---|---|
| RSA | 66,393 | 0 | 0 |
| cRSA30min | 67,061 | 668 | 16 |
| cRSA2h | 67,763 | 1,370 | 32 |
| cRSA4h | 68,266 | 1,873 | 44 |
cRSA, carbamylated rat serum albumin; RSA, rat serum albumin.
Figure 9.
Mass spectrometry identification of modified sites and degree of carbamylation. Carbamylation resulted in confirmation of albumin K549 (KQIKKQTALAE) as the most highly carbamylated site with close to 100% carbamylation at 30 min (A). In silico analysis identified albumin K524 (TYVPKEFKAE) as a potential site for FcRn interaction, and analysis of K524’s carbamylation with time showed a progressive dose-dependent increase in carbamylation with time: 20.6% carbamylated for cRSA30min, 40.8% for cRSA2h, and 61.1% for cRSA4h (B). The Dionex Ultimate 3000 nano-LC system (Thermo Scientific, San Jose, CA) interfaced to an LTQ Orbitrap Velos mass spectrometer (Thermo Scientific) equipped with a nano-ESI source was used to analyze the proteolysates of serum albumin samples. Note the carbamylated lysine highlighted in red.
Figure 10.
Carbamylation at the K524 site in rat serum albumins (RSA) blocks the critical salt bridge interaction essential to form the FcRn-albumin binding complex. The combined approach of analyzing in silico analysis of FcRn-HSA crystal structure and LC-MS/MS data of digested peptides of carbamylated albumins was done to address the mechanism of reduced binding to FcRn. The albumin crystal structure PDB ID 1E78 showed all three domains of albumin, along with the highest carbamylation site K549* and critical site K524* located in domain III, as observed in MS/MS analyses (A). The crystal structure of FcRn and serum albumin PDB ID 4N0F is shown in B. The enlarged view shows the critical salt bridge between the E46 residue of FcRn and K524 of albumin necessary for their interaction, which is blocked when K524 is carbamylated (B). Multiple-sequence alignment data from Clustal Omega (C) showed that these sequences and key lysines are highly conserved in mammals, so carbamylation at this site will affect the albumin FcRn interaction, albumin transcytosis, and thus metabolism. Note that the interacting residue for the FcRn-RSA crystal structure (PDB ID 4N0F) analyzed by PDBsum EMBL-EBI and numbering of residues K549* is the same as in Ref. 3, whereas K524* is same as K500 as numbered in the crystal structure PDB ID 4N0F (4). HSA, human serum albumin.
DISCUSSION
Carbamylation of proteins is a nonenzymatic addition of a carbamoyl moiety, which increases as blood urea increases in CKD and ESRD (3). This leads to both increased inflammation and renal and cardiovascular complications including increased mortality (3, 47). Carbamylation alters a protein’s charge, conformation, enzymatic activity, hormonal activity, binding properties, and drug interactions, potentially impacting a protein’s normal physiological function and biological responses (6). Because the kidney and liver both have a major role in albumin metabolism, and toxicity has been reported for carbamylated albumin (11), understanding how carbamylated albumin is filtered and metabolized is of clinical importance. Further, the importance of FcRn in renal tubular reclamation of filtered albumin was documented by two elegant studies using FcRn knockout mice (48) and podocyte inducible expression of tagged albumin (49). The cubilin/megalin receptor complex participates in the receptor-mediated uptake of albumin in PTs (50), with fluid-phase endocytosis involved in albumin uptake in endothelial cells and hepatocytes (39, 40).
Previous studies have shown that reduced affinity for albumins’ transcytotic receptor FcRn results in increased vascular clearance and endosomal missorting (8, 34, 51). We observed a significant increase in cRSAs vascular clearance in a dose-dependent fashion (Fig. 1). However, quantitative kidney intravital imaging for 2 h post infusion did not show any alteration in cRSAs’ filtration as the GSC was identical to RSA. In addition, similar PTS1 albumin fluorescence (RSA or cRSA4h) over 2 h was observed as was colocalization with dextran, a measure of lysosome accumulation (Fig. 2). Increased vascular clearance could result from 1) reduced PT uptake resulting in increased urine cAlb, 2) increased trafficking to lysosome (degradation) resulting in reduction in transcytosis and vascular return, and/or 3) accumulation outside of the vascular compartment. Note that because cRSA4h had such a rapid vascular clearance, >80% by 2 h, less of this albumin would be available for filtration and yet a similar PT S1 fluorescence was quantified (Fig. 2E) and a similar dextran colocalization (Fig. 2F) supporting that filtered cRSA4h was efficiently taken up by the PT. The fact that RSA had a much slower vascular clearance but similar levels of accumulation in the PT supports that an active RSA transcytotic pathway continually returns much of the filtered RSA to the circulation.
To evaluate established PT uptake and transcytosis binding interactions for RSA and impact of carbamylation, we characterized cRSA binding to cubilin (CUB7,8) and FcRn. The consensus is that albumin is taken up by fluid-phase endocytosis in endothelial cells, whereas uptake in the PT is dependent upon albumins interaction with cubilin/megalin (39, 40, 50). FcRn is needed for the transcytotic pathway that returns albumin to the circulation in both cell types. To investigate changes in carbamylated albumins’ interactions with PT receptors, we used MST binding assays. Although CUB7,8 binding was reduced, FcRn binding to cRSA4h was essentially not detectable (Fig. 6). These data provide a mechanism for reduced transcytosis, leading to increased lysosome delivery and a more rapid vascular clearance. The inability of FcRn to bind carbamylated albumin will prevent the normal cubilin to FcRn handoff, thus targeting this albumin to lysosomes and preventing transcytosis. Understanding why PT cRSA uptake is unchanged despite binding to CUB7,8 is reduced will require further investigation. However, three potential mechanisms may be involved. First, although the CUB7,8 domain has been reported to be the primary binding site for albumin, additional cubilin domains have a role (45). Second, cubilin may actually form a trimer in the PT BBM that creates other albumin-binding interactions (44, 52). Third, the uptake of albumin in the PT may also involve fluid-phase endocytosis as proposed for some endothelial cells (53).
Our systematic analysis enabled identification of the critical albumin amino acid modified by carbamylation that results in reduced albumin FcRn binding and altered PTC metabolism. Biophysical changes occurring to albumin with carbamylation showed minimal changes in size but zeta potential studies showed significant increases in negative charge. Dynamic light scattering showed an increase in albumins’ mean diameter upon carbamylation (Fig. 7). Structural and shape changes of carbamylated albumin and its FcRn complex were confirmed by SAXS analysis, which showed an increase in the maximum linear dimensions (Dmax) and radius of gyration (Rg) (Fig. 8). Because these small and local surface shape changes could certainly impact binding, a closer analysis of the specific amino acids modified was necessary to determine the mechanism at the binding interface of the albumin-receptor complex. Mass spectrometric experiments showed a clear increase in albumin’s molecular weight with increasing carbamylation. LC-MS/MS-based analyses of digested peptides found the previously identified amino acid site, KQIKK*QTALAE, K549 (3), to be highly carbamylated at all time points.
We also identified the critical site for the albumin-FcRn interaction using in silico analyses. Inspection of the FcRn-albumin complex crystal structure by PDBsum (PDB ID 4N0F) (4) revealed 10 hydrogen bonds and 2 salt bridges—one between albumin domain I-FcRn (K150:E86) and one between albumin domain III-FcRn (K524-E46) (Fig. 10). Previous studies have shown that FcRn interacts with albumin domains I and III in a pH-dependent fashion, with domain III being most important (54). Lysines 524 and 549 are located in domain III (Fig. 10A). LC-MS/MS data for carbamylated peptide TYVPK*EFKAE, K524 residue showed an increased carbamylation with exposure time that correlated with decreased FcRn binding (Fig. 10B). The addition of the negatively charged carbamyl moiety on K524 would inhibit salt bridge formation by neutralizing lysine’s positive charge and thus hinder FcRn interaction. Agreement with our finding of the importance of the albumin K524 site comes from two studies which showed the K524A mutation eliminated or FcRn binding reduced (54, 55). In addition, multiple-sequence alignment of albumins shows these lysines are highly conserved in mammals (Fig. 10C).
Because rapid vascular clearance occurred for cRSA4h, the liver was investigated, as it is the site of albumin synthesis and participates in significant blood filtration, removal of toxins, and has multiple scavenger receptors (56, 57). Liver imaging showed a striking accumulation of cRSA highlighting continuous liver sinusoidal endothelial cells (LSECs) in contrast to RSA, which had a faint punctate distribution (Fig. 3). Previous studies have shown a similar fluorescent pattern in the liver when formaldehyde-treated albumin was endocytosed by LSECs or when the scavenger receptor stabilin 1 was stained (58, 59). LSECs can be distinguished from Kupffer cells, which internalize 2-µm latex beads (59, 60). Note that liver accumulation was observed at 16 h for all cRSAs examined (30 min, 2 h, and 4 h), but when the liver was imaged intravitally for 2 h post infusion, only cRSA2h and cRSA4h accumulated in LSECs. This is consistent with the reduced carbamylation of the cRSAs K524 site for cRSA30min (Table 3). Interestingly, less cRSA was present in the kidney PTs at 16 h, although distinct accumulations in endothelial/interstitial areas was observed. This may reflect the ability of the PT lysosomes to more effectively degrade cRSA.
Hepatocytes use FcRn to transport (transcytose) synthesized albumin from the apical (bile canaliculi) to the basolateral surface, where it is released into the space of Disse and into the vasculature (39, 53). No evidence exists for LSECs having FcRn; thus, another mechanism for the continued presence of cAlb in these cells needs to be invoked. LSECs are highly specialized endocytic cells containing multiple scavenger receptors that have been shown to bind to many modified ligands including carbamylated LDL and glycated albumin (59, 61). We believe it is likely that one or more of these scavenger receptors is responsible for binding and triggering uptake of cAlb. Defining which receptor is responsible for this uptake and determining whether this initiates any harmful responses such as that shown for carbamylated LDL will require further investigation (62, 63).
The high concentration of albumin in plasma, along with its ability to bind many molecules, i.e., drugs, toxins, proteins, and to be modified by serum compounds, i.e., urea (carbamylation), sugars (glycation), make albumin a valuable “sensor” of the body’s unique homeostatic condition. In addition, albumin is being used to extend the half-life of various drugs including chemotherapeutic agents, so a more complete understanding of how these “modified albumins” have their metabolism impacted is clinically important (64). In fact, the manipulation of FcRn affinity for albumin or IgG proteins is becoming a standard approach for delivery of novel therapeutics (40, 65, 66).
However, although disruption of the normal metabolism of albumin may initially trigger corrective responses, continued presence of altered albumin may lead to lysosome dysfunction and a cascade of problems as reported for multiple diseases (67–69). This is especially relevant given recent studies that show the importance of the lysosome as a dynamic regulator of the cell and organismal homeostasis (63). Interestingly, a recent report even suggests the use of albumin-binding competitors to promote the removal of albumin-bound toxins (70), while another showed the inhibition of lysosomal enzyme activity by albumin from a patient with diabetes (71). Our studies now delineate a dose-dependent increase in albumin carbamylation that results in altered intracellular handling, leading to increased vascular clearance and accumulation in liver endothelial cells and kidney endothelial/interstitial cells. As vascular disease is a hallmark of CKD and especially diabetic CKD, these results shed new light on the potential pathophysiologic mechanisms involved in uremic enhancement of microvascular diseases. Thus, understanding how modified albumin and its associated uremic toxins are processed through the endolysosomal pathway is important and may have clinical implications beyond the PT.
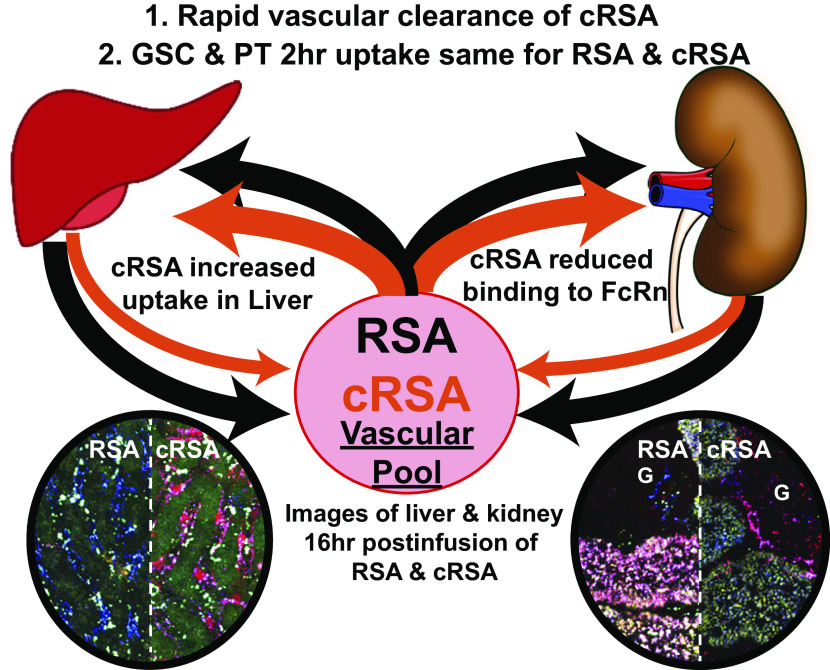
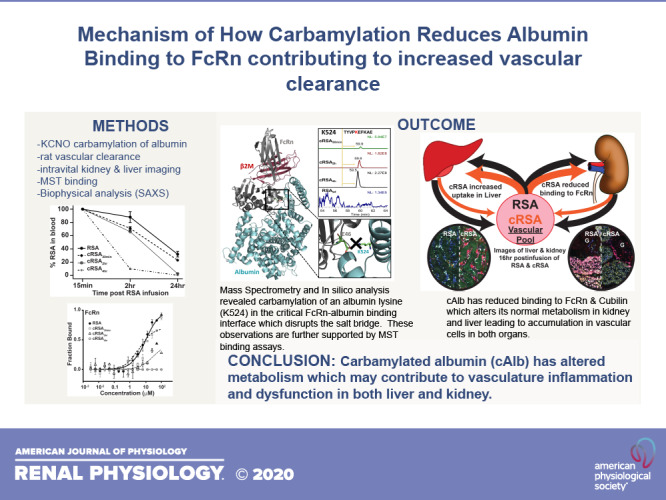
In summary, this interdisciplinary and integrated approach of applying techniques of cell and molecular biology, biochemistry and biophysics enabled us to define the mechanism by which carbamylation of albumin alters its metabolism. As shown in Fig. 11, the result of albumin carbamylation leads to rapid vascular clearance due in part to reduction in FcRn binding and reduced recycling of cAlb via the kidney and liver accumulation likely due to scavenger receptor-mediated uptake in the liver. Because the level of BUN increases with severity of CKD, and a reduction in GFR would reduce clearance of carbamylated albumin, monitoring the level of carbamylated albumin and determining the impact of carbamylated albumin on the liver will be important. Finally, evaluating other albumin modifications or associations and their unique impact on receptor binding and metabolism has the potential for revealing new approaches for therapeutics and improved outcomes for multiple diseases.
Figure 11.
Summary diagram showing the interplay between the vasculature, kidney, and liver. Carbamylated rat serum albumin (cRSA) is depicted by orange lines emphasizing the rapid depletion due in part to significant liver uptake. G, glomerulus; PT, proximal tubule; RSA, rat serum albumin.
SUPPLEMENTAL DATA
Supplemental Figs. S1-S7 are available at https://doi.org/10.6084/m9.figshare.12789581. Supplemental Tables S1-S3 are available at https://doi.org/10.6084/m9.figshare.12789581.
GRANTS
This work was supported by National Institute of Diabetes and Digestive and Kidney Diseases Grants RO1DK091623 and P30DK079312 (to B.A.M.).
DISCLOSURES
No conflicts of interest, financial or otherwise, are declared by the authors.
AUTHOR CONTRIBUTIONS
S.P.S.Y., J.Z., Y.M., B.A.M., and M.C.W. conceived and designed research; S.P.S.Y., R.M.S., J.Z., Y.H., S.K., S.B.C-B., G.R., and M.C.W. performed experiments; S.P.S.Y., R.M.S., E.W., Y.M., B.A.M., and M.C.W. analyzed data; S.P.S.Y., R.M.S., J.Z., E.W., Y.M., B.A.M., and M.C.W. interpreted results of experiments; S.P.S.Y., R.M.S., J.Z., and M.C.W. prepared figures; S.P.S.Y. and M.C.W. drafted manuscript; S.P.S.Y., R.M.S., E.W., Y.M., B.A.M., and M.C.W. edited and revised manuscript; S.P.S.Y., R.M.S., J.Z., E.W., S.K., S.B.C-B., G.R., Y.M. B.A.M., and M.C.W. approved final version of manuscript.
ACKNOWLEDGMENTS
The authors thank Dr. Srinivas Chakravarthy and Dr. Jesse Hopkins for helping in data collection and in creating desmeared files of SEC-SAXS data using BioXTASRAW software collected at BioCAT beamline, ANL (Chicago, IL). The authors also thank Dr. Jun and Dr. Gonzalez-Gutierrez at the Physical Biochemistry Instrumentation Facility (Bloomington, IN).
REFERENCES
- 1.Jaisson S, Pietrement C, Gillery P. Protein carbamylation: chemistry, pathophysiological involvement, and biomarkers. Adv Clin Chem 84: 1–38, 2018. doi: 10.1016/bs.acc.2017.12.001. [DOI] [PubMed] [Google Scholar]
- 2.Kalim S, Karumanchi SA, Thadhani RI, Berg AH. Protein carbamylation in kidney disease: pathogenesis and clinical implications. Am J Kidney Dis 64: 793–803, 2014. doi: 10.1053/j.ajkd.2014.04.034. [DOI] [PMC free article] [PubMed] [Google Scholar]
- 3.Berg AH, Drechsler C, Wenger J, Buccafusca R, Hod T, Kalim S, Ramma W, Parikh SM, Steen H, Friedman DJ, Danziger J, Wanner C, Thadhani R, Karumanchi SA. Carbamylation of serum albumin as a risk factor for mortality in patients with kidney failure. Sci Transl Med 5: 175ra29, 2013. doi: 10.1126/scitranslmed.3005218. [DOI] [PMC free article] [PubMed] [Google Scholar]
- 4.Oganesyan V, Damschroder MM, Cook KE, Li Q, Gao C, Wu H, Dall’Acqua WF. Structural insights into neonatal Fc receptor-based recycling mechanisms. J Biol Chem 289: 7812–7824, 2014. doi: 10.1074/jbc.M113.537563. [DOI] [PMC free article] [PubMed] [Google Scholar]
- 5.Zorzi A, Linciano S, Angelini A. Non-covalent albumin-binding ligands for extending the circulating half-life of small biotherapeutics. Med Chem Commun 10: 1068–1081, 2019. doi: 10.1039/C9MD00018F. [DOI] [PMC free article] [PubMed] [Google Scholar]
- 6.Lee P, Wu X. Review: modifications of human serum albumin and their binding effect. Curr Pharm Des 21: 1862–1865, 2015. doi: 10.2174/1381612821666150302115025. [DOI] [PMC free article] [PubMed] [Google Scholar]
- 7.Awasthi S, Saraswathi NT. Non-enzymatic glycation mediated structure–function changes in proteins: case of serum albumin. RSC Adv 6: 90739–90753, 2016. doi: 10.1039/C6RA08283A. [DOI] [Google Scholar]
- 8.Wagner MC, Myslinski J, Pratap S, Flores B, Rhodes G, Campos-Bilderback SB, Sandoval RM, Kumar S, Patel MA, Molitoris BA. Mechanism of increased clearance of glycated albumin by proximal tubule cells. Am J Physiol Renal Physiol 310: F1089–102, 2016. doi: 10.1152/ajprenal.00605.2015. [DOI] [PMC free article] [PubMed] [Google Scholar]
- 9.Anguizola J, Matsuda R, Barnaby OS, Hoy KSS, Wa C, DeBolt E, Koke M, Hage DS. Review: glycation of human serum albumin. Clin Chim Acta 425: 64–76, 2013. doi: 10.1016/j.cca.2013.07.013. [DOI] [PMC free article] [PubMed] [Google Scholar]
- 10.Raghav A, Ahmad J. Glycated serum albumin: a potential disease marker and an intermediate index of diabetes control. Diabetes Metab Syndr 8: 245–251, 2014. doi: 10.1016/j.dsx.2014.09.017. [DOI] [PubMed] [Google Scholar]
- 11.Gross M-L, Piecha G, Bierhaus A, Hanke W, Henle T, Schirmacher P, Ritz E. Glycated and carbamylated albumin are more “nephrotoxic” than unmodified albumin in the amphibian kidney. Am J Physiol 301: F476–F485, 2011. doi: 10.1152/ajprenal.00342.2010. [DOI] [PubMed] [Google Scholar]
- 12.Sandoval RM, Molitoris BA. Quantifying endocytosis in iivo using intravital two-photon microscopy. Methods Mol Biol 440: 389–402, 2008. doi: 10.1007/978-1-59745-178-9_28. [DOI] [PubMed] [Google Scholar]
- 13.Sandoval RM, Wagner MC, Patel M, Campos-Bilderback SB, Rhodes GJ, Wang E, Wean SE, Clendenon SS, Molitoris B.A. Multiple factors influence glomerular albumin permeability in rats. J Am Soc Nephrol 23: 447–457, 2012. doi: 10.1681/ASN.2011070666. [DOI] [PMC free article] [PubMed] [Google Scholar]
- 14.Dunn K, Martinez M, Wang Z, Mang H, Clendenon S, Sluka J, Glazier J, Klaunig J. Mitochondrial depolarization and repolarization in the early stages of acetaminophen hepatotoxicity in mice. Toxicology 439: 152464, 2020. doi: 10.1016/j.tox.2020.152464. [DOI] [PMC free article] [PubMed] [Google Scholar]
- 15.Dunn KW, Sandoval RM, Kelly KJ, Dagher PC, Tanner GA, Atkinson SJ, Bacallao RL, Molitoris BA. Functional studies of the kidney of living animals using multicolor two-photon microscopy. Am J Physiol 283: C905–C916, 2002. doi: 10.1152/ajpcell.00159.2002. [DOI] [PubMed] [Google Scholar]
- 16.Dickson LE, Wagner MC, Sandoval RM, Molitoris BA. The proximal tubule and albuminuria: really!. J Am Soc Nephrol 25: 443–453, 2014. doi: 10.1681/ASN.2013090950. [DOI] [PMC free article] [PubMed] [Google Scholar]
- 17.Sandoval RM, Molitoris BA. Letter to the editor: “Quantifying albumin permeability with multiphoton microscopy: why the difference?” Am J Physiol Renal Physiol 306: F1098–100, 2014. doi: 10.1152/ajprenal.00652.2013. [DOI] [PMC free article] [PubMed] [Google Scholar]
- 18.Sandoval RM, Wang E, Molitoris BA. Finding the bottom and using it: offsets and sensitivity in the detection of low intensity values in vivo with 2-photon microscopy. Intravital 2: e23674, 2013. doi: 10.4161/intv.23674. [DOI] [PMC free article] [PubMed] [Google Scholar]
- 19.Ellinger I, Klapper H, Fuchs R. Fluid-phase marker transport in rat liver: free-flow electrophoresis separates distinct endosome subpopulations. Electrophoresis 19: 1154–1161, 1998. doi: 10.1002/elps.1150190716. [DOI] [PubMed] [Google Scholar]
- 20.Masedunskas A, Porat-Shliom N, Rechache K, Aye M-P, Weigert R. Intravital microscopy reveals differences in the kinetics of endocytic pathways between cell cultures and live animals. Cells 1: 1121–1132, 2012. doi: 10.3390/cells1041121. [DOI] [PMC free article] [PubMed] [Google Scholar]
- 21.Masedunskas A, Weigert R. Intravital two-photon Mmicroscopy for studying the uptake and trafficking of fluorescently conjugated molecules in live Rrodents. Traffic 9: 1801–1810, 2008. doi: 10.1111/j.1600-0854.2008.00798.x. [DOI] [PMC free article] [PubMed] [Google Scholar]
- 22.Sandoval RM, Kennedy MD, Low PS, Molitoris BA. Uptake and trafficking of fluorescent conjugates of folic acid in intact kidney determined using intravital two-photon microscopy. Am J Physiol Cell Physiol 287: C517–26, 2004. doi: 10.1152/ajpcell.00006.2004. [DOI] [PubMed] [Google Scholar]
- 23.Molitoris BA, Sandoval RM. Intravital multiphoton microscopy of dynamic renal processes. Am J Physiol Ren Physiol 288: F1084–9, 2005. doi: 10.1152/ajprenal.00473.2004. [DOI] [PubMed] [Google Scholar]
- 24.Laemmli UK. Cleavage of structural proteins during the assembly of the head of bacteriophage T4. Nature 227: 680–685, 1970. doi: 10.1038/227680a0. [DOI] [PubMed] [Google Scholar]
- 25.Hopkins JB, Gillilan RE, Skou S. BioXTAS RAW: improvements to a free open-source program for small-angle X-ray scattering data reduction and analysis. J Appl Crystallogr 50: 1545–1553, 2017. doi: 10.1107/S1600576717011438. [DOI] [PMC free article] [PubMed] [Google Scholar]
- 26.Franke D, Petoukhov MV, Konarev PV, Panjkovich A, Tuukkanen A, Mertens HDT, Kikhney AG, Hajizadeh NR, Franklin JM, Jeffries CM, Svergun DI. ATSAS 2.8: a comprehensive data analysis suite for small-angle scattering from macromolecular solutions. J Appl Crystallogr 50: 1212–1225, 2017. doi: 10.1107/S1600576717007786. [DOI] [PMC free article] [PubMed] [Google Scholar]
- 27.Franke D, Svergun DI. DAMMIF, a program for rapid ab-initio shape determination in small-angle scattering. J Appl Crystallogr 42: 342–346, 2009. doi: 10.1107/S0021889809000338. [DOI] [PMC free article] [PubMed] [Google Scholar]
- 28.Fischer H, de Oliveira Neto M, Napolitano HB, Polikarpov I, Craievich AF. Determination of the molecular weight of proteins in solution from a single small-angle X-ray scattering measurement on a relative scale. J Appl Crystallogr 43: 101–109, 2010. doi: 10.1107/S0021889809043076. [DOI] [Google Scholar]
- 29.Schneidman-Duhovny D, Hammel M, Tainer JA, Sali A. FoXS, FoXSDock and multiFoXS: Single-state and multi-state structural modeling of proteins and their complexes based on SAXS profiles. Nucleic Acids Res 44: W424–W429, 2016. doi: 10.1093/nar/gkw389. [DOI] [PMC free article] [PubMed] [Google Scholar]
- 30.Mura C, McCrimmon CM, Vertrees J, Sawaya MR. An introduction to biomolecular graphics. PLoS Comput Biol 6: e1000918, 2010. doi: 10.1371/journal.pcbi.1000918. [DOI] [PMC free article] [PubMed] [Google Scholar]
- 31.Al Hariri M, Elmedawar M, Zhu R, Jaffa MA, Zhao J, Mirzaei P, Ahmed A, Kobeissy F, Ziyadeh FN, Mechref Y Jaffa AA. Proteome profiling in the aorta and kidney of type 1 diabetic rats. PLoS One 12: e0187752, 2017. doi: 10.1371/journal.pone.0187752. [DOI] [PMC free article] [PubMed] [Google Scholar]
- 32.Zacharias LG, Hartmann AK, Song E, Zhao J, Zhu R, Mirzaei P, Mechref Y. HILIC and ERLIC enrichment of glycopeptides derived from breast and brain Ccancer Cells. J Proteome Res 15: 3624–3634, 2016. doi: 10.1021/acs.jproteome.6b00429. [DOI] [PMC free article] [PubMed] [Google Scholar]
- 33.Banazadeh A, Peng W, Veillon L, Mechref Y. Carbon nanoparticles and graphene nanosheets as MALDI matrices in glycomics: a new approach to improve glycan profiling in biological samples. J Am Soc Mass Spectrom 29: 1892–1900, 2018. doi: 10.1007/s13361-018-1985-z. [DOI] [PMC free article] [PubMed] [Google Scholar]
- 34.Schmidt EGW, Hvam ML, Antunes F, Cameron J, Viuff D, Andersen B, Kristensen NN, Howard KA. Direct demonstration of a neonatal Fc receptor (FcRn)-driven endosomal sorting pathway for cellular recycling of albumin. J Biol Chem 292: 13312–13322, 2017. doi: 10.1074/jbc.M117.794248. [DOI] [PMC free article] [PubMed] [Google Scholar]
- 35.Andersen JT, Dalhus B, Viuff D, Thue Ravn B, Gunnarsen KS, Plumridge A, Bunting K, Antunes F, Williamson R, Athwal S, Allan E, Evans L, Bjørås M, Kjærulff S, Sleep D, Sandlie I, Cameron J. Extending serum half-life of albumin by engineering FcRn binding. J Biol Chem, 2014. doi: 10.1074/jbc.M114.549832. [DOI] [PMC free article] [PubMed] [Google Scholar]
- 36.Bern M, Sand KMK, Nilsen J, Sandlie I, Andersen JT. The role of albumin receptors in regulation of albumin homeostasis: implications for drug delivery. J Control Release 211: 144–162, 2015. doi: 10.1016/j.jconrel.2015.06.006. [DOI] [PubMed] [Google Scholar]
- 37.Larsen MT, Rawsthorne H, Schelde KK, Dagnæs-Hansen F, Cameron J, Howard KA. Cellular recycling-driven in vivo half-life extension using recombinant albumin fusions tuned for neonatal Fc receptor (FcRn) engagement. J Control Release 287: 132–141, 2018. doi: 10.1016/j.jconrel.2018.07.023. [DOI] [PubMed] [Google Scholar]
- 38.Kim J, Bronson CL, Hayton WL, Radmacher MD, Roopenian DC, Robinson JM, Anderson CL. Albumin turnover: FcRn-mediated recycling saves as much albumin from degradation as the liver produces. Am J Physiol Gastrointest Liver Physiol 290: G352–60, 2006. doi: 10.1152/ajpgi.00286.2005. [DOI] [PubMed] [Google Scholar]
- 39.Pyzik M, Rath T, Kuo TT, Win S, Baker K, Hubbard JJ, Grenha R, Gandhi A, Krämer TD, Mezo AR, Taylor ZS, McDonnell K, Nienaber V, Andersen JT, Mizoguchi A, Blumberg L, Purohit S, Jones SD, Christianson G, Lencer WI, Sandlie I, Kaplowitz N, Roopenian DC, Blumberg RS. Hepatic FcRn regulates albumin homeostasis and susceptibility to liver injury. Proc Natl Acad Sci 114: E2862–E2871, 2017. doi: 10.1073/PNAS.1618291114. [DOI] [PMC free article] [PubMed] [Google Scholar]
- 40.Roopenian DC, Akilesh S, Roopenian DC, Akilesh S. FcRn: the neonatal Fc receptor comes of age. Nat Rev Immunol 7: 715–725, 2007. doi: 10.1038/nri2155. [DOI] [PubMed] [Google Scholar]
- 41.Birn H, Fyfe JC, Jacobsen C, Mounier F, Verroust PJ, Ørskov H, Willnow TE, Moestrup SK, Christensen EI, Orskov H. Cubilin is an albumin binding protein important for renal tubular albumin reabsorption. J Clin Invest 105: 1353–1361, 2000. doi: 10.1172/JCI8862. [DOI] [PMC free article] [PubMed] [Google Scholar]
- 42.Medesan C, Cianga P, Mummert M, Stanescu D, Ghetie V, Ward ES. Comparative studies of rat IgG to further delineate the Fc:FcRn interaction site. Eur J Immunol 28: 2092–2100, 1998. doi:. [DOI] [PubMed] [Google Scholar]
- 43.Vaughn DE, Bjorkman PJ. High-affinity binding of the neonatal Fc receptor to its IgG ligand requires receptor immobilization. Biochemistry 36: 9374–9380, 1997. doi: 10.1021/bi970841r. [DOI] [PubMed] [Google Scholar]
- 44.Larsen C, Etzerodt A, Madsen M, Skjødt K, Moestrup SK, Andersen CBF. Structural assembly of the megadalton-sized receptor for intestinal vitamin B12 uptake and kidney protein reabsorption. Nat Commun 9: 5204, 2018. doi: 10.1038/s41467-018-07468-4. [DOI] [PMC free article] [PubMed] [Google Scholar]
- 45.Yammani RR, Seetharam S, Seetharam B. Identification and characterization of two distinct ligand binding regions of cubilin. J Biol Chem 276: 44777–44784, 2001. doi: 10.1074/jbc.M106419200. [DOI] [PubMed] [Google Scholar]
- 46.Challa DK, Velmurugan R, Ober RJ, Ward ES. Fc receptors. Curr Top Microbiol Immunol. 2014; 382: 249–72. doi: 10.1007/978-3-319-07911-0_12 FcRn: from molecular interactions to regulation of IgG pharmacokinetics and functions. [DOI] [PubMed] [Google Scholar]
- 47.Verbrugge FH, Tang WHW, Hazen SL. Protein carbamylation and cardiovascular disease. Kidney Int 88: 474–478, 2015. doi: 10.1038/ki.2015.166. [DOI] [PMC free article] [PubMed] [Google Scholar]
- 48.Sarav M, Wang Y, Hack BK, Chang A, Jensen M, Bao L, Quigg RJ. Renal FcRn reclaims albumin but facilitates elimination of IgG. J Am Soc Nephrol 20: 1941–1952, 2009. doi: 10.1681/ASN.2008090976. [DOI] [PMC free article] [PubMed] [Google Scholar]
- 49.Tenten V, Menzel S, Kunter U, Sicking E-M, van Roeyen CRC, Sanden SK, Kaldenbach M, Boor P, Fuss A, Uhlig S, Lanzmich R, Willemsen B, Dijkman H, Grepl M, Wild K, Kriz W, Smeets B, Floege J, Moeller MJ. Albumin is recycled from the primary urine by tubular transcytosis. J Am Soc Nephrol 24: 1966–1980, 2013. doi: 10.1681/ASN.2013010018. [DOI] [PMC free article] [PubMed] [Google Scholar]
- 50.Eshbach ML, Weisz OA. Receptor-mediated endocytosis in the proximal tubule. Annu Rev Physiol 79: 425–448, 2017. doi: 10.1146/annurev-physiol-022516-034234. [DOI] [PMC free article] [PubMed] [Google Scholar]
- 51.Aseem O, Smith BT, Cooley MA, Wilkerson BA, Argraves KM, Remaley AT, Argraves WS. Cubilin maintains blood levels of HDL and albumin. J Am Soc Nephrol 25: 1028–1036, 2014. doi: 10.1681/ASN.2013060671. [DOI] [PMC free article] [PubMed] [Google Scholar]
- 52.Lindblom A, Quadt N, Marsh T, Aeschlimann D, Mörgelin M, Mann K, Maurer P, Paulsson M. The intrinsic factor-vitamin B12 receptor, cubilin, is assembled into trimers via a coiled-coil alpha-helix. J Biol Chem 274: 6374–6380, 1999. doi: 10.1074/jbc.274.10.6374. [DOI] [PubMed] [Google Scholar]
- 53.Pyzik M, Sand KMK, Hubbard JJ, Andersen JT, Sandlie I, Blumberg RS. The neonatal Fc receptor (FcRn): a misnomer? Front Immunol 10: 1540, 2019. doi: 10.3389/fimmu.2019.01540. [DOI] [PMC free article] [PubMed] [Google Scholar]
- 54.Sand KMK, Bern M, Nilsen J, Dalhus B, Gunnarsen KS, Cameron J, Grevys A, Bunting K, Sandlie I, Andersen JT. Interaction with both domain I and III of albumin is required for optimal pH dependent binding to the neonatal Fc Receptor (FcRn). J. Biol. Chem 1289: 34583–34594, 2014. doi: 10.1074/jbc.M114.587675. [DOI] [PMC free article] [PubMed] [Google Scholar]
- 55.Andersen JT, Dalhus B, Cameron J, Daba MB, Plumridge A, Evans L, Brennan SO, Gunnarsen KS, Bjørås M, Sleep D, Sandlie I. Structure-based mutagenesis reveals the albumin-binding site of the neonatal Fc receptor. Nat Commun 3: 610, 2012. doi: 10.1038/ncomms1607. [DOI] [PMC free article] [PubMed] [Google Scholar]
- 56.Armengol C, Bartolí R, Sanjurjo L, Serra I, Amézaga N, Sala M, Sarrias M-R. Role of scavenger receptors in the pathophysiology of chronic liver diseases. Crit Rev Immunol 33: 57–96, 2013. [PubMed] [Google Scholar]
- 57.Pandey E, Nour AS, Harris EN. Prominent receptors of liver sinusoidal endothelial cells in liver homeostasis and disease. Front Physiol 11: 873, 2020. doi: 10.3389/fpls.2020.00873. [DOI] [PMC free article] [PubMed] [Google Scholar]
- 58.Shetty S, Lalor PF, Adams DH. Liver sinusoidal endothelial cells - gatekeepers of hepatic immunity. Nat Rev Gastroenterol Hepatol 15: 555–567, 2018. doi: 10.1038/s41575-018-0020-y. [DOI] [PMC free article] [PubMed] [Google Scholar]
- 59.Sørensen KK, McCourt P, Berg T, Crossley C, Couteur DL, Wake K, Smedsrød B. The scavenger endothelial cell: a new player in homeostasis and immunity. Am J Physiol Integr Comp Physiol 303: R1217–R1230, 2012. doi: 10.1152/ajpregu.00686.2011. [DOI] [PubMed] [Google Scholar]
- 60.Sørensen KK, Simon-Santamaria J, McCuskey RS, Smedsrød B. Liver sinusoidal endothelial cells. In: Comprehensive Physiology. Hoboken, NJ: John Wiley & Sons, Inc, 2015, p. 1751–1774. [DOI] [PubMed] [Google Scholar]
- 61.Apostolov EO, Shah SV, Ray D, Basnakian AG. Scavenger receptors of endothelial cells mediate the uptake and cellular proatherogenic effects of carbamylated LDL. Arterioscler Thromb Vasc Biol 29: 1622–1630, 2009. doi: 10.1161/ATVBAHA.109.189795. [DOI] [PMC free article] [PubMed] [Google Scholar]
- 62.Alique M, Luna C, Carracedo J, Ramírez R. LDL biochemical modifications: a link between atherosclerosis and aging. Food Nutr Res 59: 29240, 2015. doi: 10.3402/fnr.v59.29240. [DOI] [PMC free article] [PubMed] [Google Scholar]
- 63.Ballabio A, Bonifacino JS. Lysosomes as dynamic regulators of cell and organismal homeostasis. Nat Rev Mol Cell Biol 21: 101–118, 2020. doi: 10.1038/s41580-019-0185-4. [DOI] [PubMed] [Google Scholar]
- 64.Liu X-F, Wei J, Zhou Q, Molitoris BA, Sandoval R, Kobayashi H, Okada R, Nagaya T, Karim B, Butcher D, Pastan I. Immunotoxin SS1P is rapidly removed by proximal tubule cells of kidney, whose damage contributes to albumin loss in urine. Proc Natl Acad Sci U S A 117: 6086–6091, 2020. doi: 10.1073/pnas.1919038117. [DOI] [PMC free article] [PubMed] [Google Scholar]
- 65.Conner KP, Devanaboyina SC, Thomas VA, Rock DA. The biodistribution of therapeutic proteins: mechanism, implications for pharmacokinetics, and methods of evaluation. Pharmacol Ther 212: 107574, 2020. doi: 10.1016/j.pharmthera.2020.107574. [DOI] [PubMed] [Google Scholar]
- 66.Larsen MT, Kuhlmann M, Hvam ML, Howard KA. Albumin-based drug delivery: harnessing nature to cure disease. Mol Cell Ther 4: 3, 2016. doi: 10.1186/s40591-016-0048-8. [DOI] [PMC free article] [PubMed] [Google Scholar]
- 67.Festa BP, Chen Z, Berquez M, Debaix H, Tokonami N, Prange JA, Hoek G. V D, Alessio C, Raimondi A, Nevo N, Giles RH, Devuyst O, Luciani A. Impaired autophagy bridges lysosomal storage disease and epithelial dysfunction in the kidney. Nat Commun 9: 161, 2018. doi: 10.1038/s41467-017-02536-7. [DOI] [PMC free article] [PubMed] [Google Scholar]
- 68.Luciani A, Sirac C, Terryn S, Javaugue V, Prange JA, Bender S, Bonaud A, Cogné M, Aucouturier P, Ronco P, Bridoux F, Devuyst O. Impaired lysosomal function underlies monoclonal light chain-associated renal fanconi syndrome. J Am Soc Nephrol 27: 2049–2061, 2016. doi: 10.1681/ASN.2015050581. [DOI] [PMC free article] [PubMed] [Google Scholar]
- 69.Shamekhi Amiri F. Intracellular organelles in health and kidney disease. Néphrol Thér 15: 9–21, 2019. doi: 10.1016/j.nephro.2018.04.002. [DOI] [PubMed] [Google Scholar]
- 70.Florens N, Yi D, Juillard L, Soulage CO. Using binding competitors of albumin to promote the removal of protein-bound uremic toxins in hemodialysis: hope or pipe dream ? Biochimie 144: 1–8, 2018. doi: 10.1016/j.biochi.2017.09.018. [DOI] [PubMed] [Google Scholar]
- 71.Medina-Navarro R, Torres-Ramos YD, Guzmán-Grenfell AM, Díaz-Flores M, León-Reyes G, Hicks GJJ. Lysosomal dysfunction induced by changes in albumin’s tertiary structure: potential key factor in protein toxicity during diabetic nephropathy. Life Sci 230: 197–207, 2019. doi: 10.1016/j.lfs.2019.05.069. [DOI] [PubMed] [Google Scholar]


