Abstract
Purpose
Dysfunction of the trabecular meshwork (TM) in pigmentary glaucoma contributes to increased aqueous humor outflow resistance and intraocular pressure. In this study, we investigated the effect of pigment dispersion on trabecular meshwork cells.
Methods
Porcine TM cells from ab interno trabeculectomy specimens were exposed to pigment dispersion, then, analyzed for changes in morphology, immunostaining, and ultrastructure. Their abilities to phagocytose migrate, and contraction was quantified. An expression microarray, using 23,937 probes, and a pathway analysis were performed.
Results
Stress fiber formation was increased in the pigment dispersion group (P) (60.1 ± 0.3%, n = 10) compared to control (C) (38.4 ± 2.5%, n =11,p < 0.001). Phagocytosis declined (number of cells with microspheres in P = 37.0 ± 1.1% and in C = 68.7 ± 1.3%, n =3,p < 0.001) and migration was reduced after 6 h (cells within the visual field over 6 h in P = 28.0.1 ± 2.3 (n = 12) and in C = 40.6 ± 3.3 (n =13),p < 0.01). Pigment induced contraction at 24 h onwards (p < 0.01). Microarray analysis revealed that Rho signaling was central to these responses.
Conclusion
Exposure of TM cells to pigment dispersion resulted in reduced phagocytosis and migration, as well as increased stress fiber formation and cell contraction. The Rho signaling pathway played a central and early role, suggesting that its inhibitors could be used as a specific intervention in treatment of pigmentary glaucoma.
Keywords: Pigmentary glaucoma, Trabecular meshwork, Phagocytosis, Migration, Contraction, Cytoskeleton, Rho signaling pathway
Introduction
Reduced outflow at the level of the trabecular meshwork (TM) is a principal cause of elevated intraocular pressure (IOP) in open-angle glaucomas [1, 2]. Pigment dispersion causes pigmentary glaucoma (PG), a form of secondary open-angle glaucoma, in 10% of patients 5 years after initial diagnosis [3, 4]. Medical treatment of PG is often more challenging than other glaucomas, and patients can exhibit high, fluctuating IOP [3, 5]. Pigment released from the iris can accumulate in the TM, but the mechanism for an IOP increase is not well understood. There is an insufficient quantity of pigment in the TM to cause a simple physical outflow obstruction [6]; yet, already a relatively low amount of pigment can induce a hypertensive phenotype in ex vivo perfusion cultures [7–9]. A microarray expression analysis in this model suggested a central role for ROCK and IGF-1 [7].
In the present in vitro study, we sought to separate the TM cells from potentially confounding perfusion system-related factors, including regional outflow differences [10], while avoiding potentially confounding in vivo factors, including an immune response [11]. We characterized changes in the TM cytoskeleton, contractile response, motility, and phagocytosis, as well as pathways associated with these factors [12–15]. Specifically, we characterized changes of expression in the Rho family of small GTPases (Rho, Rac, and Cdc42), which act to rearrange the actomyosin cytoskeleton [16]. Importantly, lysophosphatidic acid, an activator of Rho GTPase, can increase the formation of actin stress fibers [17] and reduce aqueous outflow facility by 37%; a ROCK inhibitor can reverse these effects [17]. Further, Rac GTPase can modulate the intercellular adherens junctions [18] that contribute to TM cell motility [19] and phagocytosis [ 9,20]. We hypothesized that pigment-rich iris cell lysates act on Rho GTPases to cause formation of actin stress fibers, thereby increasing TM contraction, reducing motility, and phagocytosis.
Materials and methods
Primary culture and characterization of porcine trabecular meshwork cells
Porcine eyes were obtained from a local abattoir (Thoma Meat Market, Saxonburg, PA) and processed within 2 h of death. Extraocular tissues were carefully removed. After decontamination of globe exteriors in 5% povidone-iodine solution (3955–16, Ricca Chemical Company, Arlington, TX) for 3 min and three rinses with phosphate-buffered saline (PBS, 14190250, Thermo Fisher Scientific, Waltham, MA), TM tissues were carefully excised under a surgical microscope (S4, Carl Zeiss Meditec, Jena, Germany) by ab interno trabeculectomy. The isolated TM tissues were then cut into 1 mm3 fragments and cultured in reduced serum medium (Opti-MEM, 31985–070, Gibco, Life Technologies, Grand Island, NY), supplemented with 5% fetal bovine serum (FBS, 10438026, Thermo Fisher Scientific, Waltham, MA) and 1% antibiotic-antimycotic (15240062, Thermo Fisher Scientific, Waltham, MA) in TC-treated T25 flasks (CLS430372, Corning, Florence, KY). The medium was changed on day 7 and every 3 days thereafter. Cells were passaged 1:3 after achieving 100% confluence. Only the first four passages of primary TM cells were used for this study.
TM cells were immunostained with preferential TMmarker antibodies to validate their identity. Cell monolayers seeded onto coverslips were fixed in 4% PFA for 1 h and washed three times with PBS. Goat polyclonal anti-MGP (1:100, sc-32820, Santa Cruz, Dallas, Texas), rabbit polyclonal anti-alpha-SMA (1:100, ab5694, Abcam, Cambridge, MA) and anti-AQP1 (1:100, sc-20810, Santa Cruz, Dallas, Texas) antibodies were incubated overnight with the monolayers at 4 °C. After washing three times with PBS, donkey anti-goat Alexa Fluor® 647 (1:1000, ab150131, Abcam, Cambridge, MA) and goat anti-rabbit IgG Superclonal™ (1:1000, A27034, Thermo Fisher Scientific, Waltham, MA) secondary antibodies were incubated with the samples at room temperature for 45 min. Cells incubated with PBS and the secondary antibody, served as a negative control. DAPI (D1306, Thermo Fisher Scientific, Waltham, MA) was added to the samples for 5 min to stain nuclei. Coverslips were placed with the monolayer-side-down on top of a drop of Immu-Mount (9990402, Thermo Scientific, Chicago, IL) on a glass slide. Images were obtained with an upright laser scanning confocal microscope at 400-fold magnification (BX61, Olympus, Tokyo, Japan).
Induction of myocilin (MYOC), using dexamethasone, was used to confirm typical TM cell behavior, commonly seen in steroid-induced glaucoma [21]. Briefly, cells at 50% confluence were exposed to 500 nM dexamethasone for 7 days [22, 23]. Cells cultured without dexamethasone-containing medium served as the control. Cells were lysed in 1 ml TriZol reagent (15596026, Invitrogen, Thermo Fisher, Waltham, MA), the RNA was extracted, and a cDNA library was established using a reverse-transcription kit (4368814, Thermo Fisher Scientific, Waltham, MA). Following the manufacturer’s instructions, quantitative PCR was performed on a real-time PCR system (4376600, Thermo Fisher Scientific, Waltham, MA). The primers used in the study were as follows: MYOC: sense: GGTCATTCCGGCAGTGAAGAA, antisense: ACGCCGTACTTGCCAGTGATT; GAPDH: sense: CCCCACCACACTGAATCTCC, antisense: GGTACTTTATTGATGGTACATGACAAG.
Preparation of pigment suspension
Irises of 10 porcine eyes were isolated and frozen at −80 °C for 2h, then thawed at room temperature for 2h. This process was repeated twice to release pigment granules from lysed cells of the pigment epithelium. A total of 15 ml PBS was added to the suspension, and a 3-ml transfer pipette (13–71120, Fisher Scientific) was used to promote further pigment release through 20 cycles of aspiration and expulsion. The suspension was filtered through a 70-μm cell strainer (431751, Corning Incorporated, Durham, NC). The pigment suspension was diluted to 15 ml with PBS, spun at 3000 rpm for 20 min and the supernatant discarded; these steps were repeated four times. The pellet containing the isolated pigment was resuspended in 4 ml PBS for use as a stock solution. The stock solution was diluted 1000-fold to count pigment particles on a hemocytometer, using × 600 magnification (Eclipse TE200-E, Nikon Instruments Inc., Melville, NY), to determine their concentration.
Actin cytoskeleton
TM cells were seeded at a concentration of 1 × 10⁵ cells/well into a 6-well plate onto coverslips (2855–18, Corning Incorporated, Durham, NC) placed at the bottom of each well. Three wells exposed to pigment at a concentration of 1.67 × 10⁷ granules/ml served as the pigment dispersion group (P), and three wells were exposed to regular medium to serve as a control (C). This relatively low concentration of pigment granules and exposure time had been established before [7]. After incubation for 7.5 days, cells were fixed with 4% PFA for 1 h and washed three times with PBS. Coverslips were removed from their wells and incubated with DAPI for 5 min to label nuclei and with Alexa Fluor 488 Phalloidin (1:60 dilution, A12379, Thermo Fisher, Waltham, MA) for 30 min to label F-actin. Cells were washed with PBS. Coverslips were mounted on glass slides as described above. From each experimental group, pictures were taken with the upright laser scanning confocal microscope (BX61, Olympus, Tokyo, Japan) under the same imaging parameters. Stress fibers were identified based on visual appearance [24] and the number of cells with stress fibers per visual field was counted (C: n =11,P: n =10).
Phagocytic activity assay
Primary TM cells were seeded at a density of 1 × 10⁵ cells/ well into a 6-well plate (657,160, Greiner Bio-One, Frickenhausen, Germany). Three wells in P (n =3) were exposed to pigment dispersion at a concentration of 1.67 × 10⁷ granules/ml for 24 h, while three wells in C served as the pigment-free control. To assess phagocytosis, cells were incubated with 0.5 μm FITC-labeled microspheres (F8813, Thermo Fisher, Waltham, MA), at a concentration of 5 × 10⁸ microspheres/ml, for 1 h. Monolayers were washed three times with pre-warmed PBS, and then cells were dissociated with trypsin and filtered with a 70-μm cell strainer. A singlecell suspension was made, and the percentages of fluorescent TM cells were measured by fluorescence flow cytometry. TM cells not incubated with microspheres served as a control.
Cell contraction assay
A cell contraction assay (CBA-201, Cell Biolabs, San Diego, CA, USA) was conducted according to the manufacturer’s instructions, with minor modifications. In brief, a total of 1 × 10⁶ cells were seeded into each of four T-75 flasks and maintained in TM medium. Pigment was added to one flask at a final concentration of 1.67 × 10⁷ granules/ml, while the three control flasks were sham-treated by adding an equal volume of PBS to the culture media. The medium was changed every 3 days. After 7.5 days, cells were trypsinized and resuspended in media. Collagen type I solution (3.0 mg/ml) was diluted in DMEM to a concentration of 1.9 mg/ml. Neutralized collagen type I solution was mixed with sus-pensions of TM cells at a final cell density of 6 × 10⁵ cells/ml; this step was performed on ice. A volume of 125 μl of the cell-collagen mixture was added to each well of a 96-well plate (3596, Corning Incorporated, Durham, NC) and the mixtures were incubated at 37 °C for 1 h to allow gel formation. After gels had polymerized, 100 μl of TM cell medium was added to each well, and the cell-collagen mixture was incubated at 37 °C for 2 days. After incubation, 30-gauge needles were used to gently detach the gels from the inner walls of each well to initiate contraction. The gels were imaged at 0, 24, and 48 h post-release. The size of the gels was measured using ImageJ software (Version 1.50i, National Institutes of Health). To ensure proper performance of the contraction assay kit, cells treated with the contraction inhibitor (n = 2), 10 mM 2,3-butanedione monoxime (BDM) (CBA-201, Cell Biolabs, San Diego, CA, USA) served as negative control, while cells treated with a contraction promoter (n =2), 50 μM pilocarpine (61314020415, Sandoz, San Francisco, CA) served as a positive control. Pigment dispersion-treated cells (n = 2) served as the experimental group to detect the influence of pigment on TM cell contraction. The treatment-free control group (n = 2) was sham-treated with PBS vehicle alone.
Cell motility assay
As described previously [19], TM cell migration was assessed with a wound healing assay with minor modifications. In short, TM cells were seeded into a 6-well plate at 3 × 10⁵ cells/well and incubated at 37 °C in TM medium reaching confluence, cells were treated with 10 μg/ml mitomycin (M4287, Sigma Aldrich) for 1 h. Cells were washed with PBS three times, and new pre-warmed TM medium was added to the wells. A cell-free gap was created in the monolayer using a 10-μl sterile pipette tip (F1732031, Gilson, Middleton, WI). Detached cells were gently washed away by a combination of gentle agitation of the plate and three exchanges of prewarmed TM media. For cells in P, pigment granules were added into each well at a concentration of 1.67 × 10⁷ granules/ml, while cells in C received an equal volume of PBS vehicle. Cells were cultured in a microscope stage incubator (H301-TC1-HMTC, Okolab, S.r.L., Ottaviano, NA, Italy), and pictures were taken at × 40 magni-fication, every 6 h for a total of 48 h, using a live cell microscope system (Nikon Eclipse TI-E, Nikon, Tokyo, Japan). Cells infiltrating the wound area in each visual field (C: n = 13, P: n = 12) were counted in ImageJ.
Hematoxylin and eosin staining and transmission electron microscopy
TM cells were seeded onto coverslips, expanded to confluency, and fixed in 4% PFA for 30 min. Hematoxylin and eosin (H&E)-stained monolayers were utilized for gross histological evaluation. Pictures of samples were acquired under a SPOT microscope (BX60, Olympus, Tokyo, Japan) at × 400 magnification. To observe finer changes in cellular ultrastructure, transmission electron microscopy (TEM) was used. TEM sample preparation followed a previous protocol [25], with minor modifications. Briefly, cells were cultured in a six-well plate and seeded onto cover glasses. The TM monolayers were fixed for 1 h using 2.5% glutaraldehyde (pH 7.4) and washed with PBS three times. Samples were post-fixed for 1 h in 1% osmium tetroxide solution with 1% potassium ferricyanide. After washing with PBS three times, samples were dehydrated in an ascending ethanol series (30%, 50%, 70%, 90%, and 100% ethanol, 15-min incubations in each solution), and embedded in epon resin (Energy Beam Sciences, East Granby, CT). Epon was exchanged every hour for 3 h and blocks were cured for 2 days at 60 °C. Beam capsules filled with resin were inverted over monolayers and polymerized at 37 °C overnight and then 48 h at 60 °C. A microtome (Reichert-Jung Ultracut 701701 Ultra Microtome) was used to cut 300-nm sections stained with a 0.5% toluidine blue O solution (S25613, Thermo Fisher Scientific, Waltham, MA) to find areas of interest through bright-field microscopy. Ultrathin sections (65-nm thickness) of beam capsules and underlying cells from the monolayer below were obtained, placed on grids, and stained with uranyl acetate and lead citrate. Pictures were taken under an 80 kV Jeol transmission electron microscope (Peabody, The Jeol Legacy, MA) at × 20,000 magnification.
Gene microarray
For P, TM cells were seeded into 60-mm dishes at 8 × 10⁵ cells per dish (n = 3 per group) using TM medium supplemented with 1.67 × 10⁷ pigment granules/mL, while cells in C were cultured in TM medium treated with an equal volume of PBS. After 7.5 days, cells were lysed with Trizol reagent. The lysates were processed at the Genomic Core Facility of the University of Pittsburgh to ensure a high quality during quality control testing. RNA extraction followed our previous protocol [26] and RNA purity was measured with a spectrophotometer (ND-2000, Fisher Scientific, Waltham, MA). For amplification and hybridization, we utilized an affymetrix porcine 3'IVT array, which contains 23,937 probe sets to investigate 23,256 transcripts in the pig, representing 20,201 Sus scrofa genes. The Affymetrix CEL files were loaded and normalized with the transcriptome analysis console (TAC) (version 3.1, affymetrix, Santa Clara, CA). Differential gene expression profiles were determined by applying a threshold of > 1.5-fold linear change, with a p value of < 0.05. Genes that met the above criteria were mapped by bioinformatic pathway analysis software (Ingenuity Pathway Analysis, Qiagen, Hilden, Germany).
Statistics
All quantitative results were represented as mean ± standard error (SE). Differential gene expression and other quantitative data were processed by TAC and PASW 18.0 (SPSS Inc., Chicago, IL, USA) using one-way analysis of variance (ANOVA), respectively. A p value ≤ 0.05 was considered statistically significant. An ANOVA was also used to determine whether there are any statistically significant differences between the means of two or more independent groups in the other experiments.
Results
Characterization of primary porcine TM cells
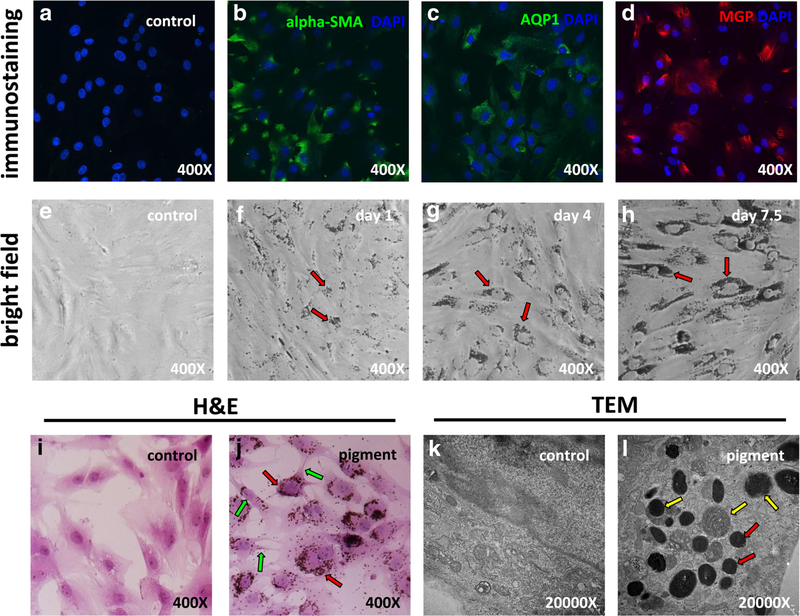
After culture of freshly dissected TM, primary TM cells migrated into the flask and formed clones. These cells exhibited an even, polygonal shape different from the elongated shape of fibroblasts. As we observed previously [7], primary TM cells became larger after 4–6 passages, suggestive of a phenotypic change. Due to this, our experiments only included TM cells that had undergone four or fewer passages. These cells stained positively for the preferential TM markers alpha-SMA [27, 28] (Fig. 1b), AQP1 [29, 30] (Fig. 1c) and MGP [30–33] (Fig. 1d). Compared with the control, transcription of the MYOC gene was upregulated 7.4-fold in cells treated with 500 nM dexamethasone for 7.5 days. TM cells readily phagocytosed fluorescent microspheres.
Fig. 1.
Primary trabecular meshwork (TM) cell characterization and pigment exposure. Probing with TM-specific markers alpha-SMA (b), AQP1 (c), and MGP (d) revealed positive staining for all markers. Bright field imaging of TM cells after 1 day (f, red arrows), 4 days (g, red arrows), and 7.5 days (h, red arrows) of pigment showed accumulation of pigment granules in the cytoplasm and around the cell nuclei. H&E staining of TM cells showed that the pigment granules were located within cells (j, red arrows). Some contraction of cell bodies was observed (j, green arrows). Transmission electron microscopy showed the ultrastructure of organelles (k). In the control (c) group, there were no pigment granules within cells, but in the pigment dispersion group, abundant pigment granules were found in the cytoplasm (l, red arrows). Some pigment granules were in different stages of phagolysosomal digestion (l, yellow arrows)
Morphological and functional changes
Exposure to pigmented iris debris at a concentration of 1.67 × 10⁷ granules/ml resulted in considerable morphological changes in TM cells, which gradually acquired an elongated and polygonal appearance within 1 week (Fig. 1e, f, g, h). H&E staining revealed that most of the phagocytosed pigment particles were localized near the nucleus (Fig. 1j, red arrows). Some contraction of cell bodies was observed (Fig. 1j, green arrows). TEM demonstrated activation of lysosomes and phagosomes in the pigment group. Many pigment particles were ingested and found in different stages of the lysosomal pathway, including hydrolysis by secondary lysosomes (Fig. 1l, yellow arrows). No pigment granules were found in the control TM culture (Fig. 1k).
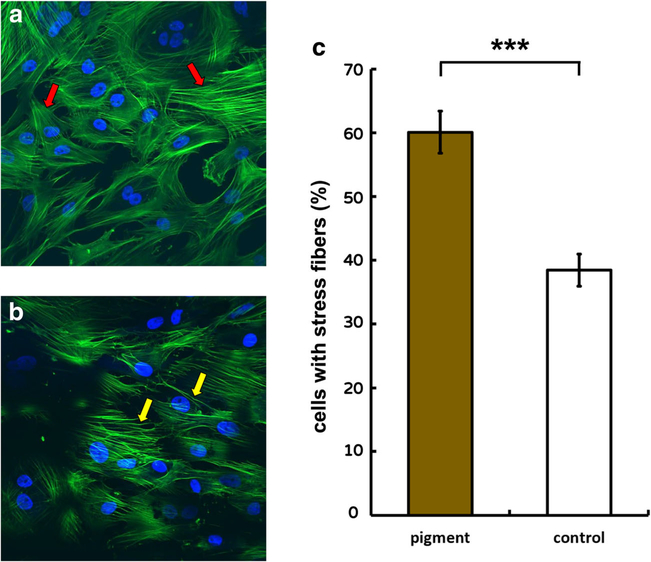
Prior to imaging, monolayers with 3 × 10⁵ cells per well were screened under a confocal microscope. F-actin stress fibers labeled with Alexa Fluor 488 Phalloidin in normal primary TM had a normal organization; actin filaments were smooth and thin (Fig. 2a, red arrows). After 24 h of exposure to pigment dispersion, labeling showed thick, long, and curved stress fibers (Fig. 2b, yellow arrows). A uniform increase in the percentage of cells with stress fibers was seen throughout visual fields in each well of the pigment dispersion group as compared to the control group. This is reflected by statistical results, in which the percentage of cells with stress fibers in P (60.1 ± 3.3%, n = 10 frames) was significantly higher than in C (38.4 ± 2.5%, n = 11 frames, p <0.001).
Fig. 2.
F-actin stress fibers formation. In the control group, trabecular meshwork (TM) cells exhibited smooth and thin F-actin filaments (a, red arrows). After 24 h, TM cells exhibited F-actin with thick, long, and curved stress fibers (b, yellow arrows). The pigment dispersion group (60.1 ± 3.3%, n = 10) contained a significantly larger number of cells with stress fibers, compared to the control group (38.4 ± 2.5%, n = 11, ***p <0.001; c)
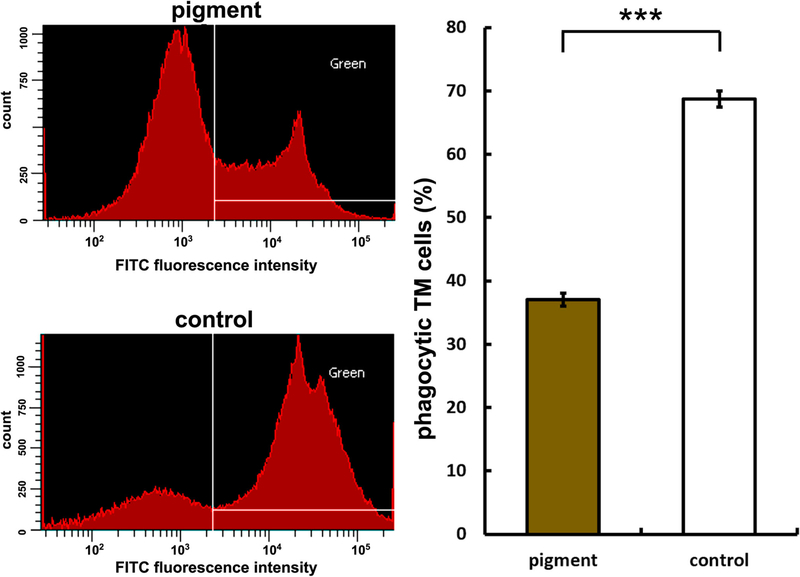
Flow cytometry of TM cells that had phagocytosed fluorescent microspheres showed that pigment dispersion reduced the phagocytosis by 46.1% within 1 day (P = 37.0 ± 1.1%, C = 68.7 ± 1.3%, p < 0.001, Fig. 3).
Fig. 3.
Reduced phagocytosis. Left panels show histograms of cells measured via flow cytometry. White lines demarcate boundaries within which cells are positively labeled for green fluorescence. Cells that contained green microspheres in the pigment dispersion group (top left panel) are compared to control (bottom left panel).Uptake of yellowgreen fluorescent microspheres in the pigment dispersion group was significantly lower (37.0 ± 1.1%) than uptake in the control group (68.7 ± 1.3%, n =3,***p <0.001)
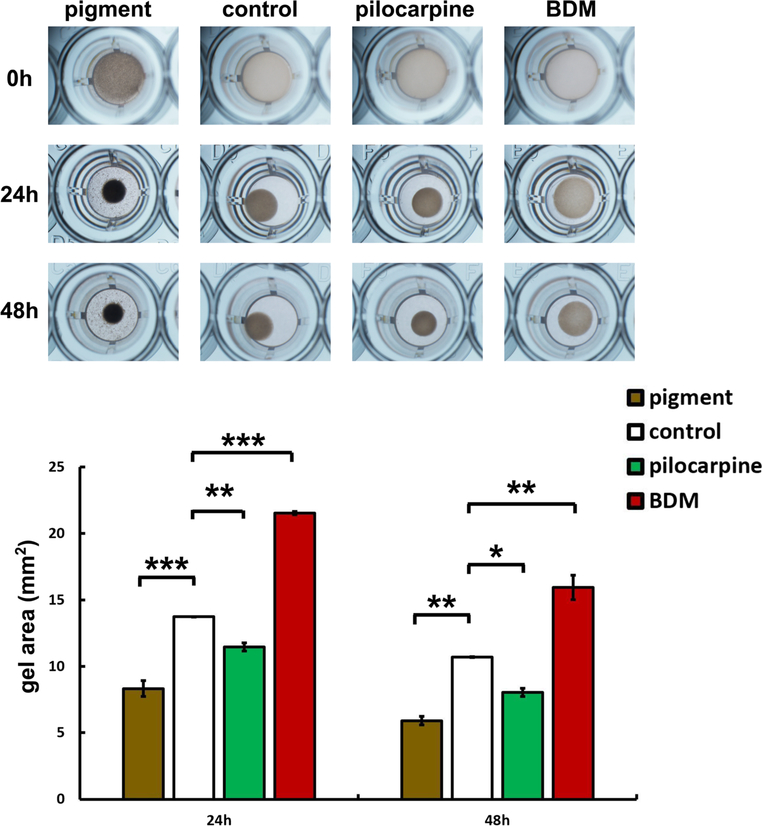
TM cell contractility declined after pigment exposure for 7.5 days. The change in gel area was calculated at 24 h and 48 h after gel detachment and was significantly lower in P than in C at 24 h (P = 8.3 ± 0.6 mm2, C= 13.7 ± 0.0 mm2, n = 2, p < 0.001) and at 48 h (P = 5.9 ± 0.3 mm2, C = 10.7 ± 0.0 mm2, n = 2, p < 0.01). The gel area of C was significantly larger than that of pilocarpine (24 h, C = 13.7 ± 0.0 mm2, pilocarpine, 11.4 ± 0.3 mm2, p < 0.01; 48 h, C = 10.7 ± 0.0 mm2, pilocarpine, 8.1 ± 0.3 mm2, n = 2, p < 0.05) and smaller than in BDM (24 h, C = 13.7 ± 0.0 mm2, BDM = 24.5 ± 0.1 mm2, p <0.001; 48 h, C = 10.7 ± 0.0 mm2, 15.9 ± 0.9 mm2, n = 2, p < 0.01) at 24 and 48 h (Fig. 4).
Fig. 4.
TM cell contraction. Gel contraction is shown at 24 and 48 h post detachment from a baseline of 30 mm2.Pigment contracted the most followed by pilocarpine, the control, and contraction inhibitor 2,3-butanedione monoxime (BDM). Gel area in the pigment-treated group (P) were significantly smaller than gel size in the control group (C) at 24 h (P = 8.3 ± 0.6 mm2, C = 13.6 ± 0.0 mm2, n = 2, ***p < 0.001) and at 48 h (P = 5.9 ± 0.3 mm2, C = 10.7± 0.0 mm2, n =2, **p < 0.01, in this figure). The gel area of C was significantly larger than of the pilocarpine group (n = 2, 24 h **p <0.01, 48 h *p <0.05) and smaller than BDM group (n =2, 24 h ***p <0.001, 48 h **p < 0.01) at 24 and 48 h
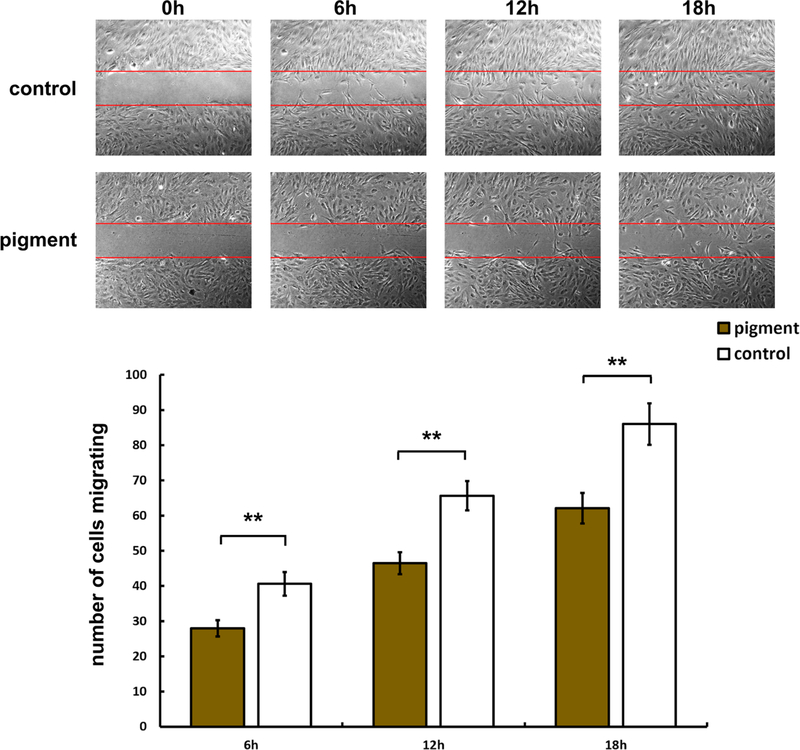
We also evaluated the effect of pigment on cell migration using a wound healing assay. The number of TM cells that migrated into the wounded area was quantified at 6, 12, and 18 h post exposure. The results showed significantly less TM cell migration in P at all three time points, compared with C (C = 40.6 ± 3.3 versus P = 28.0 ± 2.3, p < 0.01 at 6 h; C = 65.7 ± 4.2 versus P = 46.5 ± 3.1, p < 0.01 at 12 h; and C = 86.1 ± 5.9 versus P = 62.2 ± 4.3, p < 0.01 at 18h,Fig. 5).
Fig. 5.
Reduced cell migration. Top panels show representative phasecontrast images of the control group (C) at 0–18 h after wounding. Bottom panels show the pigment-dispersion group (P) at the same time points. Bar chart reveals that cell migration into the denuded area is significantly higher in C than in P at 6 h (Fig. 4, C = 40.6 ± 3.3, P = 28.0.1 ± 2.3, **p < 0.01), 12 h (C = 65.7 ± 4.2, P = 46.5 ± 3.1, **p < 0.01), and 18 h (C = 86.1 ± 5.9, P = 62.2 ± 4.3, **p < 0.01) (C: n = 13 frames per time point, P: n = 12 frames per time point)
Activation of Rho signalling by IGF-1 and TGF-beta after pigment exposure
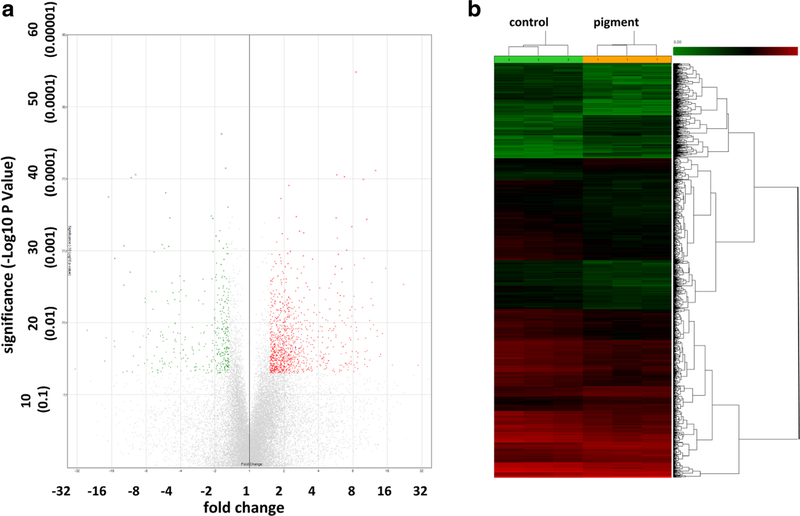
Signal pathways that are related to cellular contraction, migration, phagocytosis, cytoskeletal function, and tight junctions were altered. A total of 24,123 porcine genes were analyzed, of which 262 were significantly upregulated (Fig. 6a, red dots in volcano plot and Fig. 6b, red lines in the heat map) and 631 were significantly downregulated (Fig. 6a, green dots in ± volcano plot in and Fig. 6b, green lines in heat map) by > 1.5-fold (p < 0.05).
Fig. 6.
Gene expression changes. A total of 24,123 porcine genes were analyzed, of which 262 were significantly upregulated (red dots in volcano plot (a) and red lines in heatmap (b)) and 631 were significantly downregulated (green dots in volcano plot in and green lines in heat map) by > 1.5-fold, following pigment dispersion (p < 0.05)
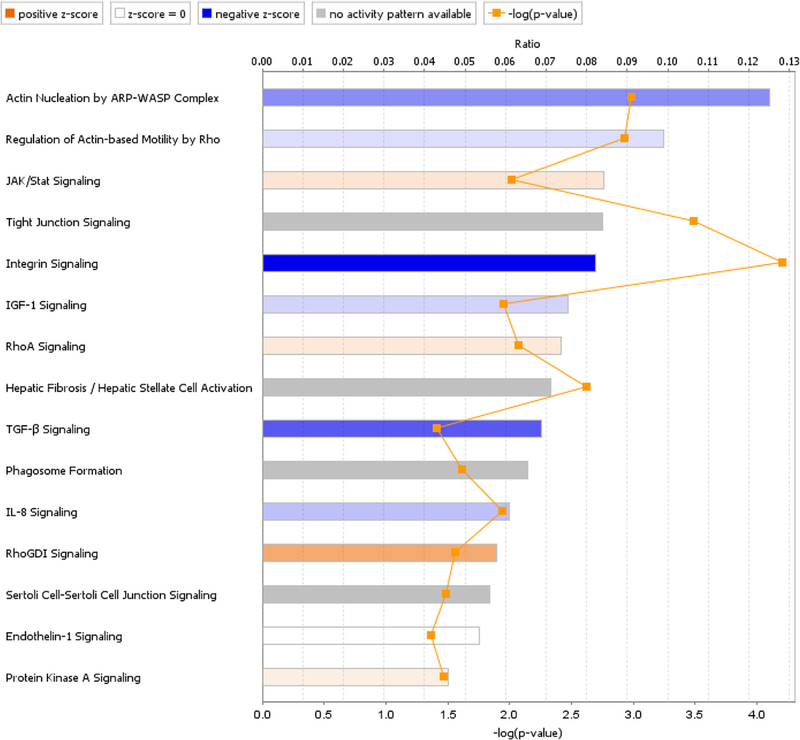
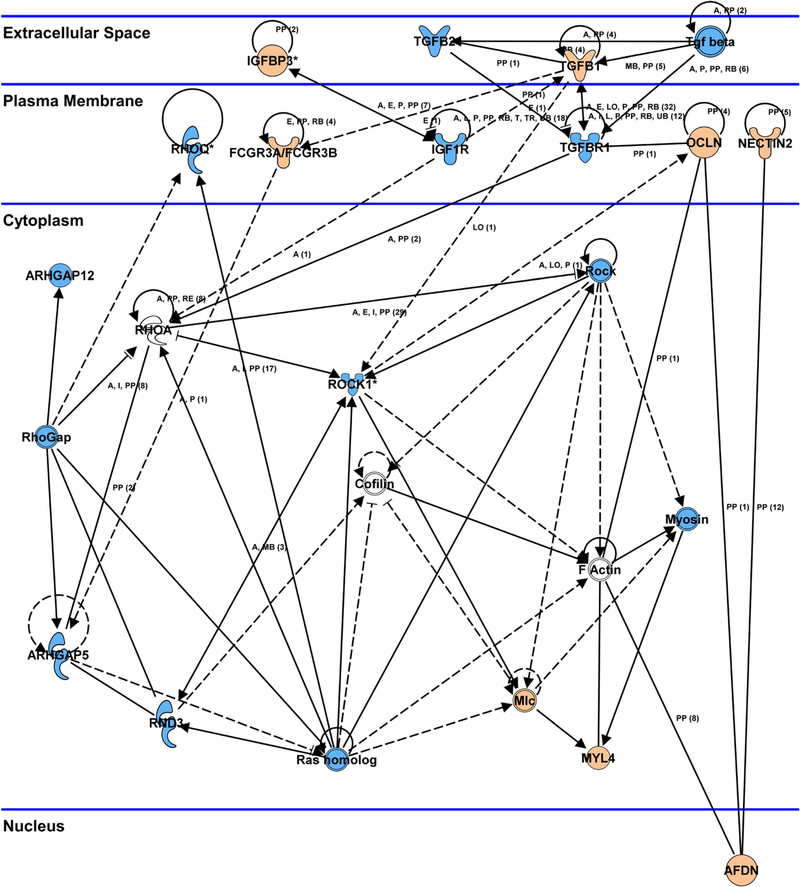
After exclusion of 224 porcine genes with unclear biological functions, 669 porcine genes were mapped with ingenuity pathway analysis (IPA). There was a significantly different expression of transcripts from 15 pathways related to phagocytosis, motility, tight junctions, actin cytoskeleton, and extracellular matrix remodeling (Fig. 7). The Rho pathway played a central role in the response to pigment exposure, in that Rho was activated via stimulation of secreted bioactive molecule receptors, like transforming growth factor (TGF)-ß and type 1 insulin-like growth factor receptor (IGF-1). Activation of the Rho pathway was linked with regulation of myosin light chain (MLC), which was predicted to increase actin stress fiber polymerization and focal adhesion formation. This was predicted to cause increased cellular contraction and decreased cellular migration, as well as inhibition of the phagocytosis (Fig. 8). The phagosome formation pathway was affected and predicted to reduce cellular phagocytosis. IL-8, JAK-Stat, and endothelin-1 signal pathways were involved in regulating cellular migration, while tight junctions were concurrently altered by over-expression of occludin (OCLN) and claudin 3 (CLDN3) (Table 1).
Fig. 7.
Signal pathway changes after pigment exposure. Regulation was significantly different in 15 signal transduction pathways related to phagocytosis, motility, tight junctions, actin cytoskeleton, and extracellular matrix remodeling. The z-score is a statistical measure of the match between expected relationship direction and observed gene expression
Fig. 8.
Network analysis. The Rho signaling pathway played a central role in the response to pigment exposure, and was activated via stimulation of TGF-ß and IGF-1. Activation of the Rho pathway resulted in MLC upregulation, predicted to lead to actin stress fiber polymerization and focal adhesion formation. This process would likely result in increased cellular contraction and decreased cellular migration, as well as inhibition of phagocytosis. Key tight junction genes, including OCLN and CLDN3, were upregulated after pigment exposure. Orange: upregulation, blue: downregulation
Table 1.
Expression changes in key genes and their pathways, following exposure to pigment
| Gene symbol | Entrez gene name | Fold change | p value (ANOVA) | Signal pathways |
|---|---|---|---|---|
| OCLN | Occludin | 8.26 | 0.036 | Tight junction signaling, Sertoli cell-sertoli cell junction signaling |
| FCGR3A/FCGR3B | Fc fragment of IgG receptor IIIa | 5.07 | 0.039 | Phagosome formation |
| ITGA4 | Integrin subunit alpha 4 | 4.12 | 0.007 | RhoGDI signaling, actin nucleation by ARP-WASP complex, integrin signaling, regulation of actin-based motility by Rho, phagosome formation |
| IGFBP3 | Insulin-like growth factor binding protein 3 | 3.73 | 0.003 | IGF-1 signaling |
| CLDN3 | Claudin 3 | 2.76 | 0.024 | Tight junction signaling, Sertoli cell-sertoli cell junction signaling |
| RHOB | ras homolog family member B | 1.89 | 0.004 | RhoGDI signaling, actin nucleation by ARP-WASP complex, integrin signaling, regulation of actin-based motility by Rho, IL-8 signaling, phagosome formation |
| MYL4 | Myosin light chain 4 | 1.87 | 0.023 | RhoA signaling, RhoGDI signaling, regulation of actin-based motility by Rho, tight junction signaling, protein kinase A signaling |
| TGFB1 | Transforming growth factor beta 1 | 1.56 | 0.012 | TGF-β signaling, tight junction signaling, protein kinase A signaling |
| TGFBR1 | Transforming growth factor beta receptor 1 | −1.54 | 0.039 | TGF-β signaling, tight junction signaling, protein kinase A signaling |
| IGF1R | Insulin-like growth factor 1 receptor | −1.56 | 0.037 | RhoA signaling, IGF-1 signaling |
| RHOQ | ras homolog family member Q | −1.58 | 0.040 | RhoGDI signaling, actin nucleation by ARP-WASP complex, integrin signaling, regulation of actin-based motility by Rho, IL-8 signaling, phagosome formation |
| ARHGAP12 | Rho GTPase activating protein 12 | −1.87 | 0.001 | RhoGDI signaling, RhoA signaling |
| ITGB8 | Integrin subunit beta 8 | −1.9 | 0.024 | Integrin signaling |
| ARHGAP5 | Rho GTPase activating protein 5 | −1.93 | 0.047 | RhoGDI signaling, RhoA signaling, integrin signaling |
| ITGAV | Integrin subunit alpha V | −1.96 | 0.018 | IL-8 signaling, integrin signaling |
| TGFB2 | Transforming growth factor beta 2 | −1.99 | 0.029 | TGF-β signaling, tight junction signaling, protein kinase A signaling |
| ROCK1 | Rho associated coiled-coil containing protein kinase 1 | −2.1 | 0.009 | RhoA signaling, actin nucleation by ARP-WASP complex, integrin signaling, regulation of actin-based motility by Rho, IL-8 signaling, protein kinase A signaling |
| ITGA1 | Integrin subunit alpha 1 | −2.24 | 0.017 | integrin signaling |
| IGFBP1 | Insulin like growth factor binding protein 1 | −2.52 | 0.022 | IGF-1 signaling |
| ITGA2 | Integrin subunit alpha 2 | −2.55 | 0.010 | RhoA signaling, actin nucleation by the ARP-WASP complex, integrin signaling, regulation of actin-based motility by Rho, phagosome formation |
| RND3 | Rho family GTPase 3 | −2.91 | 0.045 | RhoA signaling, actin nucleation by ARP-WASP complex, integrin signaling, regulation of actin-based motility by Rho, phagosome formation, IL-8 signaling |
Discussion
In pigmentary glaucoma, pigment particles and stromal debris are released due to posterior iris bowing and friction with lens zonules and ciliary processes [3]. A heavily-pigmented TM is a distinct clinical feature of PG eyes that, when removed, can result in normalization of outflow [34]. Our previous studies in ex vivo perfusion cultures demonstrated that relatively low iris particle concentrations (compared to prior in vivo experiments [11]) can increase IOP by 75% [ 7]. In this in vitro study, we focused on isolated TM cells and observed reductions in TM phagocytosis, motility and contraction, while the stress fiber formation was increased. Consistent with our ex vivo findings, TGF-ß, IGF-1, and ROCK signaling were the three predominant pathways involved in these processes.
The cytoskeleton is composed of actin microfilaments, intermediate filaments, and microtubules [35], which can all impact the aqueous outflow; this occurs through cell contraction, movement, adhesion, and phagocytosis [36–38]. Formation of actin stress fibers can cause TM cell contraction [39] and increased aqueous outflow resistance [ 14]. In our studies, pigment caused TM cells to contract. Stress fibers can be induced in TM cells by a range of agents and stimuli, including dexamethasone [14] and oxidative stresses [ 40]. Conversely, knockdown of 14-3-3z [41] or posttranscriptional inhibition of Rho kinase, using either a micro-RNA [12] or the carboxamide Y-27632 [19], can decrease contraction and increase outflow.
Phagocytosis is another feature of the TM that contributes to maintenance of outflow homeostasis by ensuring that the outflow tract remains free of debris [42, 43]. The present study confirms that porcine TM cells can phagocytose debris, break it down in phagosomes and lysosomes within hours, but this process can be saturated quickly. Our prior study found that pigment debris elevates IOP before phagocytosis declines [9], indicating that cytoskeletal changes impact outflow earlier than it does on phagocytosis. Like phagocytosis and contraction, TM cell migration declined within hours of pigment exposure in this study, not unlike what is induced by glucocorticoids [44], including the IOP elevation [45]. This effect can be countered by use of a Rho-kinase inhibitor [19]. Interestingly, Gottanka et al. [6] observed shortening of the inner wall of Schlemm’s canal in PG that resulted in a partial (65%) lumen obstruction.
Consistent with our ex vivo pigmentary glaucoma model [7], the in vitro signal pathway analysis performed here also indicated that activation of the Rho signaling pathway by TGF-ß and IGF-1 plays a central role. Differences between the ex vivo and in vitro results are likely induced by the culture conditions that subject cells ex vivo to contact inhibition while also providing a host of cell types present in the anterior chamber. TGF-ß-mediated activation of RhoA has been described in primary open-angle glaucoma (POAG) as well [46, 47]. Elevation of IGF-1 can result in Rho pathway activation [48], extracellular matrix (ECM) remodeling [49] and ocular neovascularization [50]. The IGF-1 receptor (IGF-1R) and TGF-ß receptor (TGF-ßR) were located in the TM cell membrane and the Rho signaling pathway was activated by those. Activation of the Rho pathway was linked to MLC phosphorylation and disruption of actomyosin organization. Conversely, inhibition of Rho signaling can result in reduced cell contraction and decreased IOP [12, 51, 52]. Taken together, this data suggest that Rho-kinase inhibitors, currently in preclinical trials [53, 54], may have potential to address early steps of PG pathogenesis.
It is a limitation of our study the wealth of data provided by the microarray analysis, we were unable to present and discuss all differentially regulated genes and pathways. Of the 669 significantly differentially expressed porcine genes used for pathway analysis, we instead focused on genes involved in regulatory networks with known involvement in pigment dispersion and PG. In this network, the Rho pathway played a central role connecting various pathways. Upregulation of MLC indicated an increase of stress fibers with cellular contraction and decreased cellular migration but also inhibition of phagocytosis [24, 55]. Increased contraction can lead to reduced intercellular space and decreased aqueous humor outflow [56] while reduced phagocytosis has the potential to increase the outflow resistance when debris accumulates in the TM [57]. In contrast, the relationship between TM cell migration and elevated IOP is only incompletely understood. TM phagocytosis and migration both decrease after dexamethasone [44, 58] while increased migration may occur after only a brief phagocytosis challenge [59] which differs from the chronic phagocytosis challenge we created with the intention of mimicking PG [7, 9].
In conclusion, we investigated the impact of pigment dispersion on porcine trabecular meshwork cells. We found a decrease of phagocytosis and cell migration, along with an increase in cell contraction and stress fiber formation. A pathway analysis of gene expression indicated a central role for Rho.
Acknowledgments
Funding We acknowledge support from K08-EY022737 (NAL), from NIH CORE Grant P30 EY08098 to the Department of Ophthalmology, from the Initiative to Cure Glaucoma of the Eye and Ear Foundation of Pittsburgh (NAL), the Wiegand Fellowship (YD) and an unrestricted grant from the Research to Prevent Blindness, New York, NY, an unrestricted grant from the Third Xiangya Hospital of Central South University for studying at the University of Pittsburgh (CW).
Footnotes
Conflict of interest The authors declare that they have no conflict of interest.
Compliance with ethical standards
Ethical approval This article does not contain any studies with human participants or animals performed by any of the authors. No animals were sacrificed for the purpose of doing research. An approval by an institutional animal care and use committee was not required.
Publisher’s note Springer Nature remains neutral with regard to jurisdictional claims in published maps and institutional affiliations.
References
- 1.Goel M, Picciani RG, Lee RK, Bhattacharya SK (2010) Aqueous humor dynamics: a review. Open Ophthalmol J 4:52–59 [DOI] [PMC free article] [PubMed] [Google Scholar]
- 2.Stamer WD, Braakman ST, Zhou EH et al. (2015) Biomechanics of Schlemm’s canal endothelium and intraocular pressure reduction. Prog Retin Eye Res 44:86–98 [DOI] [PMC free article] [PubMed] [Google Scholar]
- 3.Niyadurupola N, Broadway DC (2008) Pigment dispersion syndrome and pigmentary glaucoma—a major review. Clin Exp Ophthalmol 36:868–882 [DOI] [PubMed] [Google Scholar]
- 4.Siddiqui Y, Ten Hulzen RD, Cameron JD et al. (2003) What is the risk of developing pigmentary glaucoma from pigment dispersion syndrome? Am J Ophthalmol 135:794–799 [DOI] [PubMed] [Google Scholar]
- 5.De Moraes CG, Susanna R Jr (2016) Glaucomas: pigment dispersion syndrome, pigmentary glaucoma, and angle recession glaucoma In: Giaconi JA, Law SK, Nouri-Mahdavi K et al. (eds) Pearls of glaucoma management. Springer, Berlin Heidelberg, pp 419–430 [Google Scholar]
- 6.Gottanka J, Johnson DH, Grehn F, Lütjen-Drecoll E (2006) Histologic findings in pigment dispersion syndrome and pigmentary glaucoma. J Glaucoma 15:142–151 [DOI] [PubMed] [Google Scholar]
- 7.Dang Y, Waxman S, Wang C et al. (2018) A porcine ex vivo model of pigmentary glaucoma. Sci Rep 8:5468. [DOI] [PMC free article] [PubMed] [Google Scholar]
- 8.Peotter JL, Phillips J, Tong T et al. (2016) Involvement of Tiam1, RhoG and ELMO2/ILK in Rac1-mediated phagocytosis in human trabecular meshwork cells. Exp Cell Res 347:301–311 [DOI] [PMC free article] [PubMed] [Google Scholar]
- 9.Dang Y, Waxman S, Wang C et al. (2018) Intraocular pressure elevation precedes a phagocytosis decline in a model of pigmentary glaucoma. F1000Res 7:174. [DOI] [PMC free article] [PubMed] [Google Scholar]
- 10.Loewen RT, Brown EN, Roy P et al. (2016) Regionally discrete aqueous humor outflow quantification using fluorescein canalograms. PLoS One 11:e0151754. [DOI] [PMC free article] [PubMed] [Google Scholar]
- 11.Epstein DL, Freddo TF, Anderson PJ et al. (1986) Experimental obstruction to aqueous outflow by pigment particles in living monkeys. Invest Ophthalmol Vis Sci 27:387–395 [PubMed] [Google Scholar]
- 12.Luna C, Li G, Huang J et al. (2012) Regulation of trabecular meshwork cell contraction and intraocular pressure by miR-200c. PLoS One 7:e51688. [DOI] [PMC free article] [PubMed] [Google Scholar]
- 13.Nakajima E, Nakajima T, Minagawa Y et al. (2005) Contribution of ROCK in contraction of trabecular meshwork: proposed mechanism for regulating aqueous outflow in monkey and human eyes. J Pharm Sci 94:701–708 [DOI] [PubMed] [Google Scholar]
- 14.Clark AF, Brotchie D, Read AT et al. (2005) Dexamethasone alters F-actin architecture and promotes cross-linked actin network formation in human trabecular meshwork tissue. Cell Motil Cytoskeleton 60:83–95 [DOI] [PubMed] [Google Scholar]
- 15.Filla MS, Schwinn MK, Nosie AK et al. (2011) Dexamethasoneassociated cross-linked actin network formation in human trabecular meshwork cells involves ß3 integrin signaling. Invest Ophthalmol Vis Sci 52:2952–2959 [DOI] [PMC free article] [PubMed] [Google Scholar]
- 16.Amano M, Nakayama M, Kaibuchi K (2010) Rho-kinase/ROCK: a key regulator of the cytoskeleton and cell polarity. Cytoskeleton 67: 545–554 [DOI] [PMC free article] [PubMed] [Google Scholar]
- 17.Mettu PS, Deng PF, Misra UK et al. (2004) Role of lysophospholipid growth factors in the modulation of aqueous humor outflow facility. Invest Ophthalmol Vis Sci 45:2263–2271 [DOI] [PubMed] [Google Scholar]
- 18.Pattabiraman PP, Epstein DL, Rao PV (2013) Regulati adherens junctions in trabecular meshwork cells by Rac GTPase and their influence on intraocular pressure. J Ocul Biol Dis Infor 1 10.13188/2334-2838.1000002 [DOI] [PMC free article] [PubMed] [Google Scholar]
- 19.Koga T, Koga T, Awai M et al. (2006) Rho-associated protein kinase inhibitor, Y-27632, induces alterations in adhesion, contraction and motility in cultured human trabecular meshwork cells. Exp Eye Res 82:362–370 [DOI] [PubMed] [Google Scholar]
- 20.Dang Y, Wang C, Shah P, Waxman S, Loewen RT, Loewen NA (2018) RKI-1447, a rho-kinase inhibitor causes ocular hypotension, actin stress fiber disruption and increased phagocytosis. Preprints 1–17 [DOI] [PMC free article] [PubMed] [Google Scholar]
- 21.Dang Y, Kaplowitz K, Parikh HA et al. (2016) Steroid-induced glaucoma treated with trabecular ablation in a matched comparison with primary open-angle glaucoma. Clin Exp Ophthalmol. 10.1111/ceo.12796 [DOI] [PubMed] [Google Scholar]
- 22.Polansky JR, Fauss DJ, Zimmerman CC (2000) Regulation of TIGR/MYOC gene expression in human trabecular meshwork cells. Eye 14(Pt 3B):503–514 [DOI] [PubMed] [Google Scholar]
- 23.Keller KE, Bhattacharya SK, Borrás T et al. (2018) Consensus recommendations for trabecular meshwork cell isolation, characterization and culture. Exp Eye Res. 10.1016/j.exer.2018.03.001 [DOI] [PMC free article] [PubMed] [Google Scholar]
- 24.Burridge K, Guilluy C (2016) Focal adhesions, stress fibers and mechanical tension. Exp Cell Res 343:14–20 [DOI] [PMC free article] [PubMed] [Google Scholar]
- 25.Yun H, Lathrop KL, Yang E et al. (2014) A laser-induced mouse model with long-term intraocular pressure elevation. PLoS One 9: e107446. [DOI] [PMC free article] [PubMed] [Google Scholar]
- 26.Dang Y, Wu W, Xu Y et al. (2015) Effects of low-level laser irradiation on proliferation and functional protein expression in human RPE cells. Lasers Med Sci. 10.1007/s10103-015-1809-3 [DOI] [PubMed] [Google Scholar]
- 27.de Kater AW, Shahsafaei A, Epstein DL (1992) Localization of smooth muscle and nonmuscle actin isoforms in the human aqueous outflow pathway. Invest Ophthalmol Vis Sci 33:424–129 [PubMed] [Google Scholar]
- 28.Morgan JT, Wood JA, Walker NJ et al. (2014) Human trabecular meshwork cells exhibit several characteristics of, but are distinct from, adipose-derived mesenchymal stem cells. J Ocul Pharmacol Ther 30:254–266 [DOI] [PMC free article] [PubMed] [Google Scholar]
- 29.Stamer WD, Seftor RE, Snyder RW, Regan JW (1995) Cultured human trabecular meshwork cells express aquaporin-1 water chan-nels. Curr Eye Res 14:1095–1100 [DOI] [PubMed] [Google Scholar]
- 30.Tomarev SI, Wistow G, Raymond V et al. (2003) Gene expression profile of the human trabecular meshwork: NEIBank sequence tag analysis. Invest Ophthalmol Vis Sci 44:2588–2596 [DOI] [PubMed] [Google Scholar]
- 31.Xue W, Wallin R, Olmsted-Davis EA, Borras T (2006) Matrix GLA protein function in human trabecular meshwork cells: inhibition of BMP2-induced calcification process. Invest Ophthalmol Vis Sci 47: 997–1007 [DOI] [PMC free article] [PubMed] [Google Scholar]
- 32.Gonzalez P, Caballero M, Liton PB et al. (2004) Expression analysis of the matrix GLA protein and VE-cadherin gene promoters in the outflow pathway. Invest Ophthalmol Vis Sci 45:1389–1395 [DOI] [PubMed] [Google Scholar]
- 33.Gonzalez P, Epstein DL, Borras T (2000) Characterization of gene expression in human trabecular meshwork using single-pass se-quencing of 1060 clones. Invest Ophthalmol Vis Sci 41:3678–3693 [PubMed] [Google Scholar]
- 34.Akil H, Chopra V, Huang A et al. (2016) Clinical results of ab interno trabeculotomy using the Trabectome in patients with pigmentary glaucoma compared to primary open angle glaucoma. Clin Exp Ophthalmol 44:563–569 [DOI] [PubMed] [Google Scholar]
- 35.Wang N, Butler JP, Ingber DE (1993) Mechanotransduction across the cell surface and through the cytoskeleton. Science 260:1124–1127. [DOI] [PubMed] [Google Scholar]
- 36.Tian B, Gabelt BT, Geiger B, Kaufman PL (2009) The role of the actomyosin system in regulating trabecular fluid outflow. Exp Eye Res 88:713–717 [DOI] [PMC free article] [PubMed] [Google Scholar]
- 37.Kaufman PL (2008) Enhancing trabecular outflow by disrupting the actin cytoskeleton, increasing uveoscleral outflow with prosta-glandins, and understanding the pathophysiology of presbyopia: interrogating mother nature: asking why, asking how, recognizing the signs, following the trail. Exp Eye Res 86:3–17 [DOI] [PMC free article] [PubMed] [Google Scholar]
- 38.Tian B, Geiger B, Epstein DL, Kaufman PL (2000) Cytoskeletal involvement in the regulation of aqueous humor outflow. Invest Ophthalmol Vis Sci 41:619–623 [PubMed] [Google Scholar]
- 39.Murphy KC, Morgan JT, Wood JA et al. (2014) The formation of cortical actin arrays in human trabecular meshwork cells in response to cytoskeletal disruption. Exp Cell Res 328:164–171 [DOI] [PMC free article] [PubMed] [Google Scholar]
- 40.Zhou L, Li Y, Yue BY (1999) Oxidative stress affects cytoskeletal structure and cell-matrix interactions in cells from an ocular tissue: the trabecular meshwork. J Cell Physiol 180:182–189 [DOI] [PubMed] [Google Scholar]
- 41.Ye Y, Yang Y, Cai X et al. (2016) Down-regulation of 14–3-3 zeta inhibits TGF-|31-induced actomyosin contraction in human trabecular meshwork cells through RhoA signaling pathwayl4–3-3 zeta regulates actomyosin contraction in TM cells. Invest Ophthalmol Vis Sci 57:719–730 [DOI] [PubMed] [Google Scholar]
- 42.Gagen D, Filla MS, Clark R et al. (2013) Activated αvβ3 integrin regulates αvβ5 integrin-mediated phagocytosis in trabecular meshwork cells. Invest Ophthalmol Vis Sci 54:5000–5011 [DOI] [PMC free article] [PubMed] [Google Scholar]
- 43.Zhang X, Ognibene CM, Clark AF, Yorio T (2007) Dexamethasone inhibition of trabecular meshwork cell phagocytosis and its modulation by glucocorticoid receptor beta. Exp Eye Res 84:275–284 [DOI] [PMC free article] [PubMed] [Google Scholar]
- 44.Clark AF, Wilson K, McCartney MD et al. (1994) Glucocorticoid-induced formation of cross-linked actin networks in cultured human trabecular meshwork cells. Invest Ophthalmol Vis Sci 35:281–294 [PubMed] [Google Scholar]
- 45.Mao W, Tovar-Vidales T, Yorio T et al. (2011) Perfusion-cultured bovine anterior segments as an ex vivo model for studying glucocorticoid-induced ocular hypertension and glaucoma. Invest Ophthalmol Vis Sci 52:8068–8075 [DOI] [PMC free article] [PubMed] [Google Scholar]
- 46.Inatani M, Tanihara H, Katsuta H et al. (2001) Transforming growth factor-beta 2 levels in aqueous humor of glaucomatous eyes. Graefes Arch Clin Exp Ophthalmol 239:109–113 [DOI] [PubMed] [Google Scholar]
- 47.Fuchshofer R, Tamm ER (2012) The role of TGF-ß in the pathogenesis of primary open-angle glaucoma. Cell Tissue Res 347:279–290 [DOI] [PubMed] [Google Scholar]
- 48.Dogan AS, Kabatas N, Erden G et al. (2017) Serum insulin-like growth factor-1 levels in patients with pseudoexfoliation syndrome and glaucoma. Int Ophthalmol 37:371–375 [DOI] [PubMed] [Google Scholar]
- 49.Kilani RT, Guilbert L, Lin X, Ghahary A (2007) Keratinocyte conditioned medium abrogates the modulatory effects of IGF-1 and TGF-ß1 on collagenase expression in dermal fibroblasts. Wound Repair Regen 15:236–244 [DOI] [PubMed] [Google Scholar]
- 50.Smith LE, Shen W, Perruzzi C et al. (1999) Regulation of vascular endothelial growth factor-dependent retinal neovascularization by insulin-like growth factor-1 receptor. Nat Med 5:1390–1395 [DOI] [PubMed] [Google Scholar]
- 51.Ramachandran C, Patil RV, Sharif NA, Srinivas SP (2011) Effect of elevated intracellular cAMP levels on actomyosin contraction in bovine trabecular meshwork cells. Invest Ophthalmol Vis Sci 52: 1474–1485 [DOI] [PMC free article] [PubMed] [Google Scholar]
- 52.Pattabiraman PP, Inoue T, Rao PV (2015) Elevated intraocular pressure induces Rho GTPase mediated contractile signaling in the trabecular meshwork. Exp Eye Res 136:29–33 [DOI] [PMC free article] [PubMed] [Google Scholar]
- 53.Inoue T, Tanihara H (2013) Rho-associated kinase inhibitors: a novel glaucoma therapy. Prog Retin Eye Res 37:1–12 [DOI] [PubMed] [Google Scholar]
- 54.Bacharach J, Dubiner HB, Levy B et al. (2015) Double-masked, randomized, dose-response study of AR-13324 versus latanoprost in patients with elevated intraocular pressure. Ophthalmology 122: 302–307 [DOI] [PubMed] [Google Scholar]
- 55.Tojkander S, Gateva G, Lappalainen P (2012) Actin stress fibers— assembly, dynamics and biological roles. J Cell Sci 125:1855–1864 [DOI] [PubMed] [Google Scholar]
- 56.Tamm ER (2009) The trabecular meshwork outflow pathways: structural and functional aspects. Exp Eye Res 88:648–655 [DOI] [PubMed] [Google Scholar]
- 57.Fujimoto T, Inoue T, Inoue-Mochita M, Tanihara H (2016) Live cell imaging of actin dynamics in dexamethasone-treated porcine trabecular meshwork cells. Exp Eye Res 145:393–400 [DOI] [PubMed] [Google Scholar]
- 58.Matsumoto Y, Johnson DH (1997) Dexamethasone decreases phagocytosis by human trabecular meshwork cells in situ. Invest Ophthalmol Vis Sci 38:1902–1907 [PubMed] [Google Scholar]
- 59.Zhou L, Li Y, Beatrice YJ (1999) Alteration of cytoskeletal structure, integrin distribution, and migratory activity by phagocytic challenge in cells from an ocular tissue—the trabecular meshwork. In Vitro Cell Dev Biol Anim 35:144–149 [DOI] [PubMed] [Google Scholar]


