

Abstract
Background
Understanding mid-term kinetics of immunity to SARS-CoV-2 is the cornerstone for public health control of the pandemic and vaccine development. However, current evidence is rather based on limited measurements, losing sight of the temporal pattern of these changes.
Methods
We conducted a longitudinal analysis on a prospective cohort of COVID-19 patients followed up for >6 months. Neutralizing activity was evaluated using HIV reporter pseudoviruses expressing SARS-CoV-2 S protein. IgG antibody titer was evaluated by ELISA against the S2 subunit, the receptor binding domain (RBD), and the nucleoprotein (NP). Statistical analyses were carried out using mixed-effects models.
Findings
We found that individuals with mild or asymptomatic infection experienced an insignificant decay in neutralizing activity, which persisted 6 months after symptom onset or diagnosis. Hospitalized individuals showed higher neutralizing titers, which decreased following a 2-phase pattern, with an initial rapid decline that significantly slowed after day 80. Despite this initial decay, neutralizing activity at 6 months remained higher among hospitalized individuals compared to mild symptomatic. The slow decline in neutralizing activity at mid-term contrasted with the steep slope of anti-RBD, S2, or NP antibody titers, all of them showing a constant decline over the follow-up period.
Conclusions
Our results reinforce the hypothesis that the quality of the neutralizing immune response against SARS-CoV-2 evolves over the post-convalescent stage.
Funding
This study was funded by Grifols, the Departament de Salut of the Generalitat de Catalunya (grant nos. SLD016 to J.B. and SLD015 to J.C.), the Spanish Health Institute Carlos III (grant nos. PI17/01518 and PI18/01332 to J.C.), CERCA Programme/Generalitat de Catalunya2017 SGR 252, and the crowdfunding initiatives #joemcorono, BonPreu/Esclat, and Correos. The funders had no role in the study design, the data collection and analysis, the decision to publish, or the preparation of the manuscript. E.P. was supported by a doctoral grant from the National Agency for Research and Development of Chile (ANID; 72180406). C.A.-N. was supported by a doctoral grant from Generalitat de Catalunya and Fons Social Europeu (FI). S.P.-Y. was supported by Fundación Canaria Doctor Manuel Morales and Universidad de La Laguna.
Keywords: SARS-CoV-2, humoral response, pseudovirus, neutralization, durability, disease severity
Graphical abstract
Context and significance
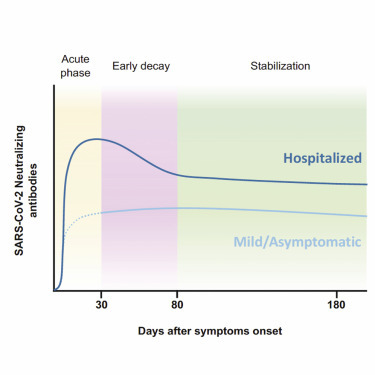
Assessing the durability of neutralizing responses against SARS-CoV-2 is crucial to predict the level of protection in post-convalescent COVID-19 patients. We monitored for >6 months a cohort of 210 SARS-CoV-2-infected individuals with a wide range of symptoms (from asymptomatic infection to severe disease). Our results indicate that neutralizing antibodies are stable for at least 6 months after infection. However, individuals with mild or asymptomatic infection developed lower titers of neutralizing antibodies and could be at higher risk of reinfection. Despite the maintenance of neutralizing antibodies, total antibody titers slowly but gradually declined over time without apparent stabilization. This observation requires further analysis to evaluate the potential role of viral persistence or viral re-exposure in maintaining neutralization titers.
Pradenas et al. describe the kinetics of neutralizing antibodies against SARS-CoV-2 and demonstrate their association with clinical severity and their stability for at least 6 months, despite constant decay of IgG titers. These findings help us to understand the mid-term immune response and the impact on herd immunity.
Introduction
While the early humoral response after severe acute respiratory syndrome-coronavirus-2 (SARS-CoV-2) infection has been thoroughly described,1, 2, 3, 4, 5 current data on the decay of antibody levels beyond the convalescent stage depict a heterogeneous scenario with limited information on the neutralizing activity throughout the follow-up period.6, 7, 8 Various authors have recently suggested more complex kinetics of neutralizing activity decay as compared to total antibody titers, with clonotype-, epitope-, or subject-specific patterns that evolve in terms of potency and resistance to epitope mutations.9, 10, 11 In this study, we longitudinally evaluated the neutralizing humoral response, in mild/asymptomatic and hospitalized individuals infected by SARS-CoV-2, over a 6-month period. These mid-term kinetics showed stable behavior of the neutralizing response in both groups, despite a clear decrease in the total viral-specific humoral response.
Results
Patient selection and early neutralizing responses
Our analysis included 210 patients with RT-PCR-confirmed SARS-CoV-2 infection, recruited during the first and second waves of the coronavirus disease 2019 (COVID-19) epidemic in Catalonia (northeast Spain). Of these, 106 (50.5%) had a mild or an asymptomatic infection, and 104 (49.5%) required hospitalization because of respiratory compromise (Table 1 ). As reported in our country,12 the hospitalization group showed significantly older age and lower frequency of females (Table 1). We collected samples periodically throughout a maximum follow-up period of 242 days (mean follow-up time point of patients from the first COVID-19 wave was 201 days; Figure S1). Most of the study participants developed a neutralizing humoral response against SARS-CoV-2 HIV-based pseudoviruses that was confirmed using infectious viruses.13 However, in line with trends reported elsewhere,6 , 8 mildly affected or asymptomatic individuals developed a 10-fold lower maximal neutralization titer than those who required hospitalization when the full dataset was analyzed (p < 0.0001, Mann-Whitney test; Figure 1 A). The higher number of determinations obtained from hospitalized individuals during the acute phase permitted the clear observation of a sharp initial response (Figures 1B and 1C), also reported in previous analyses of the early response.1, 2, 3, 4, 5 This was visible for individuals recruited during both the first (March–June 2020) and the second (July–October 2020) waves of the COVID-19 pandemic in Catalonia. A longitudinal analysis fitted to a 4-parameter logistic model of increase defined a 30-day sharpening phase after symptom onset, irrespective of the wave in which hospital admission occurred. Half-maximal neutralization activity was achieved on day 10 (95% confidence interval [CI] 8–11); 80% maximal response, which corresponded to 3.97 logs (i.e., 9,333 reciprocal dilution), was achieved on day 14 (Figure 1D). Moreover, as reported previously using an infectious virus neutralization assay,13 we could not find a gender impact on the elicitation of neutralizing antibodies in hospitalized individuals. Based on these findings, irrespective of gender and wave, we decided to set day 30 after symptom onset as a starting point for the longitudinal analysis of immune response at the mid-term.
Table 1.
Characteristics of individuals included in analysis
| Mild/asymptomatic (n = 106) | Hospitalized (n = 104) | p | |
|---|---|---|---|
| Gender, female, n (%) | 72 (68) | 46 (44) | 0.0006a |
| Age, y, median (IQR) | 46.5 (38–54) | 57.5 (46–66) | <0.0001b |
| Individuals with ≥2 samples, n (%) | 52 (49) | 59 (57) | 0.278a |
| Wave of COVID-19 outbreak (first), n (%) | 96 (91) | 73 (70) | – |
| Severity, n (%) | |||
| Asymptomatic | 8 (8) | – | – |
| Mild | 98 (92) | – | – |
| Hospitalized non-severe | – | 59 (56.7) | – |
| Hospitalized severe | – | 37 (35.6) | – |
| Hospitalized (intensive care unit) | – | 8 (7.7) | – |
IQR, interquartile range (25th and 75th percentiles).
Chi-square test.
Mann-Whitney test.
Figure 1.
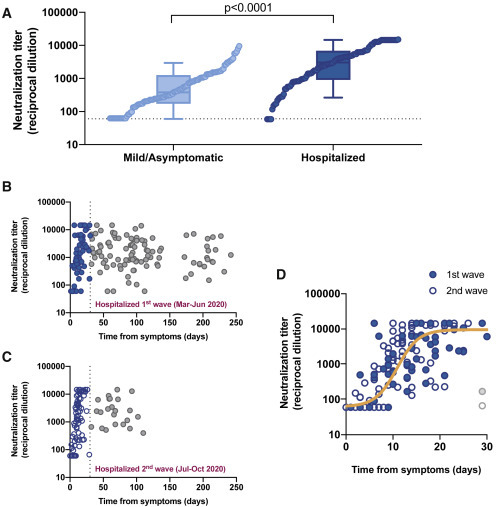
Neutralizing activity among study participants
(A) Maximal neutralization titer of 210 individuals recruited according to disease severity (light and dark blue for mild/asymptomatic and hospitalized individuals, respectively). Boxes show the median and the interquartile range and bars the 10th and 90th percentiles. Distributions were compared using the Mann-Whitney test. Individual values are ranked for comparative purposes.
(B and C) Longitudinal dot plot of neutralizing activity among hospitalized individuals admitted during the first (B) and second (C) waves of the COVID-19 epidemic in our area; filled (B) and empty (C) blue dots show the early (i.e., 30 days after diagnosis) increasing phase.
(D) Magnification of the early phase for individuals admitted during the first (filled symbols) and second (empty symbols) waves. No differences between waves were observed. The solid orange line shows the non-linear fit (mixed-model estimate) for the whole dataset (125 samples, 55 individuals analyzed). Two samples from late seroconverters (1 from each wave, gray dots) were excluded from the analysis.
Assessment of mid-term neutralizing responses
The longitudinal modeling of the neutralizing activity at mid-term in our cohort revealed a nearly flat slope (i.e., not significantly different from 0, with a half-life of 2,134 days) in individuals with asymptomatic infection or mild disease (Figure 2 A). Conversely, the decrease in neutralizing activity in hospitalized individuals showed a 2-phase pattern, with a rapid decay (half-life 31 days) until day 80, which slowed down to a flat slope (half-life 753 days) from that time point on (Figure 2B). In agreement with previous data, suggesting a faster decay of neutralizing antibodies in male compared to female infected individuals,9 , 14 we found significant gender differences in early decay; however, upon stabilization of neutralization titers after day 80, no gender impact was observed in our cohort (Figure S2).
Figure 2.
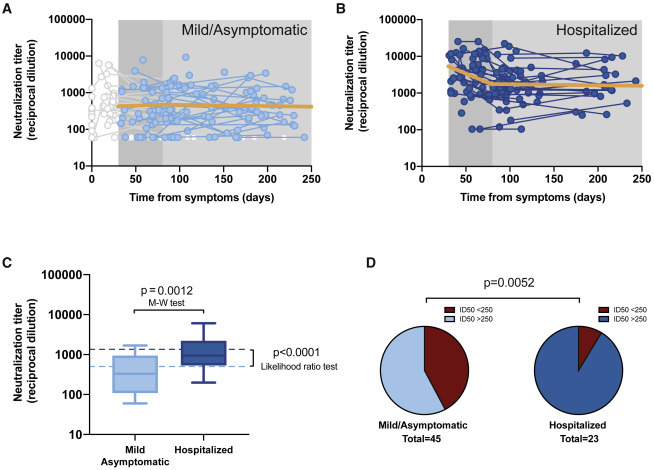
Longitudinal analysis of neutralizing activity
(A) Individual measurements (dots) and linear mixed model (solid orange line) of the longitudinal analysis for mild or asymptomatic individuals beyond day 30 (single-phase slope −0.00014; p = 0.75, likelihood ratio test; estimated half-life 2,134 days). Time points preceding day 30 as well as participants only showing undetectable titers were excluded from the analysis; values are shown but grayed out.
(B) The corresponding analysis for hospitalized individuals (the slopes of the linear fit for the first and second phase were −0.0096 [p = 0.0002] [half-life 31 days] and −00004 [half-life 753 days] [p = 0.78], respectively).
(C) Distribution of neutralizing activity 6 months after infection in both disease severity groups. Experimental values of mean neutralizing activities in the period 135–242 days as summarized in boxplots (as in Figure 1A; Mann-Whitney test for comparative analysis) and modeled data as dotted lines (likelihood ratio test for comparative analysis).
(D) Frequency of long-term neutralizers (i.e., individuals with mean neutralizing activity >250 in the 135–242 days period) in each severity subgroup (chi-square test p value is shown).
The characterization of the neutralizing activity behavior at mid-term should ultimately project the proportion of post-convalescent individuals protected against new infections in the mid- and long-terms. The limited number of measures and lack of a clear threshold of neutralizing activity for preventing SARS-CoV-2 infection precluded assessing this outcome using survival analysis. Alternatively, we explored the neutralizing activity at the end of our 6-month follow-up period. Based on the mixed-effects model obtained from the longitudinal analysis, we estimated a stable mid-term neutralizing activity of 2.72 and 3.16 log for the mild/asymptomatic and hospitalized subgroups, respectively (p < 0.0001; likelihood ratio test; Figure 2C, dotted lines). This estimate was consistent with the observed values for the last measurement taken between days 135 and 242, a time frame centered on day 180 (Figure 2C, boxplots). Likewise, the value distribution at this time frame showed significant differences between mild/asymptomatic (median 2.5; interquartile range [IQR] 2.0–3.0) and hospitalized (3.0; 2.7–3.3) individuals (p = 0.0012, Mann-Whitney test). To date, no clear cutoff for a neutralizing activity that protects against new reinfection has been established. Nevertheless, data gathered from high attack rate events suggest that neutralizing activities between 1:161 and 1:3,082 are strong enough to prevent infection.15 Hence, we assumed that reinfections would be unlikely among individuals above the 1:250 cutoff. Of the 23 hospitalized individuals with measurement beyond day 135, 21 (91%) had a mean neutralizing activity value above 1:250 and were thus considered long-term neutralizers. The corresponding proportion in the mild/asymptomatic group (42%; 19/45) was significantly lower (p = 0.0052, chi-square test; Figure 2D). Although this number must be considered cautiously due to the cutoff assumption, our finding suggests that hospitalized patients have a higher capacity for long-term neutralization, despite the faster initial decay in neutralization activity.
Comparative analysis of neutralizing responses and immunoglobulin G (IgG) titers
It has recently been proposed that the kinetics of neutralizing activity may not mirror those of antibody titers.11 Hence, we investigated the change in IgG titers in a subset of 28 individuals (14 in each severity group) with the most extended follow-up period. The analysis included antibodies against the S protein receptor-binding domain (RBD), the main target of SARS-CoV-2-specific neutralizing antibodies16; the S2 subunit of the S protein, which may also contribute to neutralizing activity and is more cross-reactive with other coronaviruses17; and the nucleoprotein (NP), which is very abundant, albeit unable to neutralize the SARS-CoV-2.16 The longitudinal analysis revealed a 1-phase significant (p < 0.0001) steady decay pattern of all tested antibodies, which was notably faster in anti-NP IgG (Figures 3 A–3C). The half-lives of anti-RBD, anti-S2, and anti-NP antibodies for the period beyond day 30 were 86, 108, and 59 days, respectively. These values were consistent with those reported by Wheatley et al.,11 estimated on a 160-day time frame. Although the limited sample size of this sub-analysis precluded independent modeling of the decay in mild/asymptomatic and hospitalized patients, the latter showed significantly higher titers of anti-S2 at the end of the follow-up period (Figure S3), whereas no significant differences were found in other antibodies regarding disease status. Interestingly, in this subset of individuals, the decay in antibody titers contrasted with the behavior of neutralizing activity, which fitted to a 2-phase model—as in the whole dataset—with a rapid decay until day 80 (slope 0.014, half-life 22 days) and a flat slope (i.e., not significantly different from 0) afterward (Figure 3D).
Figure 3.
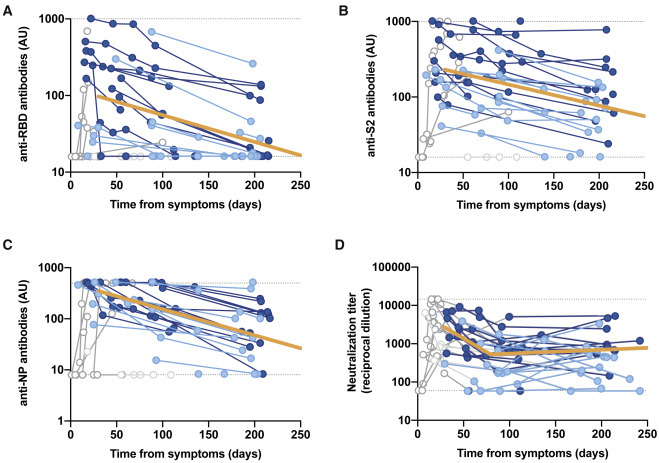
Longitudinal analysis of IgG titers
(A) Anti-receptor binding domain (RBD).
(B) Anti-S2.
(C) Anti-nucleoprotein.
(D) Overall neutralizing activity in the same set of samples. All of the analyses were performed on a subset of individuals with the largest follow-up (n = 14 for mild/asymptomatic in light blue and n = 14 for hospitalized in dark blue; total no. samples 94). Solid orange lines show the linear mixed model estimate for the period beyond day 30.
Kinetics of antibody decay (A–C) were calculated excluding time points preceding the maximal values for each patient. Kinetics of neutralizing antibodies excluded samples preceding day 30 (as in Figures 2A and 2B). All of the excluded values are shown but grayed out.
Discussion
Complementary data on the binding affinity and B cell clone abundance at the same time points would provide a more comprehensive picture to explain this divergent trend. However, our findings support the hypothesis of Gaebler et al.,10 who suggested that the accumulation of IgG somatic mutations—and subsequent production of antibodies with increased neutralizing potency—allow the maintenance of neutralizing activity levels, despite the decline in specific antibody titers. Of note, our follow-up period encompassed 2 waves of the COVID-19 outbreak in our country. Individuals infected during the first wave were likely to be exposed to high viral pressure in their environment, potentially favoring further virus exposure that may also contribute to maintaining humoral responses, adding to the mechanism proposed by Gaebler et al.10
Our longitudinal analysis supplements current evidence regarding mid-term immunity against SARS-CoV-28 , 10 , 11 and confirms the slow decay and mid-term maintenance of neutralizing activity observed in other cohorts, with a 5%-to-11% prevalence of hospitalized patients.8 , 10 In this regard, the 2-phase behavioral pattern of neutralizing activity observed in hospitalized individuals suggests that the rapid decay reported in previous characterizations7 may be due to the abundance of individuals in this early phase. Furthermore, apparent inconsistencies found between the declines of neutralizing activity and IgG titers reinforce the idea proposed by other authors that the behavior of antibody titers may not mirror the neutralizing activity. Interestingly, differences in decline were observed not only between neutralizing activity and anti-N antibodies, which do not contribute to neutralization, but also for anti-S2 and anti-RBD antibodies, which are major determinants of neutralization.16 , 17 The current evidence on immunity to SARS-CoV-2 infection suggests stability of neutralizing activity, pointing toward an optimistic scenario for the establishment of infection- or vaccine-mediated herd immunity. Still, long-term data available on other human coronaviruses show waning of antibodies 1–2 years after infection,18 , 19 with uncertainty regarding the immune response behavior in the context of vaccine-mediated immunity.20 The continuity of our prospective cohort of individuals recovered from SARS-CoV-2 infection will provide novel insights into the long-term kinetics of the immune response.
Limitations of Study
Our analysis is limited by the reduced sample size, particularly in the acute phase for mild/asymptomatic subgroup, for which we failed to define the kinetics of neutralizing response development and to identify a 2-phase pattern decay. Despite the limited sample size, the availability of multiple measures along the follow-up period allowed us to provide a longitudinal perspective on neutralizing activity and antibody titer behavior.
STAR★Methods
KEY RESOURCES TABLE
| REAGENT or RESOURCE | SOURCE | IDENTIFIER |
|---|---|---|
| Antibodies | ||
| Anti-6x-His clone HIS.H8 | Thermo Fisher Scientific | Cat#MA1-21315; RRID: AB_557403 |
| HRP-conjugated, F(ab’)2 goat anti-human IgG | Jackson ImmunoResearch | Cat#109-035-006; RRID: AB_2337578 |
| Bacterial and virus strains | ||
| pNL4-3.Luc.R-.E- | NIH ARP | Cat#3418 |
| SARS-CoV-2.SctΔ19 | This paper | N/A |
| pcDNA3.4-TOPO | GeneArt/Thermo Fisher Scientific | Cat#810330DE |
| pVSV-G | Clontech | 21 |
| Biological samples | ||
| ELISA standard, positive plasma sample | This paper | N/A |
| Chemicals, peptides, and recombinant proteins | ||
| S2 (Ser686-Pro1213) | Sino Biological | Cat#40590-V08B |
| RBD (Arg319-Phe541) | Sino Biological | Cat#40592-V08H |
| Nucleocapsid protein (NP) | Sino Biological | Cat#40588- V08B |
| MACS BSA solution | Miltenyi Biotec | Cat#130-091-376 |
| Phosphate Buffered Saline | Thermo Fisher Scientific | Cat#10010015 |
| o-Phenylenediamine dihydrochloride | Sigma-Aldrich | Cat#P8787-100TAB |
| H2SO4 | Sigma-Aldrich | Cat#258105-1L-PC-M |
| Fetal Bovine Serum | Thermo Fisher Scientific | Cat#10270106 |
| Dulbecco’s Modified Eagle Medium | Thermo Fisher Scientific | Cat#41966052 |
| Expi293 Expression Medium | Thermo Fisher Scientific | Cat#A1435102 |
| Opti-MEM I Reduced Serum Medium | Thermo Fisher Scientific | Cat#31985070 |
| ExpiFectamine 293 Transfection Kit | Thermo Fisher Scientific | Cat#A14524 |
| Versene | Thermo Fisher Scientific | Cat#15040033 |
| Puromycin | Thermo Fisher Scientific | Cat#A1113803 |
| DEAE-Dextran | Sigma-Aldrich | Cat#D9885-100G |
| BriteLite Plus Luciferase | PerkinElmer | Cat#6066769 |
| Experimental models: cell lines | ||
| Expi293F GnTI- cells | Thermo Fisher Scientific | Cat#A39240 |
| HEK293T/hACE2 cells | Integral Molecular | Cat#C-HA101 |
| Software and algorithms | ||
| GraphPad Prism v8.4.3 | GraphPad Software | https://www.graphpad.com/scientific-software/prism/ |
| R v4.0 | R Foundation for Statistical Computing | https://www.r-project.org/ |
| “nlme” R Package | R Foundation for Statistical Computing | https://cran.r-project.org/web/packages/nlme/index.html |
| Other | ||
| GeneArt Gene Synthesis | Thermo Fisher Scientific | N/A |
Resource availability
Lead contact
Further information and requests for resources and reagents should be directed to and will be fulfilled by the Lead Contact, Julià Blanco (jblanco@irsicaixa.es).
Materials availability
The plasmid pcDNA3.4 SARS-CoV-2.SctΔ19 is available upon request to the lead contact.
Data and code availability
This study did not generate any unique datasets or code.
Experimental model and subject details
Study overview and subjects
The study was approved by the Hospital Ethics Committee Board from Hospital Universitari Germans Trias i Pujol (PI-20-122 and PI-20-217) and all participants provided written informed consent before inclusion.
Plasma samples were obtained from individuals of the prospective KING cohort of the HUGTiP (Badalona, Spain). This is an observational cohort, no blinding or randomization was applied. The recruitment period lasted from March to October 2020, thus covering the first and second waves of COVID-19 outbreak in Catalonia (dadescovid.cat). The KING cohort included individuals with a documented positive RT-qPCR result from nasopharyngeal swab and/or a positive serological diagnostic test. In addition, we performed in all individuals a confirmatory ELISA test, analyzing IgG, IgM and IgA anti-RDB and anti-S2 responses, that has been developed in our center (https://www.irsicaixa.es/sites/default/files/detection_of_sars-cov-2_antibodies_by_elisa_-_protocol_by_irsicaixa_protected.pdf). Participants were recruited irrespective of age and disease severity—including asymptomatic status- in various settings, including primary care, hospital, and epidemiological surveillance based on contact tracing. Age under 18 was the sole exclusion criterion. Stratification of participants was performed according to the WHO progression scale:22 asymptomatic or mild (levels 1-3), and hospitalized (levels 4-10). We collected plasma samples at the time of COVID-19 diagnosis and at 3 and 6 months. Additionally, hospitalized individuals were sampled twice a week during the acute phase.
Cell lines
HEK293T cells (presumably of female origin) overexpressing WT human ACE-2 (Integral Molecular, USA) were used as target for SARS-CoV-2 spike expressing pseudovirus infection. Cells were maintained in T75 flasks with Dulbecco′s Modified Eagle′s Medium (DMEM) supplemented with 10% FBS and 1μg/mL of Puromycin (Thermo Fisher Scientific, USA).
Method details
Humoral response determination
The humoral response against SARS-CoV-2 was evaluated with an in-house sandwich- ELISA using the following antigens (Sino Biological, Germany): S2 (Ser686-Pro1213), RBD (Arg319-Phe541), both potentially contributing to neutralizing activity; and whole nucleocapsid protein (NP), which is unrelated to neutralizing capacity. Nunc MaxiSorp plates were coated with 50 μL of anti-6x-His antibody clone HIS.H8 (2 μg/mL, Thermo Fisher Scientific) in PBS overnight at 4°C. After washing, plates were blocked with 1% BSA in PBS (Miltenyi Biotec, Germany) for two hours at room temperature. Antigens were added at 1 μg/mL concentration (50 μL/well) and incubated overnight at 4°C. Plasma samples were heat-inactivated before use (56°C for 30 minutes) and analyzed in duplicate in antigen-coated and antigen-free wells in the same plate. Serial dilutions of a positive plasma sample were used as standard. A pool of pre-pandemic plasmas from healthy controls was used as a negative control. Standards, negative control, and plasma samples were diluted in blocking buffer and were incubated (50 μL/well) for one hour at room temperature. The HRP-conjugated (Fab)2 goat anti-human IgG (Fc specific, Jackson ImmunoResearch, UK) was then incubated for 30 minutes at room temperature. Plates were revealed with o-Phenylenediamine dihydrochloride (Sigma-Aldrich, USA) and reaction was stopped using 4N of H2SO4 (Sigma-Aldrich). Optical density (OD) at 492 nm with noise correction at 620 nm were used to calculate specific signal for each antigen after subtracting the antigen-free well signal for each sample. Standard curves were fitted to a 5-parameter logistic curve and data was expressed as arbitrary units (AU) according to the standard.
Pseudovirus generation and neutralization assay
HIV reporter pseudoviruses expressing SARS-CoV-2 S protein and Luciferase were generated. pNL4-3.Luc.R-.E- was obtained from the NIH AIDS Reagent Program.23 SARS-CoV-2.SctΔ19 was generated (GeneArt) from the full protein sequence of SARS-CoV-2 spike with a deletion of the last 19 amino acids in C-terminal,24 human-codon optimized and inserted into pcDNA3.4-TOPO. Expi293F cells were transfected using ExpiFectamine293 Reagent (Thermo Fisher Scientific) with pNL4-3.Luc.R-.E- and SARS-CoV-2.SctΔ19 at a 24:1 ratio, respectively. Control pseudoviruses were obtained by replacing the S protein expression plasmid with a VSV-G protein expression plasmid as reported.21 Supernatants were harvested 48 hours after transfection, filtered at 0.45 μm, frozen, and titrated on HEK293T cells overexpressing WT human ACE-2 (Integral Molecular, USA). This neutralization assay has been previously validated in a large subset of samples.13
Neutralization assays were performed in duplicate. Briefly, in Nunc 96-well cell culture plates (Thermo Fisher Scientific), 200 TCID50 of pseudovirus were preincubated with three-fold serial dilutions (1/60–1/14,580) of heat-inactivated plasma samples for 1 hour at 37°C. Then, 2x10⁴ HEK293T/hACE2 cells treated with DEAE-Dextran (Sigma-Aldrich) were added. Results were read after 48 hours using the EnSight Multimode Plate Reader and BriteLite Plus Luciferase reagent (PerkinElmer, USA). The values were normalized, and the ID50 (the reciprocal dilution inhibiting 50% of the infection) was calculated by plotting and fitting the log of plasma dilution versus response to a 4-parameters equation in Prism 8.4.3 (GraphPad Software, USA).
Quantification and statistical analysis
Continuous variables were described using medians and the interquartile range (IQR, defined by the 25th and 75th percentiles), whereas categorical factors were reported as percentages over available data. Quantitative variables were compared using the Mann-Whitney test, and percentages using the chi-square test. All experimental data were generated in duplicates. Kinetics of neutralizing activity and antibody titers (Log10 transformed to approximate to a normal distribution) were estimated from symptom onset—or serological diagnosis in asymptomatic individuals—and modeled using mixed-effects models in two steps. First, a 4-parameter logistic function was adjusted for the first 30 days after diagnosis using non-linear mixed models. Mid-term decay was analyzed using a piecewise regression with two decline slopes for data beyond 30 days, with a breakpoint at 80 days. For the latter analysis, linear mixed-effect models with random intercepts and slopes were used, and different breakpoints were tested; the best fit was chosen. For the longitudinal analysis of neutralizing activity, patients were grouped into two severity groups according to the WHO progression scale:22 asymptomatic or mild (levels 1-3), and hospitalized (levels 4-10). Differences between the two severity groups were assessed using the likelihood ratio test. Association of neutralizing titers with gender was analyzed adjusting fitted models by gender and computing the corresponding likelihood ratio test. The longitudinal analysis of antibody titers was performed on a subset of 28 individuals (14 in each severity group) with the highest number of measures during the follow-up; owing to the limited sample size, all individuals were analyzed as a single group. Analyses were performed with Prism 8.4.3 (GraphPad Software) and R version 4.0 (R Foundation for Statistical Computing). Mixed-effects models were fitted using “nlme” R package.
Acknowledgments
We are grateful to all of the participants and the technical staff of IrsiCaixa for sample processing. Gerard Carot-Sans provided medical writing support during the preparation of the manuscript.
Author contributions
J.B. and B.C. designed and coordinated the study. E.P., B.T., S.M., C.A.-N., M.L.R., F.T.-F., S.P.-Y., C.R., E.A.-E., J.R., J.V.-A., J.S., and N.I.-U. performed and analyzed the neutralization and ELISA assays. V.U. performed the statistical analysis. R.P., L.M., A.C., M.M., V.G., A.V., and J.C. selected the patients and coordinated the data. J.B. and Gerard Carot-Sans drafted the manuscript, and all of the authors made substantial contributions to the revision of the subsequent versions. All of the authors approved the submitted version of the manuscript and agreed both to be personally accountable for their own contributions and to ensure answer to questions related to the accuracy or integrity of any part of the work.
Declaration of interests
J.B. and J.C. are founders of and shareholders in AlbaJuna Therapeutics; B.C. is a founder of and shareholder in AlbaJuna Therapeutics and AELIX Therapeutics (all unrelated to the present work). The other authors declare no competing interests.
Published: January 31, 2021
Footnotes
Supplemental information can be found online at https://doi.org/10.1016/j.medj.2021.01.005.
Supplemental information
References
- 1.Zhao J., Yuan Q., Wang H., Liu W., Liao X., Su Y., Wang X., Yuan J., Li T., Li J., et al. Antibody Responses to SARS-CoV-2 in Patients With Novel Coronavirus Disease 2019. Clin. Infect. Dis. 2020;71:2027–2034. doi: 10.1093/cid/ciaa344. [DOI] [PMC free article] [PubMed] [Google Scholar]
- 2.Xiao A.T., Gao C., Zhang S. Profile of specific antibodies to SARS-CoV-2: the first report. J. Infect. 2020;81:147–178. doi: 10.1016/j.jinf.2020.03.012. [DOI] [PMC free article] [PubMed] [Google Scholar]
- 3.Suthar M.S., Zimmerman M.G., Kauffman R.C., Mantus G., Linderman S.L., Hudson W.H., Vanderheiden A., Nyhoff L., Davis C.W., Adekunle O., et al. Rapid Generation of Neutralizing Antibody Responses in COVID-19 Patients. Cell Rep Med. 2020;1:100040. doi: 10.1016/j.xcrm.2020.100040. [DOI] [PMC free article] [PubMed] [Google Scholar]
- 4.Wang K., Long Q.X., Deng H.J., Hu J., Gao Q.-Z., Zhang G.-J., He C.-L., Huang L.-Y., Hu J.-L., Chen J., et al. Longitudinal Dynamics of the Neutralizing Antibody Response to SARS-CoV-2 Infection. Clin. Infect. Dis. 2020:ciaa1143. doi: 10.1093/cid/ciaa1143. [DOI] [PMC free article] [PubMed] [Google Scholar]
- 5.Long Q.X., Tang X.J., Shi Q.L., Li Q., Deng H.J., Yuan J., Hu J.L., Xu W., Zhang Y., Lv F.J., et al. Clinical and immunological assessment of asymptomatic SARS-CoV-2 infections. Nat. Med. 2020;26:1200–1204. doi: 10.1038/s41591-020-0965-6. [DOI] [PubMed] [Google Scholar]
- 6.Wang X., Guo X., Xin Q., Pan Y., Hu Y., Li J., Chu Y., Feng Y., Wang Q. Neutralizing Antibody Responses to Severe Acute Respiratory Syndrome Coronavirus 2 in Coronavirus Disease 2019 Inpatients and Convalescent Patients. Clin. Infect. Dis. 2020;71:2688–2694. doi: 10.1093/cid/ciaa721. [DOI] [PMC free article] [PubMed] [Google Scholar]
- 7.Ibarrondo F.J., Fulcher J.A., Goodman-Meza D., Elliott J., Hofmann C., Hausner M.A., Ferbas K.G., Tobin N.H., Aldrovandi G.M., Yang O.O. Rapid Decay of Anti-SARS-CoV-2 Antibodies in Persons with Mild Covid-19. N. Engl. J. Med. 2020;383:1085–1087. doi: 10.1056/NEJMc2025179. [DOI] [PMC free article] [PubMed] [Google Scholar]
- 8.Wajnberg A., Amanat F., Firpo A., Altman D.R., Bailey M.J., Mansour M., McMahon M., Meade P., Mendu D.R., Muellers K., et al. Robust neutralizing antibodies to SARS-CoV-2 infection persist for months. Science. 2020;370:1227–1230. doi: 10.1126/science.abd7728. [DOI] [PMC free article] [PubMed] [Google Scholar]
- 9.Dan J.M., Mateus J., Kato Y., Hastie K.M., Yu E.D., Faliti C.E., Grifoni A., Ramirez S.I., Haupt S., Frazier A., et al. Immunological memory to SARS-CoV-2 assessed for up to 8 months after infection. Science. 2021 doi: 10.1126/science.abf4063. Published online January 6, 2021. [DOI] [PMC free article] [PubMed] [Google Scholar]
- 10.Gaebler C., Wang Z., Lorenzi J.C.C., Muecksch F., Finkin S., Tokuyama M., Cho A., Jankovic M., Schaefer-Babajew D., Oliveira T.Y., et al. Evolution of Antibody Immunity to SARS-CoV-2. Nature. 2021 doi: 10.1038/s41586-021-03207-w. Published online January 4, 2021. [DOI] [PMC free article] [PubMed] [Google Scholar]
- 11.Wheatley A.K., Juno J.A., Wang J.J., Selva K.J., Reynaldi A., Tan H.-X., Lee W.S., Wragg K.M., Kelly H.G., Esterbauer R., et al. Evolution of immunity to SARS-CoV-2. medRxiv. 2020 https://www.medrxiv.org/content/10.1101/2020.09.09.20191205v2 2020.09.09.20191205. [Google Scholar]
- 12.Pastor-Barriuso R., Pérez-Gómez B., Hernán M.A., Pérez-Olmeda M., Yotti R., Oteo-Iglesias J., Sanmartín J.L., León-Gómez I., Fernández-García A., Fernández-Navarro P., et al. ENE-COVID Study Group Infection fatality risk for SARS-CoV-2 in community dwelling population of Spain: nationwide seroepidemiological study. BMJ. 2020;371:m4509. doi: 10.1136/bmj.m4509. [DOI] [PMC free article] [PubMed] [Google Scholar]
- 13.Trinité B., Tarrés-Fraixas F., Rodon J., Pradenas E., Urrea V., Marfil S., Rodriguez de la Concepción M.L., Avila-Nieto C., Aguilar-Gurrieri C., Barajas A., et al. SARS-CoV-2 infection elicits a rapid neutralizing antibody response that correlates with disease severity. Sci. Rep. 2021;11:2608. doi: 10.1038/s41598-021-81862-9. [DOI] [PMC free article] [PubMed] [Google Scholar]
- 14.Grzelak L., Velay A., Madec Y., Gallais F., Staropoli I., Schmidt-Mutter C., Wendling M.-J., Meyer N., Planchais C., Rey D., et al. Sex differences in the decline of neutralizing antibodies to SARS-CoV-2. medRxiv. 2020 doi: 10.1093/infdis/jiab127. https://www.medrxiv.org/content/10.1101/2020.11.12.20230466v1 2020.11.12.20230466. [DOI] [PMC free article] [PubMed] [Google Scholar]
- 15.Addetia A., Crawford K.H.D., Dingens A., Zhu H., Roychoudhury P., Huang M.L., Jerome K.R., Bloom J.D., Greninger A.L. Neutralizing Antibodies Correlate with Protection from SARS-CoV-2 in Humans during a Fishery Vessel Outbreak with a High Attack Rate. J. Clin. Microbiol. 2020;58:1–11. doi: 10.1128/JCM.02107-20. [DOI] [PMC free article] [PubMed] [Google Scholar]
- 16.Brouwer P.J.M., Caniels T.G., van der Straten K., Snitselaar J.L., Aldon Y., Bangaru S., Torres J.L., Okba N.M.A., Claireaux M., Kerster G., et al. Potent neutralizing antibodies from COVID-19 patients define multiple targets of vulnerability. Science. 2020;369:643–650. doi: 10.1126/science.abc5902. [DOI] [PMC free article] [PubMed] [Google Scholar]
- 17.Ng K.W., Faulkner N., Cornish G.H., Rosa A., Harvey R., Hussain S., Ulferts R., Earl C., Wrobel A.G., Benton D.J., et al. Preexisting and de novo humoral immunity to SARS-CoV-2 in humans. Science. 2020;370:1339–1343. doi: 10.1126/science.abe1107. [DOI] [PMC free article] [PubMed] [Google Scholar]
- 18.Wu L.P., Wang N.C., Chang Y.H., Tian X.Y., Na D.Y., Zhang L.Y., Zheng L., Lan T., Wang L.F., Liang G.D. Duration of antibody responses after severe acute respiratory syndrome. Emerg. Infect. Dis. 2007;13:1562–1564. doi: 10.3201/eid1310.070576. [DOI] [PMC free article] [PubMed] [Google Scholar]
- 19.Callow K.A., Parry H.F., Sergeant M., Tyrrell D.A.J. The time course of the immune response to experimental coronavirus infection of man. Epidemiol. Infect. 1990;105:435–446. doi: 10.1017/s0950268800048019. [DOI] [PMC free article] [PubMed] [Google Scholar]
- 20.Cohen J. How long do vaccines last? The surprising answers may help protect people longer. 2019. https://www.sciencemag.org/news/2019/04/how-long-do-vaccines-last-surprising-answers-may-help-protect-people-longer
- 21.Sánchez-Palomino S., Massanella M., Carrillo J., García A., García F., González N., Merino A., Alcamí J., Bofill M., Yuste E., et al. A cell-to-cell HIV transfer assay identifies humoral responses with broad neutralization activity. Vaccine. 2011;29:5250–5259. doi: 10.1016/j.vaccine.2011.05.016. [DOI] [PubMed] [Google Scholar]
- 22.WHO Working Group on the Clinical Characterisation and Management of COVID-19 Infection A minimal common outcome measure set for COVID-19 clinical research. Lancet Infect. Dis. 2020;20:e192–e197. doi: 10.1016/S1473-3099(20)30483-7. [DOI] [PMC free article] [PubMed] [Google Scholar]
- 23.Connor R.I., Chen B.K., Choe S., Landau N.R. Vpr is required for efficient replication of human immunodeficiency virus type-1 in mononuclear phagocytes. Virology. 1995;206:935–944. doi: 10.1006/viro.1995.1016. [DOI] [PubMed] [Google Scholar]
- 24.Ou X., Liu Y., Lei X., Li P., Mi D., Ren L., Guo L., Guo R., Chen T., Hu J., et al. Characterization of spike glycoprotein of SARS-CoV-2 on virus entry and its immune cross-reactivity with SARS-CoV. Nat. Commun. 2020;11:1620. doi: 10.1038/s41467-020-15562-9. [DOI] [PMC free article] [PubMed] [Google Scholar]
Associated Data
This section collects any data citations, data availability statements, or supplementary materials included in this article.
Supplementary Materials
Data Availability Statement
This study did not generate any unique datasets or code.