Abstract
The aim of this study was to explore colorectal tumor-associated macrophage (TAM) biomarkers for early diagnosis and surveillance of colorectal cancer (CRC). We used bioinformatic methods to screen array expression data of CRC-related macrophages (GEO: GSE29214) to detect the differentially expressed genes (DEGs) between CRC-related macrophages and normal control cells. We found 431 DEGs in TAMs compared with the control group; 399 were up-regulated and 32 were down-regulated. A functional enrichment analysis showed that the DEGs were involved in positive regulation of the ERK1 and ERK2 cascade, cell activation involved in the immune response, cytokine-mediated signaling pathway, and receptor activity, all of which were significantly enriched. We constructed a protein-protein interaction (PPI) network to identify hub genes. We identified 10 hub genes: ITGB2, ITGAM, C3AR1, PTAFR, C3, CYBB, FCER1G, PLAU, STOM, and GPR84, in the PPI network. We verified the results using array expression data of peripheral blood mononuclear cells (GEO: GSE47756). The results showed that the expression trends of CYBB, PLAU, and STOM were consistent with those found in the GSE29214 dataset. Further verification with The Cancer Genome Atlas and Human Protein Atlas showed that the high expression of PLAU in TAMs was statistically significant (P<0.05). We concluded that PLAU may be a biomarker of CRC-associated macrophages and may have prognostic and predictive significance for clinical utility in CRC management.
Keywords: Colorectal cancer, macrophages, bioinformatics, biomarker, gene expression omnibus database
Introduction
Colorectal cancer (CRC), the most common gastrointestinal tumor, is the fourth most deadly carcinoma with almost 900,000 deaths annually [1]. Although the mortality and incidence of CRC have tended to decrease in countries that have nationwide screening colonoscopy programs for CRC, the rates are still rising in most other countries, especially the more wealthy countries. In addition, there has been a worrying increase in patients younger than 50 years presenting with CRC, especially left-sided CRC [1-3]. Therefore, novel biomarkers that enable precise diagnosis and treatment of CRC are urgently needed.
Although the molecular mechanism of CRC has been widely explored, the exact pathogenesis of CRC remains elusive [4]. The tumor microenvironment was found to play important roles in tumor treatment responses [5]. Immunotherapy-targeted tumor microenvironment approaches have shown some effective results in a select group of CRCs [6]. Tumor-associated macrophages (TAMs), recruited from the peripheral blood or yolk sac, are among the most abundant immune cells in the tumor microenvironment. Macrophages, mainly the M1 and M2 subtypes, can either enhance antitumor response or induce tumor progression, metastasis, and resistance to therapy [7]. TAMs have been used as target cells for CRC treatment. In addition, the diagnostic performance of many biomarkers for early-stage CRC screening, for prognostication, or for predicting response to therapy needs to be improved, and most of them need further validation in large independent patient cohorts [8]. Therefore, the use of TAM biomarkers for diagnosis, prognostication, and prediction of treatment response needs to be explored further.
Due to the interindividual timing, location, and proteins functional heterogeneity of TAMs, in this study, we focused on TAM genes to detect new biomarkers and therapeutic targets for CRC. We used the array expression data of macrophages in patients with CRC and bioinformatic methods to detect differentially expressed genes (DEGs) and explore possible pathogenic mechanisms. We verified the DEGs and hub genes using the array expression data of the main origin cells of colorectal TAM (peripheral blood mononuclear cell), as well as the Human Protein Atlas (HPA), and The Cancer Genome Atlas (TCGA) databases.
Materials and methods
Acquisition of gene chip datasets
We obtained the array expression data from the Gene Expression Omnibus (GEO) (https://www.ncbi.nlm.nih.gov/geo/). We used ‘colorectal neoplasms’ as the search term and obtained 36462 search results from GEO. After careful manual inspection of the search results, we selected two microarray datasets, GSE29214 and GSE47756, for analysis [9,10]. These datasets were obtained using the Illumina humanRef-8 v2.0 expression beadchip (GPL6104) and the Illumina HumanHT-12 V4.0 expression beadchip (GPL10558) platforms. The GSE29214 dataset contains data for human colorectal tumor spheroids (n=2, control group) and co-culture spheroids of tumor cells and macrophages (n=4, experimental group). The GSE29214 dataset contains data for human peripheral blood monocytes of healthy volunteers (n=38, control group) and non-metastatic colorectal cancer peripheral blood monocytes (n=27, experimental group). Because we used publicly available datasets in this study, no ethical issues are involved.
Screening for DEGs
We identified the DEGs between the CRC-related macrophage and CRC groups in GSE29214 using GEO2R (https://www.ncbi.nlm.nih.gov/geo/geo2r/). The screening criteria were adjusted P-value <0.05 and |logFC| ≥1, where the P-value was calculated by the two-tailed t-test and corrected using the Benjamini-Hochberg method and |logFC| is the absolute value of the logarithm of fold change. SangerBox (http://sangerbox.com/) was used to generate a volcano plot of the DEGs. The parameters were set as follows: abscissa, log2 (FC); ordinate, -log10 (P-value); and cutoff P-value, 0.05. The red, green, and gray dots indicate up-regulated, down-regulated, and non-significant genes, respectively.
Enrichment analysis
To identify biologic processes associated with CRC, we performed a functional enrichment analysis of the DEGs using Metascape (https://metascape.org/gp/#/main/step1) and the Database for Annotation, Visualization and Integrated Discovery (DAVID v.6.8, https://david.ncifcrf.gov/) with the Gene Ontology (GO), KEGG Pathway, Canonical Pathways, Reactome Gene Sets, and CORUM databases. Species was limited to Homo sapiens. P-values <0.01 and counts ≥3 were considered to be statistically significant in Metascape [11]. False discovery rate <0.01 and gene counts ≥20 were considered statistically significant in DAVID [12]. The data analysis and visualization tool (http://www.bioinformatics.com.cn/) was used to visualize the results and generate a bubble chart.
Protein-protein interaction (PPI) network analysis
We used the STRING v11.0 database (https://string-db.org/) for the PPI network analysis of the DEGs. The minimum effective binding score was set as 0.4. The PPI network analysis results were imported into Cytoscape v3.6.0 software for further topological analysis [13]. The cytoHubba plugin of Cytoscape was used to analyze the connection weights of the PPI network to identify the top 10 hub genes [14].
Validation of hub genes
The top 10 identified hub genes were validated using the array expression data of monocyte genes in peripheral blood cells of CRC patients (GSE47756). GraphPad Prism v5.0 was used for statistical analysis with the unpaired t test; P-values <0.05 were considered significant. The statistically significant hub genes were validated using UALCAN (http://ualcan.path.uab.edu/index.html) and HPA (https://www.proteinatlas.org/) [15,16].
Results
Identified DEGs
We detected 431 DEGs between the experimental and control groups in the GSE29214 dataset; 399 were up-regulated and 32 were down-regulated (Figure 1).
Figure 1.
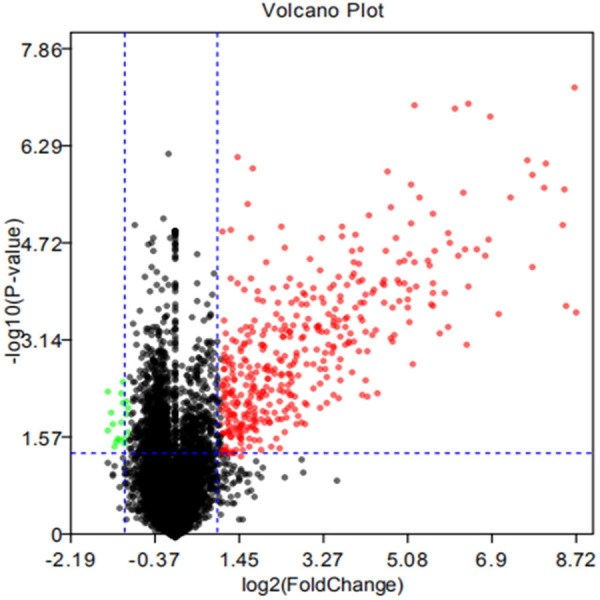
Volcano plot of GSE29214. The cutoff P value is 0.05, and logFC is-1/1. Red dots: up-regulated genes; green dots: down-regulated genes; gray dots: non-statistically significant genes.
Functional clustering
The GO enrichment analysis of the DEGs was performed using DAVID. GO terms were assigned under the three main categories: biologic process, cellular component, and molecular function. Under biologic process, the main enriched terms were signal transduction, immune response, inflammatory response, innate immune response, regulation of immune response, chemotaxis, positive regulation of ERK1 and ERK2 cascade, cell-cell signaling, cellular response to lipopolysaccharide, and leukocyte migration. Under cellular component, the main enriched terms were plasma membrane, integral component of membrane, extracellular exosome, integral component of plasma membrane, extracellular region, extracellular space, cell surface, external side of plasma membrane, lysosome, and lysosomal membrane. Under molecular function, the main enriched term was receptor activity. The GO and KEGG pathway analyses using Metascape and the data analysis and visualization tool showed that the DEGs were enriched mainly in leukocyte activation involved in immune response, regulated exocytosis, myeloid cell activation involved in immune response, granulocyte activation, cytokine-mediated signaling pathway, and immune response-regulating signaling pathway (Figure 2).
Figure 2.
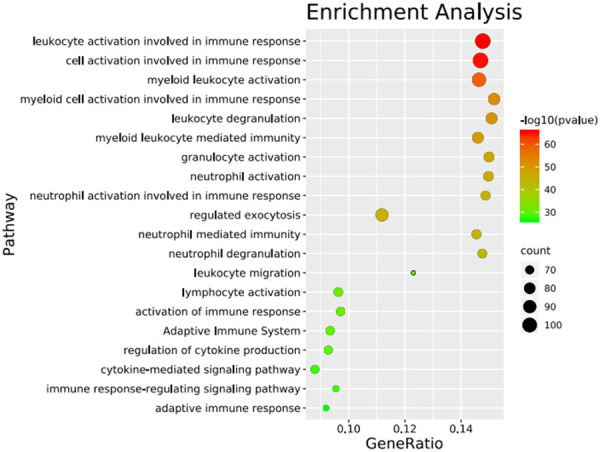
Bubble chart of enrichment analysis for differential genes in GSE29214.
Results of PPI network analysis and hub genes
All the DEGs were submitted to STRING database for analysis, and the results were imported into Cytoscape to construct the PPI network (Figure 3). The topology of the PPI network was calculated based on the degree algorithm of the cytoHubba plugin. The network connection weight identified the top 10 hub genes as ITGB2, ITGAM, C3AR1, PTAFR, C3, CYBB, FCER1G, PLAU, STOM, and GPR84, all of which were up-regulated (Figure 4).
Figure 3.
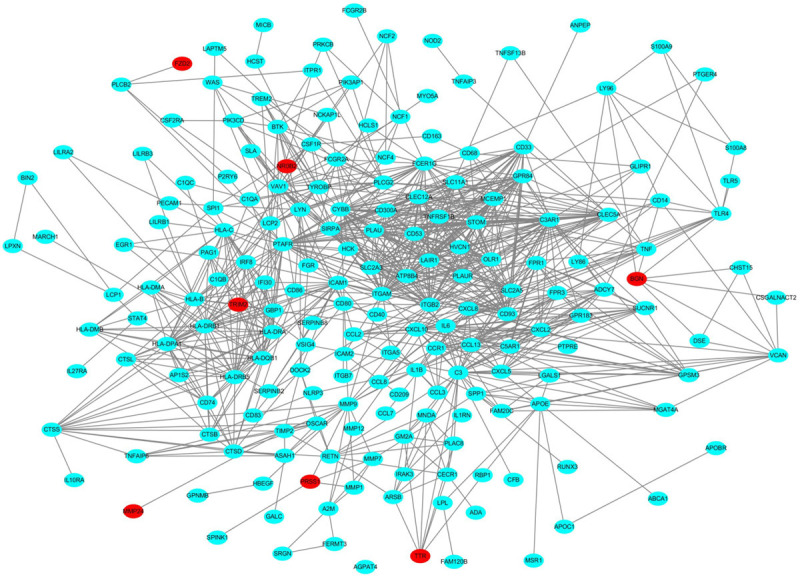
PPI network constructed with DEGs. Note: red nodes indicate down-regulated genes, and blue nodes indicate up-regulated genes.
Figure 4.
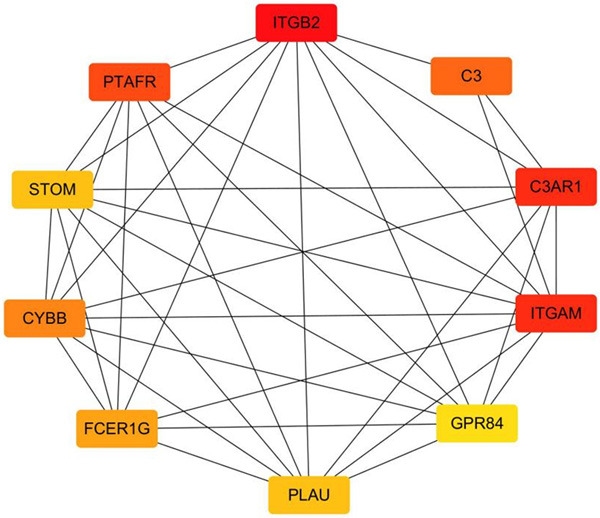
The interaction network of hub genes. The color of the hub gene nodes change from yellow to red, representing a score from low to high.
Validation of the hub genes
The expression levels of the top 10 hub genes were validated using the array expression data in GSE47756. We found that the differences in the expression levels of ITGAM, CYBB, PLAU, C3, and STOM between CRC cells and healthy human peripheral blood mononuclear cells were statistically significant (Figure 5); the expression levels of the other five genes were not different between the groups. In addition, CYBB, PLAU, and STOM were up-regulated in GSE47756, which is consistent with their expression in GSE29214 (Table 1). We analyzed the expression and survival analysis of these three hub genes in TCGA using UALCAN. We found that the expression of PLAU in the colon adenocarcinoma and rectal adenocarcinoma datasets was different between the adenocarcinoma group and normal group (Figure 6, P<0.05) and there was no difference in survival analysis between the adenocarcinoma group and normal group (P>0.05). The expression of CYBB and STOM, which were down-regulated in the adenocarcinoma tissues, was different between the adenocarcinoma group and normal group (P<0.05) and there was no difference in survival analysis between the adenocarcinoma group and normal group (P>0.05). Immunohistochemistry staining based on HPA showed the expression of PLAU was higher in the CRC tissue than in the normal tissue (Figure 7); however, there was no difference in the expression of CYBB and STOM between the CRC and normal tissues.
Figure 5.
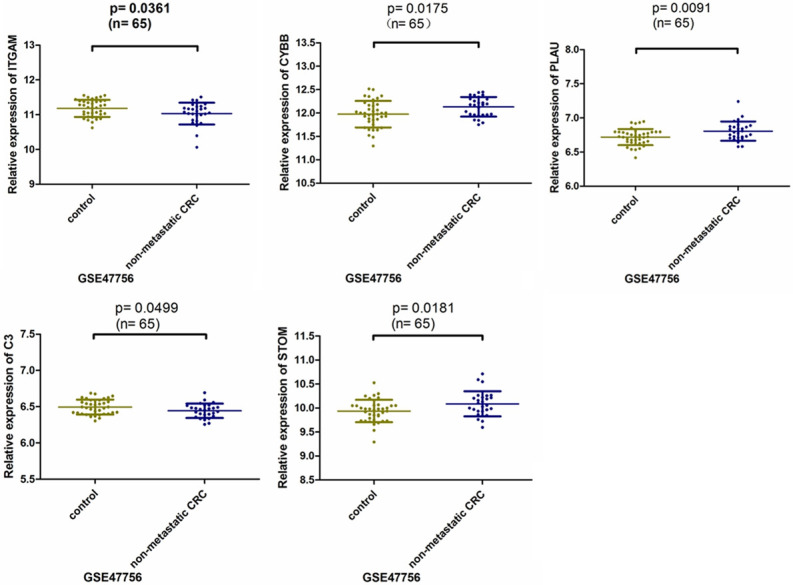
Relative expression of hub genes in GSE47756 dataset. P<0.05.
Table 1.
Top ten hub genes with higher scores
| Gene symbol | Score | Regulation in GSE29214 | Regulation in GSE47756 | Description |
|---|---|---|---|---|
| ITGB2 | 37 | up | down | integrin subunit beta 2 |
| ITGAM | 36 | up | down | integrin subunit alpha M |
| C3AR1 | 36 | up | up | complement C3a receptor 1 |
| PTAFR | 34 | up | up | platelet activating factor receptor |
| C3 | 32 | up | down | complement C3 |
| CYBB | 30 | up | up | cytochrome b-245 beta chain |
| FCER1G | 29 | up | down | Fc fragment of IgE receptor Ig |
| PLAU | 28 | up | up | plasminogen activator, urokinase |
| STOM | 28 | up | up | stomatin |
| GPR84 | 27 | up | up | G protein-coupled receptor 84 |
Figure 6.
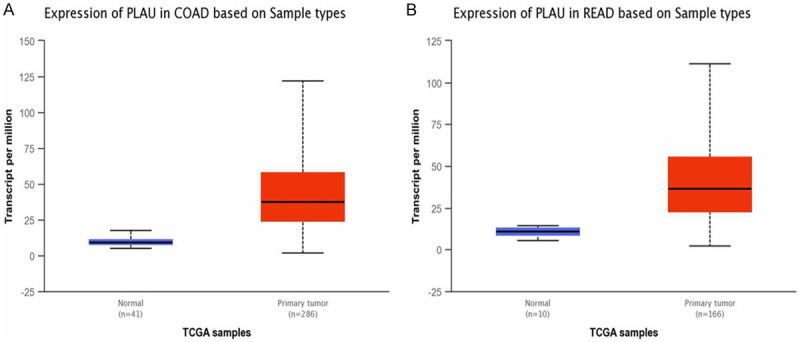
A. Expression of PLAU in colonic adenocarcinoma patients (colon adenocarcinoma group vs. normal group, P<0.05). B. Expression of PLAU in rectal adenocarcinoma patients (rectal adenocarcinoma group vs. normal group, P<0.05).
Figure 7.
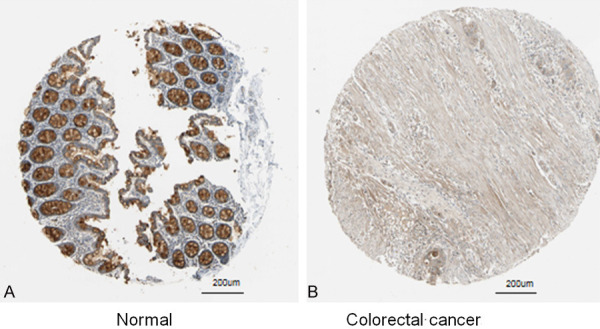
Immunohistochemistry of PLAU based on the Human Protein Atlas (×200). A. Protein levels of PLAU in normal tissue (Staining: Medium; Intensity: Moderate; Quantity:75%-25%; Location: Cytoplasmic/membranous). B. Protein levels of PLAU in Colorectal cancer tissue (Staining: Low; Intensity: Weak; Quantity: >75%; Location: Cytoplasmic/membranous).
Discussion
Early diagnosis can improve the prognosis and quality of life for patients with CRC. However, there is a lack of specific, sensitive, and non-invasive biomarkers for the diagnosis and treatment of CRC. Using bioinformatic methods to analyze a GEO dataset, we identified PLAU as a hub gene in TAMs. We verified the DEGs and related enrichment analysis results using a different GEO dataset and publicly available databases, which will provide a valuable basis for future studies of CRC pathogenesis and immunotherapy.
Previous studies have found that PLAU (also known as u-PA (urokinase plasminogen activator)), was involved in tumor cell invasion, migration, and metastasis, and that PLAU was more highly expressed in CRC groups than in normal groups [17,18]. Increased PLAU levels in serum and tumors were associated with cancer progression and poor prognosis in patients with CRC. However, the biologic role and source of PLAU and its underlying mechanisms in CRC remain uncertain [17]. Consistent with previous studies, we found that PLAU was a hub gene of TAMs and was up-regulated in CRC. Together, these results suggest that the high expression of PLAU in the tumor microenvironment may play an important role in the differentiation of macrophages and the progression of CRC cells. PLAU may be a biomarker for the prognosis of CRC patients and a target for new cancer therapeutics [18].
The enrichment analysis of DEGs showed that the dysregulated genes of TAMs in CRC were enriched in positive regulation of the ERK1 and ERK2 cascade, cell activation involved in immune response, cytokine-mediated signaling pathway, and receptor activity. PLAU was significantly enriched in signaling pathways such as ERK and immune response, and the up-regulation of PLAU was closely related to the invasion and metastasis of CRC through the ERK or t-PA receptor pathway. In a previous study, we found that the Wnt5a/CaMKII/ERK axis, which was localized mainly in TAMs of tumor stroma, especially M2-like TAMs, was required for TAMs to promote CRC progression [19]. In addition, the urokinase-type plasminogen activator receptor (uPAR), which had a high uPAR score on TAMs, was found to be a marker of poor prognosis in CRC [20]. These results are similar to our DEGs enrichment results, further verifying that ERK and uPAR are closely related to the pathogenesis of CRC.
The present study provides new evidence that PLAU may serve as a novel predictive biomarker in CRC invasion and metastasis for early diagnosis and to predict the prognosis of CRC. To avoid interference cased by the heterogeneity of TAMs and the interaction between the CRC microenvironment and macrophages, we used peripheral blood monocytes to verify the identified hub genes and potential pathways. Our results showed that abnormal genes expressed in TAMs may be involved in ERK and t-PA receptor pathways through a complex PPI regulatory network to regulate the progress of CRC. Therefore, PLAU may provide prognosis and predictive value for clinical utility in CRC management, as it does in breast cancer [21].
This study has some limitations. There may be differences in gene expression between in vitro TAMs and the peripheral blood mononuclear-macrophage system in CRC, and the heterogeneity of TAMs, such as TAMs from different treatment times, intratumor locations, macrophage origin, and macrophage polarization, may affect the results. However, our results show that PLAU may be used as a potential biomarker for early detection of CRC, for predicting the progression and prognosis of CRC, and providing evidence for exploring the molecular mechanisms of CRC. In future studies, single-cell tracking technology should be used to determine the relationship between blood mononuclear cells and TAMs and to reprogram TAMs, and a rigorous experimental design should be adopted to mine and evaluate TAM abnormal genes in CRC for precise diagnosis and immunotherapy.
Acknowledgements
This work was fnanically supported by Doctor Foundation of Guizhou Provincial People’s Hospital [NO. GZSYBS(2017)09], Beijing Medical and Health Foundation [NO. YWJKJJHKYJJ-B184053] and Cultivation Fund of National Natural Science Foundation (Grant No. qiankehe2018-5764-11).
Disclosure of conflict of interest
None.
References
- 1.Dekker E, Tanis PJ, Vleugels JLA, Kasi PM, Wallace MB. Colorectal cancer. Lancet. 2019;394:1467–1480. doi: 10.1016/S0140-6736(19)32319-0. [DOI] [PubMed] [Google Scholar]
- 2.Hofseth LJ, Hebert JR, Chanda A, Chen H, Love BL, Pena MM, Murphy EA, Sajish M, Sheth A, Buckhaults PJ, Berger FG. Early-onset colorectal cancer: initial clues and current views. Nat Rev Gastroenterol Hepatol. 2020;17:352–364. doi: 10.1038/s41575-019-0253-4. [DOI] [PMC free article] [PubMed] [Google Scholar]
- 3.Kasi PM, Shahjehan F, Cochuyt JJ, Li Z, Colibaseanu DT, Merchea A. Rising proportion of young individuals with rectal and colon cancer. Clin Colorectal Cancer. 2019;18:e87–e95. doi: 10.1016/j.clcc.2018.10.002. [DOI] [PubMed] [Google Scholar]
- 4.Wang J, Sahengbieke S, Xu X, Zhang L, Xu X, Sun L, Deng Q, Wang D, Chen D, Pan Y, Liu Z, Yu S. Gene expression analyses identify a relationship between stanniocalcin 2 and the malignant behavior of colorectal cancer. Onco Targets Ther. 2018;11:7155–7168. doi: 10.2147/OTT.S167780. [DOI] [PMC free article] [PubMed] [Google Scholar]
- 5.Shen M, Kang Y. Complex interplay between tumor microenvironment and cancer therapy. Front Med. 2018;12:426–439. doi: 10.1007/s11684-018-0663-7. [DOI] [PubMed] [Google Scholar]
- 6.Tintelnot J, Stein A. Immunotherapy in colorectal cancer: available clinical evidence, challenges and novel approaches. World J Gastroenterol. 2019;25:3920–3928. doi: 10.3748/wjg.v25.i29.3920. [DOI] [PMC free article] [PubMed] [Google Scholar]
- 7.Lopez-Yrigoyen M, Cassetta L, Pollard JW. Macrophage targeting in cancer. Ann N Y Acad Sci. 2020:1–24. doi: 10.1111/nyas.14377. [DOI] [PubMed] [Google Scholar]
- 8.Jung G, Hernández-Illán E, Moreira L, Balaguer F, Goel A. Epigenetics of colorectal cancer: biomarker and therapeutic potential. Nat Rev Gastroenterol Hepatol. 2020;17:111–130. doi: 10.1038/s41575-019-0230-y. [DOI] [PMC free article] [PubMed] [Google Scholar]
- 9.Ong SM, Tan YC, Beretta O, Jiang D, Yeap WH, Tai JJ, Wong WC, Yang H, Schwarz H, Lim KH, Koh PK, Ling KL, Wong SC. Macrophages in human colorectal cancer are pro-inflammatory and prime T cells towards an anti-tumour type-1 inflammatory response. Eur J Immunol. 2012;42:89–100. doi: 10.1002/eji.201141825. [DOI] [PubMed] [Google Scholar]
- 10.Hamm A, Prenen H, Van Delm W, Di Matteo M, Wenes M, Delamarre E, Schmidt T, Weitz J, Sarmiento R, Dezi A, Gasparini G, Rothé F, Schmitz R, D’Hoore A, Iserentant H, Hendlisz A, Mazzone M. Tumour-educated circulating monocytes are powerful candidate biomarkers for diagnosis and disease follow-up of colorectal cancer. Gut. 2016;65:990–1000. doi: 10.1136/gutjnl-2014-308988. [DOI] [PubMed] [Google Scholar]
- 11.Zhou Y, Zhou B, Pache L, Chang M, Khodabakhshi AH, Tanaseichuk O, Benner C, Chanda SK. Metascape provides a biologist-oriented resource for the analysis of systems-level datasets. Nat Commun. 2019;10:1523. doi: 10.1038/s41467-019-09234-6. [DOI] [PMC free article] [PubMed] [Google Scholar]
- 12.Huang da W, Sherman BT, Lempicki RA. Systematic and integrative analysis of large gene lists using DAVID bioinformatics resources. Nat Protoc. 2009;4:44–57. doi: 10.1038/nprot.2008.211. [DOI] [PubMed] [Google Scholar]
- 13.Shannon P, Markiel A, Ozier O, Baliga NS, Wang JT, Ramage D, Amin N, Schwikowski B, Ideker T. Cytoscape: a software environment for integrated models of Biomolecular interaction networks. Genome Res. 2003;13:2498–2504. doi: 10.1101/gr.1239303. [DOI] [PMC free article] [PubMed] [Google Scholar]
- 14.Chin CH, Chen SH, Wu HH, Ho CW, Ko MT, Lin CY. cytoHubba: identifying hub objects and sub-networks from complex interactome. BMC Syst Biol. 2014;8:S11. doi: 10.1186/1752-0509-8-S4-S11. [DOI] [PMC free article] [PubMed] [Google Scholar]
- 15.Chandrashekar DS, Bashel B, Balasubramanya SAH, Creighton CJ, Ponce-Rodriguez I, Chakravarthi BVSK, Varambally S. UALCAN: a portal for facilitating tumor subgroup gene expression and survival analyses. Neoplasia. 2017;19:649–658. doi: 10.1016/j.neo.2017.05.002. [DOI] [PMC free article] [PubMed] [Google Scholar]
- 16.Uhlén M, Fagerberg L, Hallström BM, Lindskog C, Oksvold P, Mardinoglu A, Sivertsson Å, Kampf C, Sjöstedt E, Asplund A, Olsson I, Edlund K, Lundberg E, Navani S, Szigyarto CA, Odeberg J, Djureinovic D, Takanen JO, Hober S, Alm T, Edqvist PH, Berling H, Tegel H, Mulder J, Rockberg J, Nilsson P, Schwenk JM, Hamsten M, von Feilitzen K, Forsberg M, Persson L, Johansson F, Zwahlen M, von Heijne G, Nielsen J, Pontén F. Proteomics. Tissue-based map of the human proteome. Science. 2015;347:1260419. doi: 10.1126/science.1260419. [DOI] [PubMed] [Google Scholar]
- 17.Lin M, Zhang Z, Gao M, Yu H, Sheng H, Huang J. MicroRNA-193a-3p suppresses the colorectal cancer cell proliferation and progression through downregulating the PLAU expression. Cancer Manag Res. 2019;11:5353–5363. doi: 10.2147/CMAR.S208233. [DOI] [PMC free article] [PubMed] [Google Scholar]
- 18.Huang SF, Chu SC, Hsu LS, Tu YC, Chen PN, Hsieh YS. Antimetastatic effects of gossypol on colon cancer cells by targeting the u-PA and FAK pathways. Food Funct. 2019;10:8172–8181. doi: 10.1039/c9fo01306g. [DOI] [PubMed] [Google Scholar]
- 19.Liu Q, Song J, Pan Y, Shi D, Yang C, Wang S, Xiong B. Wnt5a/CaMKII/ERK/CCL2 axis is required for tumor-associated macrophages to promote colorectal cancer progression. Int J Biol Sci. 2020;16:1023–1034. doi: 10.7150/ijbs.40535. [DOI] [PMC free article] [PubMed] [Google Scholar]
- 20.Illemann M, Laerum OD, Hasselby JP, Thurison T, Høyer-Hansen G, Nielsen HJ Danish Study Group on Early Detection of Colorectal Cancer. Christensen IJ. Urokinase-type plasminogen activator receptor (uPAR) on tumor-associated macrophages is a marker of poor prognosis in colorectal cancer. Cancer Med. 2014;3:855–864. doi: 10.1002/cam4.242. [DOI] [PMC free article] [PubMed] [Google Scholar]
- 21.Bellocq JP, Luporsi E, Barrière J, Bonastre J, Chetritt J, Le Corroller AG, de Crémoux P, Fina F, Gauchez AS, Kassab-Chahmi D, Lamy PJ, Martin PM, Mazouni C, Peyrat JP, Romieu G, Verdoni L, Mazeau-Woynar V. uPA/PAI-1, Oncotype DX™, MammaPrint(®). Prognosis and predictive values for clinical utility in breast cancer management. Ann Pathol. 2014;34:349–351. doi: 10.1016/j.annpat.2014.04.010. [DOI] [PubMed] [Google Scholar]


