

Abstract
Nowadays, the current bioinformatic methods have been increasingly applied in the field of oncological research. In this study, we expect a better understanding of the molecular mechanism of gastric cancer from the bioinformatic methods. By systematically addressing the differential expression of microRNAs (miRNAs) and mRNAs between gastric cancer specimens and normal gastric specimens with the application of bioinformatics tools, A total of 206 DEGs and 38 DEMs were identified. The Gene Ontology (GO) analysis of Annotation, Visualization and Integrated Discovery (DAVID) database revealed that the differentially expressed genes (DEGs) were significantly enriched in biological process, molecular function and cellular component, while Kyoto Encyclopedia of Genes and Genomes (KEGG) database showed DEGs were significantly enriched in 8 signal pathways. The miRNA-gene regulatory network was constructed based on 385 miRNA-gene (DEM-DEG) pairs, consisting of 35 miRNAs and 107 target genes. In the regulatory network, the top 5 up-regulated genes were Transmembrane Protease, Serine 11B (TMPRSS11B), regulator of G protein signaling 1 (RGS1), cysteine rich angiogenic inducer 61 (CYR61), inhibin subunit beta A (INHBA), syntrophin gamma 1 (SNTG1), and the top 5 down-regulated genes were tumor necrosis factor receptor superfamily, member 19 (TNFRSF19), pleckstrin homology domain containing B2 (PLEKHB2), Tax1 binding protein 3 (TAX1BP3), presenilin enhancer, gamma-secretase subunit (PSENEN), NME/NM23 nucleoside diphosphate kinase 3 (NME3). Based on the gastric cancer patient database from Kaplan-Meier Plotter tools, we found that 8 of 10 genes with most significant changes in the miRNA-gene regulatory network possessed a prognostic value for survival time of gastric cancer patients. Patients with higher level of RGS1, PLEKHB2, TAX1BP3 and PSENEN in gastric cancer had a longer survival time compared with the patients with lower level of these genes. On the contrary, patients with higher level of INHBA, SNTG1, TNFRSF19 and NME3 were found associated with a shorter survival time. In conclusion, our findings provided several potential targets regarding gastric cancer, which may result in a new strategy to treat gastric cancer from a system rather than a single-gene perspective.
Keywords: Gastric cancer, mRNA, miRNA, prognosis
Introduction
Gastric cancer is the fourth leading cause of cancer death worldwide, which has a high incidence in East Asia, South America, and Eastern Europe [1-4]. Although the high mortality of this malignant carcinoma has been more recognized, there still lacks effective detective tools and treatments for gastric cancer in the clinic. Currently, microarray-based approaches have been increasingly applied to identify miRNA and mRNA signatures, which promotes the development of cancer diagnosis and treatment [5-8]. We expected the genome-wide microRNAs (miRNAs) and mRNA expression profiling by microarray-based approaches providing a prospective way for gastric cancer detection and treatment.
For now, a mass of genes have been confirmed associated with the development and progression of gastric cancer, such as the mutation of phosphatase, tumor protein p53, vascular endothelial growth factor and so on [9-14]. miRNAs have gene regulatory functions, which could bind to the 3’-untranslated region of their target mRNA, so as to inhibit translation or induce mRNA degradation. Many miRNAs could affect biological behavior of gastric cancer in vivo. For example, miRNA-454 could inhibit the cell proliferation and invasion of gastric cancer cells by targeting mitogen-activated protein kinase; miRNA-28 promotes cell proliferation and invasion of gastric cancer via the phosphatase and tensin homolog (PTEN)/phosphatidylinositol-3-kinase (PI3K)/protein kinase B (AKT) signaling pathway; miRNA-216a inhibits the metastasis of gastric cancer cells by targeting Janus kinase2 (JAK2)/Signal Transducer and Activator of Transcription3 (STAT3)-mediated epithelial-mesenchymal transition process [15-17]. Therefore, it is of great importance to elucidate the role of the miRNA-gene regulatory network in development and progression of gastric cancer. However, to date, there are only a few reports regarding the comprehensive regulatory network of miRNA-gene in gastric cancer.
In this study, we analyzed the profiles of mRNAs and miRNAs by comparing gastric cancer specimens with the normal gastric specimens to reveal the regulatory network between miRNAs and mRNAs. Our data may provide important information helping elucidate the molecular mechanisms of gastric cancer and contribute to a new treatment for gastric cancer from a systematic perspective.
Materials and methods
Microarray data
The miRNA expression dataset GSE78091 [18] and mRNA expression dataset GSE33651 [19] were downloaded from National Center of Biotechnology Information (NCBI) Gene Expression Omnibus (GEO; http://www.ncbi.nlm.nih.gov/geo/) database [20]. The miRNA dataset GSE78091 contained 6 specimens, including 3 gastric cancer specimens and 3 adjacent normal gastric specimens. The miRNA expression profile was detected via the miRCURY LNA microRNA Array GPL21439 platform. The mRNA dataset GSE33651 contained 52 specimens, including 40 gastric cancer specimens and 12 normal gastric specimens. The microarray data we used was detected based on GPL2895 GE Healthcare/Amersham Biosciences CodeLink Human Whole Genome Bioarray platform.
Identification of differentially expressed miRNAs (DEMs) and genes (DEGs)
GEO2R (https://www.ncbi.nlm.nih.gov/geo/geo2r/) is an interactive online tool of GEO that permits users to compare two or more groups of samples in a GEO Series and it can analyze most GEO series with gene symbol [21]. For the miRNA dataset, DEMs between gastric cancer specimens and adjacent normal gastric specimens were identified via the GEO2R. The screening threshold was false discovery rate (FDR) corrected P<0.01 and |log2 (fold-change (FC))|>2. For the mRNA dataset, DEGs were also identified via the GEO2R. The DEGs were identified according to the criteria of FDR corrected P<0.01 and |log2FC|>2.
Gene ontology (GO) terms enrichment analysis
The Database for Annotation, Visualization and Integrated Discovery (DAVID) (https://david.ncifcrf.gov/) was a widely used web-based tool for genomic functional annotations [22]. In the present study, GO was performed for enrichment analysis on DEGs via DAVID [23]. A P<0.05 was considered as a significant change and the pie chart was drawn for all the changes with the most statistical significance.
Pathway enrichment analysis
Target pathways for DEGs were predicted by the Kyoto Encyclopedia of Genes and Genomes (KEGG) pathway enrichment analysis via DAVID [24]. All pathways showing P<0.05 were considered significantly enriched between the compared groups.
Screening of DEGs associated DEMs
The DEGs associated miRNAs, as well as the miRNA-gene pairs, were identified based on the analysis from miRWalk 3.0 platform (http://mirwalk.umm.uni-heidelberg.de/) [25].
Construction of the miRNA-gene regulatory network
The overlaps between the DEMs and the DEGs associated miRNAs were selected. The miRNA-gene regulatory network was constructed based on the DEM-DEG pairs and then visualized via Cytoscape software 3.4.0 (http://www.cytoscape.org) [26].
Gastric cancer data set analysis
Kaplan Meier-plotter (KM plotter, http://kmplot.com/analysis/) could assess the effect of 54,675 genes on survival using 10,461 cancer samples, including 5,143 breast, 1,816 ovarian, 2,437 lung and 1,065 gastric cancer patients with a mean follow-up of 69, 40, 49 and 33 months [27]. The mRNA data of 1,065 patients was utilized to verify our results from the GEO dataset. The DEGs, which were top 5 upregulated and top 5 downregulated in the miRNA-gene regulatory network, were selected to verify their correlation with survival time of gastric cancer patients. The hazard ratio (HR) with 95% confidence intervals and log rank P value were calculated. The log-rank P<0.05 was considered statistically significant.
Results
Differential expression of miRNAs and mRNAs in gastric cancer
In this study, we investigated the differentially expressed miRNA and mRNA expression profiles between gastric cancer specimens and normal gastric specimens based on GEO datasets, see Table 1. The study design was presented in Figure 1. In total, 38 miRNAs, with a threshold of P<0.01 and |log2FC|>2 were considered as significantly differentially expressed, all of which were up-regulated. The whole DEMs were listed in Table 2. A total of 206 mRNAs were identified as being differentially expressed between gastric cancer specimens and normal gastric specimen under the threshold of P<0.01 and |log2FC|>2, see Figure 2, including 155 up-regulated genes and 51 down-regulated genes, see top 20 up-regulated genes and top 20 down-regulated genes in Table 3.
Table 1.
Characteristics of mRNA and miRNA expression profiling of gastric cancer specimens with normal gastric specimens
Figure 1.
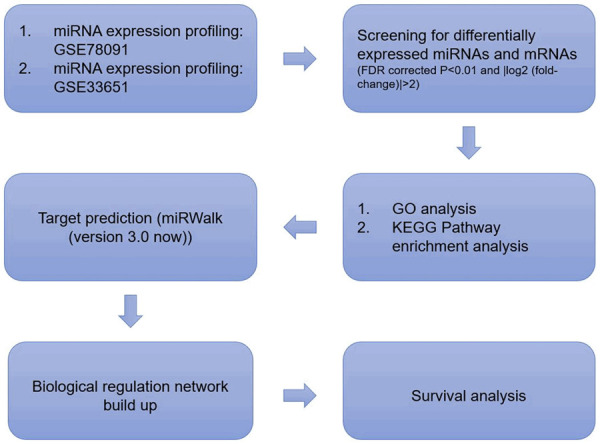
Workflow of the study design.
Table 2.
List of differentially regulated miRNAs in GSE78091
| Up-regulated | Up-regulated | ||||
|---|---|---|---|---|---|
|
|
|
||||
| miRNA_ID_LIST | logFC | adj. P. Val | miRNA_ID_LIST | logFC | adj. P. Val |
| kshv-miR-K12-3-3p | 2.054444 | 0.00967 | hsa-miR-3140-3p | 2.731037 | 0.00774 |
| hsa-miR-4801 | 2.092554 | 0.00755 | hsa-miR-5003-5p | 2.747225 | 0.00801 |
| hsa-miR-222-5p | 2.150165 | 0.00801 | hsa-miR-499a-3p | 2.761745 | 0.00582 |
| hsa-miR-548v | 2.181981 | 0.00774 | hsa-miR-3671 | 2.776101 | 0.00842 |
| hsa-miR-148b-5p | 2.185893 | 0.00801 | hsa-miR-4714-3p | 2.786759 | 0.00648 |
| hsa-miR-4517 | 2.235501 | 0.00934 | hsa-miR-4715-5p | 2.924227 | 0.0066 |
| hsa-miR-3664-3p | 2.302251 | 0.00801 | hsa-miR-494-3p | 3.04274 | 0.00801 |
| hsa-miR-93-3p | 2.373845 | 0.0076 | hsa-miR-3607-5p | 3.074306 | 0.00582 |
| hsa-miR-4699-5p | 2.467019 | 0.00663 | hsa-miR-214-5p | 3.07533 | 0.00755 |
| hsa-miR-5008-5p | 2.516168 | 0.00582 | hsa-miR-548au-3p | 3.179879 | 0.00648 |
| hsa-miR-342-3p | 2.578716 | 0.00728 | hsa-miR-5692b/hsa-miR-5692c | 3.300774 | 0.00582 |
| hsa-miR-3074-3p | 2.58266 | 0.00582 | hsa-miR-4774-5p | 3.421769 | 0.00582 |
| hsa-miR-3663-3p | 2.60645 | 0.00801 | hsa-miR-3910 | 3.57701 | 0.00582 |
| hsa-miR-4776-5p | 2.621787 | 0.00582 | ebv-miR-BHRF1-2-5p | 3.666725 | 0.00582 |
| hsa-miR-323b-3p | 2.621831 | 0.00774 | hsa-miR-5000-3p | 3.810626 | 0.00582 |
| hsa-miR-4691-5p | 2.628232 | 0.00671 | hsa-miR-4418 | 3.89057 | 0.00582 |
| hsa-miR-3132 | 2.668607 | 0.00648 | hsa-miR-187-5p | 4.026276 | 0.00801 |
| ebv-miR-BART22 | 2.699331 | 0.00801 | hsa-miR-5579-3p | 4.032345 | 0.00582 |
| hsa-miR-34c-3p | 2.721863 | 0.00582 | hsa-miR-4474-5p | 4.390643 | 0.00582 |
Note: FC: Fold change.
Figure 2.
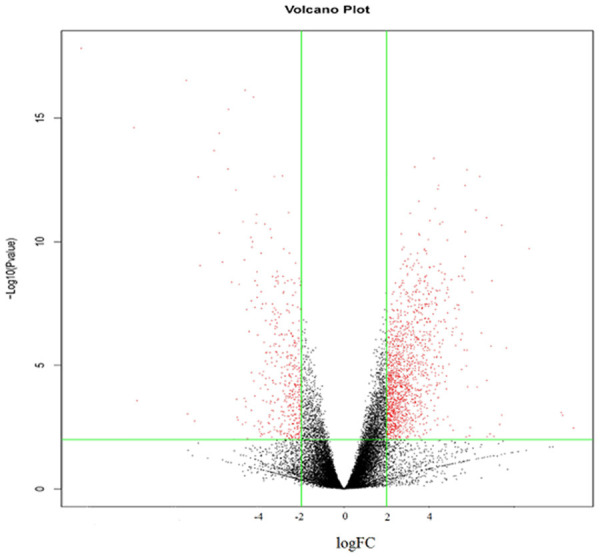
Differentially expressed genes (DEGs) between gastric cancer specimens and normal gastric specimen. Microarray data from GSE33651 were analyzed by GEO2R to screen the most significantly changed mRNAs between gastric cancer specimens and normal gastric specimens. A total of 206 mRNAs, for which P<0.01 and |logFC|>2 were selected and considered as the most significantly differentially expressed mRNAs.
Table 3.
List of top 20 up-regulated and top 20 down-regulated DEGs in GSE33651
| Up-regulated | Down-regulated | ||||
|---|---|---|---|---|---|
|
|
|
||||
| Gene.symbol | adj. P. Val | logFC | Gene.symbol | adj. P. Val | logFC |
| TPM2///SETDB1 | 1.11E-08 | 3.0131642 | MUC5AC | 1.52E-18 | -6.1737005 |
| IGFBP7///TLCD1 | 5.24E-12 | 3.0976027 | HIST1H4C | 2.41E-15 | -4.9362316 |
| LCN2 | 7.47E-05 | 3.126299 | LINC00607 | 2.69E-04 | -4.8650322 |
| COL4A1 | 2.30E-13 | 3.1867801 | MT1E | 2.97E-17 | -3.7052832 |
| CXCL2///CXCL2 | 4.96E-07 | 3.2312427 | CKM | 9.30E-04 | -3.6714809 |
| IGFBP5 | 1.07E-11 | 3.3471907 | TNFRSF19 | 1.77E-03 | -3.5093672 |
| CXCL8 | 4.03E-05 | 3.3528075 | SNHG5 | 2.43E-13 | -3.4262254 |
| CLRN3 | 7.65E-03 | 3.3624408 | HIST1H4D | 9.26E-10 | -3.3827768 |
| LOC100506937 | 5.96E-03 | 3.431249 | SMG1P5 | 2.08E-14 | -3.0511987 |
| C3///ADH1B | 1.66E-06 | 3.4564663 | MIF | 4.06E-15 | -2.9295263 |
| FCGR3B///FCGR3A///FCGR3B | 3.79E-09 | 3.4759273 | PLEKHB2 | 4.38E-11 | -2.9285128 |
| SNTG1 | 7.49E-03 | 3.5194497 | TAX1BP3 | 6.66E-10 | -2.8569623 |
| INHBA | 2.43E-03 | 3.6596828 | FICD | 1.16E-13 | -2.727911 |
| RGS1 | 2.15E-11 | 3.7045805 | PSENEN | 4.49E-16 | -2.7148007 |
| CST13P | 1.03E-03 | 3.7083948 | NME3 | 4.33E-09 | -2.6402314 |
| CYR61 | 1.97E-06 | 3.8153501 | PPP1R15B | 9.98E-03 | -2.5830217 |
| RGS1 | 1.90E-10 | 4.3497434 | CBX5 | 8.21E-13 | -2.5424735 |
| ATG16L2 | 8.05E-04 | 5.1042386 | SST | 2.32E-04 | -2.5222501 |
| TMPRSS11B | 1.04E-03 | 5.1351031 | CHD9 | 1.27E-03 | -2.5074243 |
| TMPRSS11A | 3.37E-03 | 5.3930129 | MSH4 | 1.60E-03 | -2.4931796 |
Note: FC: Fold change.
GO terms enrichment analysis and KEGG pathway enrichment analysis of DEGs
To further gain insights into the biological roles of DEGs in gastric cancer, we performed GO terms enrichment analysis for 206 DEGs. Firstly, in the analysis of biological processes, these genes were mainly enriched for of immune response, cell adhesion and negative regulation of angiogenesis, see Figure 3A. Secondly, in the analysis of molecular function, these genes were enriched for heparin binding, integrin binding, extracellular matrix structural constituent, and CXCR chemokine receptor binding, see Figure 3B. Thirdly, in cell component analysis, these genes were mainly enriched for extracellular exosome, extracellular space, and cytosol, Figure 3C. We also performed KEGG pathway enrichment analysis to predict the signaling pathways mediated by these 206 DEGs, which revealed that 21 DEGs were significantly enriched in 8 pathways. They were extracellular matrix (ECM)-receptor interaction, amoebiasis, focal adhesion, systemic lupus erythematosus, alcoholism, protein digestion and absorption, p53 signaling pathway and pertussis, see Figure 3D and Table 4.
Figure 3.

The significantly enriched functional annotation of DEGs. Gene Ontology (GO) enrichment analysis was performed to determine the function of the DEGs in gastric cancer. Biological processes (A), cellular components (B), and molecular functions (C) of the DEGs. (D) Bar graph of the significantly enriched signaling pathways for DEGs.
Table 4.
KEGG pathway analysis of differentially expressed genes associated with gastric cancer
| Term | Count | % | P Value | Genes | FDR |
|---|---|---|---|---|---|
| hsa04512: ECM-receptor interaction | 7 | 0.029 | 2.90E-04 | COL4A2, COL4A1, COL1A2, COL1A1, THBS1, COL5A1, FN1 | 0.346683487 |
| hsa05146: Amoebiasis | 7 | 0.029 | 8.37E-04 | COL4A2, COL4A1, COL1A2, CXCL8, COL1A1, COL5A1, FN1 | 0.997222076 |
| hsa05322: Systemic lupus erythematosus | 6 | 0.025 | 0.013335949 | HIST1H4L, HLA-DRB1, FCGR1A, HIST1H4C, HIST1H4D, HIST3H3 | 14.84457736 |
| hsa04974: Protein digestion and absorption | 5 | 0.021 | 0.013718549 | COL4A2, COL4A1, COL1A2, COL1A1, COL5A1 | 15.23896471 |
| hsa04510: Focal adhesion | 7 | 0.029 | 0.021197208 | COL4A2, COL4A1, COL1A2, COL1A1, THBS1, COL5A1, FN1 | 22.61965164 |
| hsa04115: p53 signaling pathway | 4 | 0.017 | 0.033479742 | CYCS, SERPINE1, THBS1, GADD45B | 33.4742564 |
| hsa05034: Alcoholism | 6 | 0.025 | 0.03864605 | HIST1H4L, GNB4, HIST1H4C, HIST1H4D, HIST3H3, CALM1 | 37.60782894 |
| hsa05133: Pertussis | 4 | 0.017 | 0.044476951 | LY96, CXCL8, SERPING1, CALM1 | 41.98955616 |
The miRNA-Gene regulatory network in gastric cancer
Among the 206 DEGs, 159 DEGs could be found with corresponding miRNAs via miRWalk 3.0 platform. Using the DEGs to detect the miRNAs, the miRWalk platform identified 2491 miRNAs corresponding to DEGs, including 35 overlapping miRNAs with DEMs. Based on the overlapping miRNAs, a total of 385 miRNA-gene (DEM-DEG) regulatory pairs were identified, including 35 DEMs and 107 DEGs, see Table 5, and the miRNA-gene regulatory network was constructed by the Cytoscape software, see Figure 4. In the constructed miRNA-gene regulatory network, 5 mRNAs [chromobox 5 (CBX5), calmodulin 1 (CALM1), potassium channel modulatory factor 1 (KCMF1), autophagy cargo receptor (NBR1) and prostaglandin I2 synthase (PTGIS)] were found having a relative higher connectivity with miRNA and connected with 10 or more than 10 miRNAs, they were connected with 12, 11, 11, 10, 10 miRNAs respectively. Eight miRNAs, hsa-miR-5008-5p, hsa-miR-4715-5p, hsa-miR-3140-3p, and hsa-miR-3132, hsa-miR-222-5p, hsa-miR-3074-3p, hsa-miR-4776-5p, hsa-miR-93-p were found having a relative higher associations with mRNAs and connected with 20 or more than 20 RNAs, regulating 24, 24, 24, 23, 21, 20, 20, 20 mRNAs respectively.
Table 5.
The total 385 pairs of miRNA and gene
| Gene | miRNA | Gene | miRNA |
|---|---|---|---|
| ADAMTS9 | hsa-miR-3074-3p | NBR1 | hsa-miR-4418 |
| ADAMTS9 | hsa-miR-5008-5p | NBR1 | hsa-miR-4715-5p |
| ARID5B | hsa-miR-214-5p | NBR1 | hsa-miR-5000-3p |
| ARID5B | hsa-miR-222-5p | NME3 | hsa-miR-214-5p |
| ARID5B | hsa-miR-4714-3p | NOL7 | hsa-miR-187-5p |
| ARID5B | hsa-miR-93-3p | NOL7 | hsa-miR-222-5p |
| ARID5B | hsa-miR-4517 | NOL7 | hsa-miR-3663-3p |
| ARID5B | hsa-miR-4691-5p | PAIP2 | hsa-miR-93-3p |
| ARID5B | hsa-miR-4776-5p | PAIP2 | hsa-miR-4474-5p |
| ARID5B | hsa-miR-5008-5p | PAIP2 | hsa-miR-4715-5p |
| ASAP2 | hsa-miR-4776-5p | PCBP3 | hsa-miR-5003-5p |
| ASAP2 | hsa-miR-499a-3p | PCBP3 | hsa-miR-4691-5p |
| ATF3 | hsa-miR-148b-5p | PCBP3 | hsa-miR-5008-5p |
| ATF3 | hsa-miR-222-5p | PCM1 | hsa-miR-214-5p |
| ATF3 | hsa-miR-3140-3p | PCM1 | hsa-miR-4774-5p |
| ATF3 | hsa-miR-4418 | PDCD5 | hsa-miR-148b-5p |
| ATF3 | hsa-miR-4691-5p | PDCD5 | hsa-miR-3132 |
| ATF3 | hsa-miR-4715-5p | PDCD5 | hsa-miR-4715-5p |
| ATP2A3 | hsa-miR-214-5p | PDPN | hsa-miR-222-5p |
| ATP2A3 | hsa-miR-3132 | PDPN | hsa-miR-342-3p |
| ATP2A3 | hsa-miR-3140-3p | PDPN | hsa-miR-5579-3p |
| ATP2A3 | hsa-miR-3664-3p | PDPN | hsa-miR-4715-5p |
| BOD1L1 | hsa-miR-3132 | PDPN | hsa-miR-5008-5p |
| BOD1L1 | hsa-miR-5008-5p | PLEKHB2 | hsa-miR-222-5p |
| BRIX1 | hsa-miR-3607-5p | PLEKHB2 | hsa-miR-3074-3p |
| CALM1 | hsa-miR-148b-5p | PLEKHB2 | hsa-miR-5579-3p |
| CALM1 | hsa-miR-222-5p | PLEKHB2 | hsa-miR-4418 |
| CALM1 | hsa-miR-3074-3p | PLEKHB2 | hsa-miR-4715-5p |
| CALM1 | hsa-miR-323b-3p | PLEKHB2 | hsa-miR-494-3p |
| CALM1 | hsa-miR-34c-3p | PLEKHB2 | hsa-miR-548v |
| CALM1 | hsa-miR-3671 | POLR2E | hsa-miR-3074-3p |
| CALM1 | hsa-miR-93-3p | POLR2E | hsa-miR-4714-3p |
| CALM1 | hsa-miR-4691-5p | POLR2E | hsa-miR-5003-5p |
| CALM1 | hsa-miR-4776-5p | POLR2E | hsa-miR-4418 |
| CALM1 | hsa-miR-494-3p | POLR2E | hsa-miR-499a-3p |
| CALM1 | hsa-miR-5008-5p | POLR2E | hsa-miR-5008-5p |
| CBX5 | hsa-miR-222-5p | PPP1R15B | hsa-miR-187-5p |
| CBX5 | hsa-miR-3074-3p | PPP1R15B | hsa-miR-342-3p |
| CBX5 | hsa-miR-3132 | PPP1R15B | hsa-miR-4801 |
| CBX5 | hsa-miR-3140-3p | PPP1R15B | hsa-miR-4418 |
| CBX5 | hsa-miR-5003-5p | PPP1R15B | hsa-miR-5000-3p |
| CBX5 | hsa-miR-548au-3p | PPP1R7 | hsa-miR-187-5p |
| CBX5 | hsa-miR-4418 | PPP1R7 | hsa-miR-34c-3p |
| CBX5 | hsa-miR-4715-5p | PPP1R7 | hsa-miR-3664-3p |
| CBX5 | hsa-miR-4774-5p | PPP1R7 | hsa-miR-4714-3p |
| CBX5 | hsa-miR-4776-5p | PPP1R7 | hsa-miR-548au-3p |
| CBX5 | hsa-miR-499a-3p | PPP1R7 | hsa-miR-4774-5p |
| CBX5 | hsa-miR-5008-5p | PSENEN | hsa-miR-3140-3p |
| CHD9 | hsa-miR-5579-3p | PSMD14 | hsa-miR-3132 |
| CHD9 | hsa-miR-4776-5p | PTGIS | hsa-miR-187-5p |
| CLRN3 | hsa-miR-3140-3p | PTGIS | hsa-miR-222-5p |
| CLRN3 | hsa-miR-34c-3p | PTGIS | hsa-miR-3132 |
| CLRN3 | hsa-miR-4714-3p | PTGIS | hsa-miR-3140-3p |
| COL16A1 | hsa-miR-5003-5p | PTGIS | hsa-miR-3663-3p |
| COL16A1 | hsa-miR-4715-5p | PTGIS | hsa-miR-3664-3p |
| COL4A1 | hsa-miR-548v | PTGIS | hsa-miR-4714-3p |
| COL4A2 | hsa-miR-4691-5p | PTGIS | hsa-miR-93-3p |
| COL4A2 | hsa-miR-4715-5p | PTGIS | hsa-miR-494-3p |
| COL5A1 | hsa-miR-4715-5p | PTGIS | hsa-miR-5000-3p |
| CTGF | hsa-miR-93-3p | RAB31 | hsa-miR-3074-3p |
| CXCL10 | hsa-miR-3140-3p | RAB31 | hsa-miR-3132 |
| CXCL10 | hsa-miR-3663-3p | RAB31 | hsa-miR-342-3p |
| CXCL10 | hsa-miR-93-3p | RAB31 | hsa-miR-4418 |
| CXCL10 | hsa-miR-4776-5p | RAB31 | hsa-miR-4715-5p |
| CXCL10 | hsa-miR-5008-5p | RACK1 | hsa-miR-148b-5p |
| CXCL8 | hsa-miR-34c-3p | RGS1 | hsa-miR-3663-3p |
| CYCS | hsa-miR-214-5p | RGS1 | hsa-miR-4714-3p |
| CYCS | hsa-miR-222-5p | S100A10 | hsa-miR-3140-3p |
| CYCS | hsa-miR-3074-3p | SERPINE1 | hsa-miR-214-5p |
| CYCS | hsa-miR-34c-3p | SERPINE1 | hsa-miR-222-5p |
| CYCS | hsa-miR-3664-3p | SERPINF1 | hsa-miR-5003-5p |
| CYCS | hsa-miR-93-3p | SERPING1 | hsa-miR-3132 |
| CYCS | hsa-miR-4715-5p | SERPING1 | hsa-miR-4715-5p |
| CYCS | hsa-miR-5008-5p | SIK1 | hsa-miR-3074-3p |
| CYCS | hsa-miR-548v | SIK1 | hsa-miR-3132 |
| CYR61 | hsa-miR-3140-3p | SIK1 | hsa-miR-548au-3p |
| CYR61 | hsa-miR-34c-3p | SIK1 | hsa-miR-4776-5p |
| CYR61 | hsa-miR-548au-3p | SIK1 | hsa-miR-5008-5p |
| CYR61 | hsa-miR-4691-5p | SLC31A1 | hsa-miR-214-5p |
| CYR61 | hsa-miR-548v | SLC31A1 | hsa-miR-3074-3p |
| DNAJA1 | hsa-miR-3664-3p | SLC31A1 | hsa-miR-3132 |
| DNAJA1 | hsa-miR-5579-3p | SLC31A1 | hsa-miR-323b-3p |
| DUSP5 | hsa-miR-187-5p | SLC31A1 | hsa-miR-3671 |
| DUSP5 | hsa-miR-3140-3p | SLC31A1 | hsa-miR-548au-3p |
| DUSP5 | hsa-miR-323b-3p | SLC31A1 | hsa-miR-4691-5p |
| ETS2 | hsa-miR-34c-3p | SLC31A1 | hsa-miR-4699-5p |
| ETS2 | hsa-miR-4714-3p | SLC31A1 | hsa-miR-5008-5p |
| ETS2 | hsa-miR-5008-5p | SNTG1 | hsa-miR-187-5p |
| FAM171B | hsa-miR-499a-3p | SNTG1 | hsa-miR-3140-3p |
| FAP | hsa-miR-5579-3p | SNTG1 | hsa-miR-3663-3p |
| FBXO32 | hsa-miR-214-5p | SNTG1 | hsa-miR-93-3p |
| FBXO32 | hsa-miR-3074-3p | SNTG1 | hsa-miR-4517 |
| FBXO32 | hsa-miR-3140-3p | SOD2 | hsa-miR-187-5p |
| FBXO32 | hsa-miR-548au-3p | SOD2 | hsa-miR-214-5p |
| FBXO32 | hsa-miR-93-3p | SOD2 | hsa-miR-3074-3p |
| FBXO32 | hsa-miR-4418 | SOD2 | hsa-miR-3607-5p |
| FBXO32 | hsa-miR-4517 | SOD2 | hsa-miR-3663-3p |
| FBXO32 | hsa-miR-5000-3p | SOD2 | hsa-miR-4714-3p |
| FCGR1A | hsa-miR-3132 | SOD2 | hsa-miR-4418 |
| FCGR1A | hsa-miR-5003-5p | SOD2 | hsa-miR-4776-5p |
| FTSJ3 | hsa-miR-3140-3p | SOD2 | hsa-miR-5008-5p |
| FTSJ3 | hsa-miR-93-3p | SORL1 | hsa-miR-187-5p |
| GABARAP | hsa-miR-4714-3p | SORL1 | hsa-miR-3074-3p |
| GADD45B | hsa-miR-214-5p | SORL1 | hsa-miR-3664-3p |
| GADD45B | hsa-miR-4715-5p | SORL1 | hsa-miR-4714-3p |
| GLIPR1 | hsa-miR-222-5p | SOSTDC1 | hsa-miR-93-3p |
| GLIPR1 | hsa-miR-548au-3p | SOSTDC1 | hsa-miR-4776-5p |
| GLIPR1 | hsa-miR-4474-5p | SOSTDC1 | hsa-miR-5000-3p |
| GLIPR1 | hsa-miR-4776-5p | SOX21 | hsa-miR-3132 |
| GLIPR1 | hsa-miR-5008-5p | SOX21 | hsa-miR-4715-5p |
| GNB4 | hsa-miR-4714-3p | SRGAP2C | hsa-miR-222-5p |
| GNB4 | hsa-miR-4776-5p | SRGAP2C | hsa-miR-93-3p |
| GNB4 | hsa-miR-499a-3p | SRGAP2C | hsa-miR-4474-5p |
| GNB4 | hsa-miR-5008-5p | SRGAP2C | hsa-miR-494-3p |
| GPSM1 | hsa-miR-3074-3p | SRP14 | hsa-miR-4776-5p |
| GPSM1 | hsa-miR-3664-3p | STEAP4 | hsa-miR-214-5p |
| GPSM1 | hsa-miR-548au-3p | STEAP4 | hsa-miR-3074-3p |
| GPSM1 | hsa-miR-93-3p | STEAP4 | hsa-miR-3140-3p |
| GPSM1 | hsa-miR-4774-5p | STEAP4 | hsa-miR-4714-3p |
| GUCY1A3 | hsa-miR-187-5p | STEAP4 | hsa-miR-548au-3p |
| GUCY1A3 | hsa-miR-222-5p | STEAP4 | hsa-miR-4691-5p |
| GUCY1A3 | hsa-miR-3140-3p | STEAP4 | hsa-miR-5000-3p |
| GUCY1A3 | hsa-miR-4714-3p | STEAP4 | hsa-miR-5008-5p |
| GUCY1A3 | hsa-miR-4715-5p | STX16 | hsa-miR-148b-5p |
| HACD3 | hsa-miR-4715-5p | STX16 | hsa-miR-3074-3p |
| HACD3 | hsa-miR-4776-5p | STX16 | hsa-miR-3132 |
| HACD3 | hsa-miR-499a-3p | STX16 | hsa-miR-3140-3p |
| HEATR3 | hsa-miR-4774-5p | STX16 | hsa-miR-93-3p |
| HLA-DRB1 | hsa-miR-5008-5p | STX16 | hsa-miR-4691-5p |
| HPGD | hsa-miR-3140-3p | STX16 | hsa-miR-4715-5p |
| HPGD | hsa-miR-4517 | SULF1 | hsa-miR-148b-5p |
| HTRA1 | hsa-miR-222-5p | SULF1 | hsa-miR-214-5p |
| HTRA1 | hsa-miR-4776-5p | SULF1 | hsa-miR-3140-3p |
| IER5 | hsa-miR-3132 | SULF1 | hsa-miR-4714-3p |
| IFI6 | hsa-miR-3132 | SULF1 | hsa-miR-499a-3p |
| IFI6 | hsa-miR-3664-3p | SYNPO2 | hsa-miR-214-5p |
| INHBA | hsa-miR-214-5p | SYNPO2 | hsa-miR-3140-3p |
| INHBA | hsa-miR-3132 | SYNPO2 | hsa-miR-34c-3p |
| ISCA1 | hsa-miR-3671 | SYNPO2 | hsa-miR-3607-5p |
| IVNS1ABP | hsa-miR-3132 | SYNPO2 | hsa-miR-3671 |
| IVNS1ABP | hsa-miR-4715-5p | SYNPO2 | hsa-miR-548au-3p |
| IVNS1ABP | hsa-miR-4776-5p | SYNPO2 | hsa-miR-4776-5p |
| IVNS1ABP | hsa-miR-499a-3p | SYNPO2 | hsa-miR-499a-3p |
| KARS | hsa-miR-3663-3p | TAX1BP3 | hsa-miR-214-5p |
| KCMF1 | hsa-miR-222-5p | TAX1BP3 | hsa-miR-3074-3p |
| KCMF1 | hsa-miR-3140-3p | TAX1BP3 | hsa-miR-5008-5p |
| KCMF1 | hsa-miR-3663-3p | TBC1D8B | hsa-miR-222-5p |
| KCMF1 | hsa-miR-3664-3p | TBC1D8B | hsa-miR-3074-3p |
| KCMF1 | hsa-miR-4801 | TBC1D8B | hsa-miR-3140-3p |
| KCMF1 | hsa-miR-5003-5p | TBC1D8B | hsa-miR-93-3p |
| KCMF1 | hsa-miR-548au-3p | TBC1D8B | hsa-miR-4474-5p |
| KCMF1 | hsa-miR-93-3p | TCEAL4 | hsa-miR-3132 |
| KCMF1 | hsa-miR-4774-5p | TFB1M | hsa-miR-222-5p |
| KCMF1 | hsa-miR-4776-5p | TFB1M | hsa-miR-4714-3p |
| KCMF1 | hsa-miR-5000-3p | THBS1 | hsa-miR-222-5p |
| KCNJ8 | hsa-miR-148b-5p | THBS1 | hsa-miR-4418 |
| KCNJ8 | hsa-miR-222-5p | THY1 | hsa-miR-5003-5p |
| KCNJ8 | hsa-miR-3663-3p | THY1 | hsa-miR-5579-3p |
| KCNJ8 | hsa-miR-3664-3p | THY1 | hsa-miR-5008-5p |
| KIAA1143 | hsa-miR-187-5p | TLK1 | hsa-miR-3132 |
| KIAA1143 | hsa-miR-3140-3p | TLK1 | hsa-miR-3663-3p |
| KIAA1143 | hsa-miR-323b-3p | TLK1 | hsa-miR-548au-3p |
| KIAA1143 | hsa-miR-34c-3p | TLK1 | hsa-miR-5579-3p |
| KIAA1143 | hsa-miR-4691-5p | TLK1 | hsa-miR-499a-3p |
| KIAA1143 | hsa-miR-4715-5p | TLK1 | hsa-miR-5008-5p |
| KIAA1143 | hsa-miR-4776-5p | TMPRSS11B | hsa-miR-3671 |
| KIAA1143 | hsa-miR-5008-5p | TMPRSS11B | hsa-miR-93-3p |
| LCN2 | hsa-miR-5008-5p | TMPRSS11B | hsa-miR-4691-5p |
| LST1 | hsa-miR-3140-3p | TMPRSS11B | hsa-miR-4715-5p |
| MAL | hsa-miR-323b-3p | TMPRSS6 | hsa-miR-3140-3p |
| MAL | hsa-miR-3663-3p | TNFRSF19 | hsa-miR-222-5p |
| MAP3K13 | hsa-miR-3074-3p | TNFRSF19 | hsa-miR-3132 |
| MAP3K13 | hsa-miR-342-3p | TNFRSF19 | hsa-miR-3607-5p |
| MAP3K13 | hsa-miR-4714-3p | TNFRSF19 | hsa-miR-4801 |
| MAP3K13 | hsa-miR-5579-3p | TNFRSF19 | hsa-miR-548au-3p |
| MAP3K13 | hsa-miR-5692c | TNFRSF19 | hsa-miR-4691-5p |
| MAP3K13 | hsa-miR-494-3p | TNFRSF19 | hsa-miR-4699-5p |
| MAP3K13 | hsa-miR-5008-5p | TNFRSF19 | hsa-miR-4774-5p |
| MED18 | hsa-miR-214-5p | TUBB6 | hsa-miR-3132 |
| MED18 | hsa-miR-4714-3p | UBE2Q2 | hsa-miR-3074-3p |
| MED18 | hsa-miR-4715-5p | UBE2Q2 | hsa-miR-5579-3p |
| MED18 | hsa-miR-4776-5p | UBE2V2 | hsa-miR-148b-5p |
| MGP | hsa-miR-3132 | UBE2V2 | hsa-miR-3132 |
| MS4A6A | hsa-miR-187-5p | UBE2V2 | hsa-miR-34c-3p |
| MS4A6A | hsa-miR-93-3p | UBE2V2 | hsa-miR-3663-3p |
| MS4A6A | hsa-miR-499a-3p | UBE2V2 | hsa-miR-93-3p |
| NBR1 | hsa-miR-148b-5p | UBE2V2 | hsa-miR-4418 |
| NBR1 | hsa-miR-214-5p | UBE2V2 | hsa-miR-4715-5p |
| NBR1 | hsa-miR-222-5p | UGDH | hsa-miR-4776-5p |
| NBR1 | hsa-miR-3074-3p | ZDHHC12 | hsa-miR-4715-5p |
| NBR1 | hsa-miR-342-3p | ZFP36L2 | hsa-miR-3664-3p |
| NBR1 | hsa-miR-5003-5p | ZFP36L2 | hsa-miR-5003-5p |
| NBR1 | hsa-miR-93-3p |
Figure 4.

The regulatory network between DEMs and DEGs in gastric cancer specimens. The diamond nodes and oval nodes represent miRNAs and mRNA, respectively. The miRNA-gene regulatory network was constructed based on 385 miRNA-gene (DEM-DEG) pairs, consisting of 35 miRNAs and 107 target genes. Five mRNAs [CBX5, CALM1, KCMF1, NBR1 and PTGIS] were found having the highest connectivity with miRNAs, associated with 12, 11, 11, 10, 10 miRNAs, respectively.
miRNA-gene-pathway relationship in gastric cancer
Based on the constructed miRNA-gene regulatory network and the KEGG analysis for DEGs, the common RNAs between these two were screened out. The miRNA-gene-pathway relationship in gastric cancer was elucidated via the connection of common RNAs, see Table 6.
Table 6.
The miRNA-gene-pathway relationship
| mRNA | miRNA | Pathway | mRNA | miRNA | Pathway |
|---|---|---|---|---|---|
| CALM1 | hsa-miR-148b-5p | Alcoholism | COL5A1 | hsa-miR-4715-5p | Focal adhesion |
| CALM1 | hsa-miR-222-5p | Alcoholism | CXCL8 | hsa-miR-34c-3p | Amoebiasis |
| CALM1 | hsa-miR-3074-3p | Alcoholism | CXCL8 | hsa-miR-34c-3p | Pertussis |
| CALM1 | hsa-miR-323b-3p | Alcoholism | CYCS | hsa-miR-214-5p | p53 signaling pathway |
| CALM1 | hsa-miR-34c-3p | Alcoholism | CYCS | hsa-miR-222-5p | p53 signaling pathway |
| CALM1 | hsa-miR-3671 | Alcoholism | CYCS | hsa-miR-3074-3p | p53 signaling pathway |
| CALM1 | hsa-miR-93-3p | Alcoholism | CYCS | hsa-miR-34c-3p | p53 signaling pathway |
| CALM1 | hsa-miR-4691-5p | Alcoholism | CYCS | hsa-miR-3664-3p | p53 signaling pathway |
| CALM1 | hsa-miR-4776-5p | Alcoholism | CYCS | hsa-miR-93-3p | p53 signaling pathway |
| CALM1 | hsa-miR-494-3p | Alcoholism | CYCS | hsa-miR-4715-5p | p53 signaling pathway |
| CALM1 | hsa-miR-5008-5p | Alcoholism | CYCS | hsa-miR-5008-5p | p53 signaling pathway |
| CALM1 | hsa-miR-148b-5p | Pertussis | CYCS | hsa-miR-548v | p53 signaling pathway |
| CALM1 | hsa-miR-222-5p | Pertussis | FCGR1A | hsa-miR-3132 | Systemic lupus erythematosus |
| CALM1 | hsa-miR-3074-3p | Pertussis | FCGR1A | hsa-miR-5003-5p | Systemic lupus erythematosus |
| CALM1 | hsa-miR-323b-3p | Pertussis | GADD45B | hsa-miR-214-5p | p53 signaling pathway |
| CALM1 | hsa-miR-34c-3p | Pertussis | GADD45B | hsa-miR-4715-5p | p53 signaling pathway |
| CALM1 | hsa-miR-3671 | Pertussis | GNB4 | hsa-miR-4714-3p | Alcoholism |
| CALM1 | hsa-miR-93-3p | Pertussis | GNB4 | hsa-miR-4776-5p | Alcoholism |
| CALM1 | hsa-miR-4691-5p | Pertussis | GNB4 | hsa-miR-499a-3p | Alcoholism |
| CALM1 | hsa-miR-4776-5p | Pertussis | GNB4 | hsa-miR-5008-5p | Alcoholism |
| CALM1 | hsa-miR-494-3p | Pertussis | HLA-DRB1 | hsa-miR-5008-5p | Systemic lupus erythematosus |
| CALM1 | hsa-miR-5008-5p | Pertussis | SERPINE1 | hsa-miR-214-5p | p53 signaling pathway |
| COL4A1 | hsa-miR-548v | ECM-receptor interaction | SERPINE1 | hsa-miR-222-5p | p53 signaling pathway |
| COL4A1 | hsa-miR-548v | Amoebiasis | SERPINE1 | hsa-miR-214-5p | Pertussis |
| COL4A1 | hsa-miR-548v | Protein digestion and absorption | SERPINE1 | hsa-miR-222-5p | Pertussis |
| COL4A1 | hsa-miR-548v | Focal adhesion | SERPINF1 | hsa-miR-5003-5p | p53 signaling pathway |
| COL4A2 | hsa-miR-4691-5p | ECM-receptor interaction | SERPINF1 | hsa-miR-5003-5p | Pertussis |
| COL4A2 | hsa-miR-4715-5p | ECM-receptor interaction | SERPING1 | hsa-miR-3132 | p53 signaling pathway |
| COL4A2 | hsa-miR-4691-5p | Amoebiasis | SERPING1 | hsa-miR-4715-5p | p53 signaling pathway |
| COL4A2 | hsa-miR-4715-5p | Amoebiasis | SERPING1 | hsa-miR-3132 | Pertussis |
| COL4A2 | hsa-miR-4691-5p | Protein digestion and absorption | SERPING1 | hsa-miR-4715-5p | Pertussis |
| COL4A2 | hsa-miR-4715-5p | Protein digestion and absorption | THBS1 | hsa-miR-222-5p | ECM-receptor interaction |
| COL4A2 | hsa-miR-4691-5p | Focal adhesion | THBS1 | hsa-miR-4418 | ECM-receptor interaction |
| COL4A2 | hsa-miR-4715-5p | Focal adhesion | THBS1 | hsa-miR-222-5p | p53 signaling pathway |
| COL5A1 | hsa-miR-4715-5p | ECM-receptor interaction | THBS1 | hsa-miR-4418 | p53 signaling pathway |
| COL5A1 | hsa-miR-4715-5p | Amoebiasis |
Verification of mRNA expression levels in an independent database containing 1,065 gastric cancer patients from Kaplan-Meier Plotter tools
It is reasonable to confirm the above findings of GEO data in other independent datasets. The top 5 up-regulated DEGs (Transmembrane Protease, Serine 11B (TMPRSS11B, logFC=5.14), regulator of G protein signaling 1 (RGS1, logFC=4.35), cysteine rich angiogenic inducer 61 (CYR61, logFC=3.82), inhibin subunit beta A (INHBA, logFC=3.66), syntrophin gamma 1 (SNTG1, logFC=3.52)) and top 5 down-regulated DEGs (tumor necrosis factor receptor superfamily, member 19 (TNFRSF19, logFC=-3.51), pleckstrin homology domain containing B2 (PLEKHB2, logFC=-2.93), Tax1 binding protein 3 (TAX1BP3, logFC=-2.86), presenilin enhancer, gamma-secretase subunit (PSENEN, logFC=-2.71), NME/NM23 nucleoside diphosphate kinase 3 (NME3, logFC=-2.64)) in the miRNA-gene regulatory network were selected and analyzed in an independent gastric cancer database from Kaplan-Meier Plotter tools. The overall survival time of patients with gastric cancer was evaluated based on the average level of these 10 gene sets in this database. Results showed that two genes, TMPRSS11B and CYR61, were found no significant predictive value for the survival of gastric cancer patients (P>0.05). While patients with higher level of RGS1, PLEKHB2, TAX1BP3 and PSENEN in gastric cancer had a longer survival time compared with the patients with lower level of these genes. On the contrary, the patients with higher level of INHBA, SNTG1, TNFRSF19 and NME3 were found associated with a shorter survival time, see Figure 5.
Figure 5.

Prognostic value of eight genes, RGS1, PLEKHB2, TAX1BP3, PSENEN, INHBA, SNTG1, TNFRSF19 and NME3 for survival time in gastric cancer patients.
Discussion
With the development of bioinformatics technology, a new era of the detection of cancer has arrived. The recognition of differentially expressed genes and miRNAs from primary gastric carcinoma specimens may provide effective diagnostic biomarkers and potential treatment target for gastric cancer. In the present study, based on a series of bioinformatics tools, a miRNA-gene regulatory network has been concluded by comparing gastric cancer specimens with normal gastric specimens, which may be critically involved in the development and progression of gastric cancer. What’ more, our results revealed that these differentially expressed mRNAs play a role in a series of biological processes and signaling pathway in gastric cancer. Meanwhile, we found that 8 of 10 genes with the most significant changes in our miRNA-gene regulatory network based on GEO database, possessed an ability of survival prediction in another clinical database including 1067 gastric cancer patients.
The difference in their transcriptional responses is a key cause for the differences between gastric cancer specimens and normal gastric specimens in situ. Hence, the exploration of the differential expression of the miRNA-gene regulatory network between them is of importance with the purpose of extensive understanding of the molecular mechanism of gastric cancer. With the construction of the miRNA-gene regulatory network in our study, the relationship between DEMs and DEGs during the development and progression of gastric cancer became clearer. In our study, the miRNA-gene regulatory network was drawn based on 385 miRNA-gene correlation pairs, in which, CBX5, CALM1, KCMF1, NBR1, PTGIS were associated with at least 10 miRNAs, and defined as having higher connectivity with miRNAs. It has been reported that gene expression of CXB5 elevated in gastric tumor tissue and was down-regulated more than 2-fold by vorinostat treatment in gastric cancer cell lines, which suggested that the gene CXB5 may represent an emerging molecule to discover therapeutic agents for gastric cancer [28]. KCMF1 mRNA expression has been found up-regulated in gastric cancer cells and epithelial tumors, and previous reports have linked KCMF1 to cellular motility, invasion, and cancer progression [29]. However, the role of CALM1, NBR1, PTGIS in gastric cancer was under investigate and may be the next diagnostic and therapeutic targets for gastric cancer.
In addition, mRNA of RGS1, INHBA, SNTG1, TNFRSF19, PLEKHB2, TAX1BP3, PSENEN, NME3, which were among the 10 most significant changed mRNA in the miRNA-gene regulatory network, have been confirmed associated with the prognosis of gastric cancer patients from another independent database. Patients with higher level of RGS1, PLEKHB2, TAX1BP3 and PSENEN in gastric cancer had a longer survival time compared with the patients with lower level of these genes. On the contrary, patients with higher level of INHBA, SNTG1, TNFRSF19 and NME3 were found associated with a shorter survival time. The role RGS1, INHBA, TNFRSF19 in gastric cancer has been once investigated. RGS1, encoding a member of the regulator of G-protein signaling family, has been shown to be up-regulated in diffuse-type gastric cancer cells compared with mesenchymal stem cells and thought a critical role to response cancer cells, however, its role in survival prediction of gastric cancer patients has not been investigated [30-32]. Our study suggested higher expression of RGS1 associated longer survival time. INHBA, is a ligand belonging to the transforming growth factor-β superfamily, and its expression levels were significantly higher in gastric cancer tissue than in adjacent normal mucosa, which were related to TNM stage and venous invasion and high INHBA gene expression was correlated with significantly poorer 5-year overall survival than was low expression [31]. In our study, we also found high INHBA correlated to a poorer survival. TNFRSF19, encoding a member of the TNF-receptor superfamily, has been found more commonly in intestinal type gastric cancer compared with diffuse type gastric cancer, correlated inversely with tumor grade and nodal spread, and supposed an inverse prognosticator of poor patient outcome [32]. In our study, we confirmed that TNFRSF19 was a survival predictor. However, the role of SNTG1, PLEKHB2, TAX1BP3, PSENEN, NME3 in gastric cancer was under investigate and may be the next diagnostic and therapeutic targets for gastric cancer.
In our study, we found the DEGs were significantly enriched in 8 signal pathways. Several pathways have been demonstrated participating in the pathological process gastric cancer, including focal adhesion, p53 signaling pathway signaling pathway, with the rest unexplored pathways may be the next potential therapeutic targets [33-38].
Nevertheless, our study was performed based on bioinformatics method and GEO database, which lacked basic experimental and clinical investigation. Further experimental and clinical studies were expected to verify our findings.
By bioinformatics method, we identified a miRNA-gene-pathway regulatory work net, which provided several potential targets regarding gastric cancer and may result in a new strategy to treat gastric cancer from a systems-rather than a single-gene perspective.
Disclosure of conflict of interest
None.
References
- 1.Esser D, Holze N, Haag J, Schreiber S, Kruger S, Warneke V, Rosenstiel P, Rocken C. Interpreting whole genome and exome sequencing data of individual gastric cancer samples. BMC Genomics. 2017;18:517. doi: 10.1186/s12864-017-3895-z. [DOI] [PMC free article] [PubMed] [Google Scholar]
- 2.Carcas LP. Gastric cancer review. J Carcinog. 2014;13:14. doi: 10.4103/1477-3163.146506. [DOI] [PMC free article] [PubMed] [Google Scholar]
- 3.Yan L. The journey of personalizing gastric cancer treatment. Chin J Cancer. 2016;35:84. doi: 10.1186/s40880-016-0149-4. [DOI] [PMC free article] [PubMed] [Google Scholar]
- 4.Lin X, Zhao Y, Song WM, Zhang B. Molecular classification and prediction in gastric cancer. Comput Struct Biotechnol J. 2015;13:448–458. doi: 10.1016/j.csbj.2015.08.001. [DOI] [PMC free article] [PubMed] [Google Scholar]
- 5.Wang Y. Transcriptional regulatory network analysis for gastric cancer based on mRNA microarray. Pathol Oncol Res. 2017;23:785–791. doi: 10.1007/s12253-016-0159-1. [DOI] [PubMed] [Google Scholar]
- 6.Zhang H, Qu Y, Duan J, Deng T, Liu R, Zhang L, Bai M, Li J, Zhou L, Ning T, Li H, Ge S, Li H, Ying G, Huang D, Ba Y. Integrated analysis of the miRNA, gene and pathway regulatory network in gastric cancer. Oncol Rep. 2016;35:1135–1146. doi: 10.3892/or.2015.4451. [DOI] [PubMed] [Google Scholar]
- 7.Zhang X, Ni Z, Duan Z, Xin Z, Wang H, Tan J, Wang G, Li F. Overexpression of E2F mRNAs associated with gastric cancer progression identified by the transcription factor and miRNA co-regulatory network analysis. PLoS One. 2015;10:e0116979. doi: 10.1371/journal.pone.0116979. [DOI] [PMC free article] [PubMed] [Google Scholar]
- 8.Zhang J, Lu C, Shang Z, Xing R, Shi L, Lv Y. p42.3 gene expression in gastric cancer cell and its protein regulatory network analysis. Theor Biol Med Model. 2012;9:53. doi: 10.1186/1742-4682-9-53. [DOI] [PMC free article] [PubMed] [Google Scholar]
- 9.Chen Y, Lin J, Yang M, Xu CW, Chen BZ, Li XJ, Zhu WF, Fu WD, Yu H, Ying MG, Chen G. Expression and prognostic roles of magnesium-dependent phosphatase-1 in gastric cancer. Eur Rev Med Pharmacol Sci. 2017;21:2617–2625. [PubMed] [Google Scholar]
- 10.Zhao K, Li G, Yao Y, Zhou Y, Li Z, Guo Q, Lu N. Activation of phospholipase C-gamma1 and translocation of phosphatidylinositol-3,4,5-trisphosphate 3-phosphatase contribute to GL-V9-induced apoptosis in human gastric cancer cells. Exp Cell Res. 2017;356:8–19. doi: 10.1016/j.yexcr.2017.03.063. [DOI] [PubMed] [Google Scholar]
- 11.Jiang PH, Motoo Y, Garcia S, Iovanna JL, Pebusque MJ, Sawabu N. Down-expression of tumor protein p53-induced nuclear protein 1 in human gastric cancer. World J Gastroenterol. 2006;12:691–696. doi: 10.3748/wjg.v12.i5.691. [DOI] [PMC free article] [PubMed] [Google Scholar]
- 12.Villaseca M, Araya JC, Roa I, Roa JC. Gastric cancer and tumor growth regulation. Study of cell proliferation markers and protein complex p53/p21WAF1/CIP1/mdm-2. Rev Med Chil. 2000;128:127–136. [PubMed] [Google Scholar]
- 13.Hsu JT, Chen TD, Chuang HC, Huang SC, Le PH, Chen TH, Lin CJ, Yeh TS. Vascular endothelial growth factor expression is an independent poor prognostic factor for human epidermal growth factor receptor 2 positive gastric cancer. J Surg Res. 2017;208:40–50. doi: 10.1016/j.jss.2016.09.004. [DOI] [PubMed] [Google Scholar]
- 14.Wang L, Chang Y, Xu J, Zhang Q. Predictive significance of serum level of vascular endothelial growth factor in gastric cancer patients. Biomed Res Int. 2016;2016:8103019. doi: 10.1155/2016/8103019. [DOI] [PMC free article] [PubMed] [Google Scholar]
- 15.Tao Y, Yang S, Wu Y, Fang X, Wang Y, Song Y, Han T. MicroRNA-216a inhibits the metastasis of gastric cancer cells by targeting JAK2/STAT3-mediated EMT process. Oncotarget. 2017;8:88870–88881. doi: 10.18632/oncotarget.21488. [DOI] [PMC free article] [PubMed] [Google Scholar] [Retracted]
- 16.Wang X, Liu B, Wen F, Song Y. MicroRNA-454 inhibits the malignant biological behaviours of gastric cancer cells by directly targeting mitogen-activated protein kinase 1. Oncol Rep. 2018;39:1494–1504. doi: 10.3892/or.2017.6171. [DOI] [PubMed] [Google Scholar]
- 17.Li L, Zhu X, Shou T, Yang L, Cheng X, Wang J, Deng L, Zheng Y. MicroRNA-28 promotes cell proliferation and invasion in gastric cancer via the PTEN/PI3K/AKT signalling pathway. Mol Med Rep. 2018;17:4003–4010. doi: 10.3892/mmr.2017.8299. [DOI] [PubMed] [Google Scholar]
- 18.Xu X, Gao F, Wang J, Tao L, Ye J, Ding L, Ji W, Chen X. MiR-122-5p inhibits cell migration and invasion in gastric cancer by down-regulating DUSP4. Cancer Biol Ther. 2018;19:427–435. doi: 10.1080/15384047.2018.1423925. [DOI] [PMC free article] [PubMed] [Google Scholar]
- 19.Park JH, Park J, Choi JK, Lyu J, Bae MG, Lee YG, Bae JB, Park DY, Yang HK, Kim TY, Kim YJ. Identification of DNA methylation changes associated with human gastric cancer. BMC Med Genomics. 2011;4:82. doi: 10.1186/1755-8794-4-82. [DOI] [PMC free article] [PubMed] [Google Scholar]
- 20.Edgar R, Domrachev M, Lash AE. Gene expression omnibus: NCBI gene expression and hybridization array data repository. Nucleic Acids Res. 2002;30:207–210. doi: 10.1093/nar/30.1.207. [DOI] [PMC free article] [PubMed] [Google Scholar]
- 21.Davis S, Meltzer PS. GEOquery: a bridge between the gene expression omnibus (GEO) and BioConductor. Bioinformatics. 2007;23:1846–1847. doi: 10.1093/bioinformatics/btm254. [DOI] [PubMed] [Google Scholar]
- 22.Dennis G Jr, Sherman BT, Hosack DA, Yang J, Gao W, Lane HC, Lempicki RA. DAVID: database for annotation, visualization, and integrated discovery. Genome Biol. 2003;4:P3. [PubMed] [Google Scholar]
- 23.Gene Ontology Consortium. The gene ontology (GO) project in 2006. Nucleic Acids Res. 2006;34:D322–6. doi: 10.1093/nar/gkj021. [DOI] [PMC free article] [PubMed] [Google Scholar]
- 24.Ogata H, Goto S, Sato K, Fujibuchi W, Bono H, Kanehisa M. KEGG: Kyoto encyclopedia of genes and genomes. Nucleic Acids Res. 1999;27:29–34. doi: 10.1093/nar/27.1.29. [DOI] [PMC free article] [PubMed] [Google Scholar]
- 25.Dweep H, Sticht C, Pandey P, Gretz N. miRwalk--database: prediction of possible miRNA binding sites by “walking” the genes of three genomes. J Biomed Inform. 2011;44:839–847. doi: 10.1016/j.jbi.2011.05.002. [DOI] [PubMed] [Google Scholar]
- 26.Kohl M, Wiese S, Warscheid B. Cytoscape: software for visualization and analysis of biological networks. Methods Mol Biol. 2011;696:291–303. doi: 10.1007/978-1-60761-987-1_18. [DOI] [PubMed] [Google Scholar]
- 27.Szasz AM, Lanczky A, Nagy A, Forster S, Hark K, Green JE, Boussioutas A, Busuttil R, Szabo A, Gyorffy B. Cross-validation of survival associated biomarkers in gastric cancer using transcriptomic data of 1,065 patients. Oncotarget. 2016;7:49322–49333. doi: 10.18632/oncotarget.10337. [DOI] [PMC free article] [PubMed] [Google Scholar]
- 28.Claerhout S, Lim JY, Choi W, Park YY, Kim K, Kim SB, Lee JS, Mills GB, Cho JY. Gene expression signature analysis identifies vorinostat as a candidate therapy for gastric cancer. PLoS One. 2011;6:e24662. doi: 10.1371/journal.pone.0024662. [DOI] [PMC free article] [PubMed] [Google Scholar]
- 29.Zou J, Mi L, Yu XF, Dong J. Interaction of 14-3-3sigma with KCMF1 suppresses the proliferation and colony formation of human colon cancer stem cells. World J Gastroenterol. 2013;19:3770–3780. doi: 10.3748/wjg.v19.i24.3770. [DOI] [PMC free article] [PubMed] [Google Scholar]
- 30.Tanabe S, Aoyagi K, Yokozaki H, Sasaki H. Regulated genes in mesenchymal stem cells and gastric cancer. World J Stem Cells. 2015;7:208–222. doi: 10.4252/wjsc.v7.i1.208. [DOI] [PMC free article] [PubMed] [Google Scholar]
- 31.Katayama Y, Oshima T, Sakamaki K, Aoyama T, Sato T, Masudo K, Shiozawa M, Yoshikawa T, Rino Y, Imada T, Masuda M. Clinical significance of INHBA gene expression in patients with gastric cancer who receive curative resection followed by adjuvant S-1 chemotherapy. In Vivo. 2017;31:565–571. doi: 10.21873/invivo.11095. [DOI] [PMC free article] [PubMed] [Google Scholar]
- 32.Wilhelm F, Boger C, Kruger S, Behrens HM, Rocken C. Troy is expressed in human stomach mucosa and a novel putative prognostic marker of intestinal type gastric cancer. Oncotarget. 2017;8:50557–50569. doi: 10.18632/oncotarget.10672. [DOI] [PMC free article] [PubMed] [Google Scholar]
- 33.Wei GH, Wang X. lncRNA MEG3 inhibit proliferation and metastasis of gastric cancer via p53 signaling pathway. Eur Rev Med Pharmacol Sci. 2017;21:3850–3856. [PubMed] [Google Scholar]
- 34.Mao J, Liang Z, Zhang B, Yang H, Li X, Fu H, Zhang X, Yan Y, Xu W, Qian H. UBR2 enriched in p53 deficient mouse bone marrow mesenchymal stem cell-exosome promoted gastric cancer progression via wnt/beta-catenin pathway. Stem Cells. 2017;35:2267–2279. doi: 10.1002/stem.2702. [DOI] [PubMed] [Google Scholar]
- 35.Chen D, Lin X, Zhang C, Liu Z, Chen Z, Li Z, Wang J, Li B, Hu Y, Dong B, Shen L, Ji J, Gao J, Zhang X. Dual PI3K/mTOR inhibitor BEZ235 as a promising therapeutic strategy against paclitaxel-resistant gastric cancer via targeting PI3K/Akt/mTOR pathway. Cell Death Dis. 2018;9:123. doi: 10.1038/s41419-017-0132-2. [DOI] [PMC free article] [PubMed] [Google Scholar]
- 36.Ma NX, Sun W, Wu J, Liu SL, Weng L, Liu YQ, Pu WX, Wu TT, Ding XL, Huang NG, Zheng PQ, Zou X. Compound Wumei powder inhibits the invasion and metastasis of gastric cancer via Cox-2/PGE2-PI3K/AKT/GSK3beta/beta-catenin signaling pathway. Evid Based Complement Alternat Med. 2017;2017:3039450. doi: 10.1155/2017/3039450. [DOI] [PMC free article] [PubMed] [Google Scholar]
- 37.Jin GH, Xu W, Shi Y, Wang LB. Celecoxib exhibits an anti-gastric cancer effect by targeting focal adhesion and leukocyte transendothelial migration-associated genes. Oncol Lett. 2016;12:2345–2350. doi: 10.3892/ol.2016.4976. [DOI] [PMC free article] [PubMed] [Google Scholar]
- 38.Feng R, Yang S. Effects of combining erlotinib and RNA-interfered downregulation of focal adhesion kinase expression on gastric cancer. J Int Med Res. 2016;44:855–864. doi: 10.1177/0300060516647550. [DOI] [PMC free article] [PubMed] [Google Scholar]