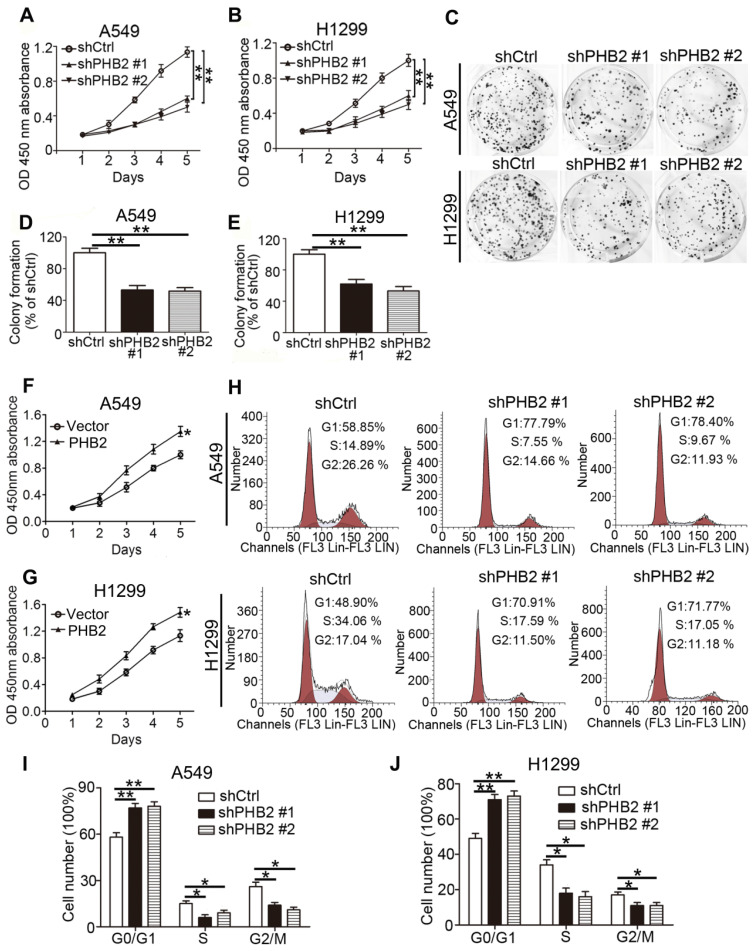
Figure 2.
Effects of PHB2 knockdown and overexpression on proliferation of NSCLC cells. (A)-(B) Time-dependent cell viability of NSCLC cells with stable PHB2 knockdown measured by CCK-8 assay. (C)-(E) Representative images and quantitation of colony formation of NSCLC cells with stable PHB2 knockdown. (F)-(G) Time-dependent cell viability of NSCLC cells with stable PHB2 overexpression measured by CCK-8 assay. (H)-(J) Representative flow cytometry plots of cell cycle distribution and the percentage of cells in each phase for NSCLC cells with stable PHB2 knockdown. These tests were repeated three times independently. Data are presented as mean ± SEM. *P < 0.05; **P < 0.01. Abbreviations: OD, optical density.

