

Abstract
Background
Current tests for diagnosis and differentiation of lymphoplasmacytic enteritis (LPE) and small cell lymphoma (SCL) in cats are expensive, invasive, and lack specificity. The identification of less invasive, more reliable biomarkers would facilitate diagnosis.
Objectives
To characterize the mucosal proteome in endoscopically obtained, small intestinal tissue biopsy specimens. We hypothesized that differentially expressed proteins could be identified and serve as biomarker candidates for the differentiation of LPE and SCL in cats.
Animals
Six healthy control cats, 6 cats with LPE, and 8 cats with SCL.
Methods
The mucosal proteome was analyzed using 2‐dimensional fluorescence difference gel electrophoresis (2D DIGE) and nanoflow liquid chromatography tandem mass spectrometry. For 5 proteins, results were verified by Western blot analysis.
Results
A total of 2349 spots were identified, of which 9 were differentially expressed with a ≥2‐fold change between healthy cats and cats with LPE and SCL (.01 < P < .001). Eight of these 9 spots were also differentially expressed between cats with LPE and cats with SCL (P .001 < P < .04). However, Western blot analysis for malate dehydrogenase‐1, malate dehydrogenase‐2, apolipoprotein, annexin IV, and annexin V did not confirm significant differential protein expression for any of the 5 proteins assessed.
Conclusions and Clinical Importance
Two‐D DIGE did not identify potential biomarker candidates in the intestinal mucosa of cats with LPE and SCL. Future studies should focus on different techniques to identify biomarker candidates for cats with chronic enteropathies (CE).
Keywords: EATL, enteropathy‐associated T‐cell lymphoma, feline chronic enteropathy
Abbreviations
- 2D DIGE
2‐dimensional fluorescence difference gel electrophoresis
- ANOVA
analysis of variance
- ANXA4
annexin IV
- ANXA5
annexin V
- APO
apolipoprotein
- CD
cluster of differentiation
- CE
chronic enteropathy
- fPLI
feline pancreatic lipase immunoreactivity
- fTLI
feline trypsin‐like immunoreactivity
- HRP
horseradish peroxidase
- IPG
immobilized pH gradient
- IS
internal standard
- LPE
lymphoplasmacytic enteritis
- MDH1
malate dehydrogenase‐1
- MDH2
malate dehydrogenase‐2
- NFDM
non‐fat dried milk
- PARR
PCR for antigen receptor rearrangements
- PVDF
polyvinylidene difluoride
- RIPA
radioimmunoprecipitation assay
- SCL
small cell lymphoma
- SDS
sodium dodecyl sulfate
- T‐PBS
tween‐phosphate‐buffered saline
- WB
western blot
- WSAVA
World Small Animal Veterinary Association
1. INTRODUCTION
Chronic enteropathy (CE) in cats is a spontaneous disorder that is especially common in older cats. It is defined as the presence of clinical signs of gastrointestinal disease for >3 weeks in the absence of extraintestinal causes or infectious, obstructive, or localized neoplastic intestinal diseases. 1 , 2 The most common causes of CE in cats are lymphoplasmacytic enteritis (LPE) and alimentary small cell lymphoma (SCL). 3 , 4 , 5 , 6 However, clinical signs are nonspecific, and diagnosis and differentiation require histopathological examination of tissue biopsy specimens. Ambiguous cases frequently occur and require additional diagnostic testing such as immunohistochemistry 7 and clonality testing. 4 , 5 , 8 However, previous studies in humans found specificity as low as 54.3% for clonality testing. 9 Recent studies in cats have shown specificity to be of equal concern in samples from cats with a high rate of false‐positive samples and reported specificity of 33%. 10 , 11 Therefore, identification of less invasive and more reliable biomarkers for the diagnosis and differentiation of CE in cats would facilitate diagnosis.
In 2001, the Biomarkers Definitions Working Group defined a biomarker as a characteristic that is objectively measured and evaluated as an indicator of normal biological processes, pathogenic processes, or pharmacologic responses to a therapeutic intervention. 12 In inflammatory or neoplastic conditions, biomarkers commonly are released by affected cells or in response to tissue dysfunction. 13 Biomarkers can be classified into proteins, small molecule metabolites, nucleotides, and lipids. 13 The proteome describes the entire set of proteins of a cell, tissue, or organism. 14 Proteomics is the analysis of the proteome at a specific time point. 15 The proteome can be studied using a variety of different techniques, including gel‐based techniques such as 2‐dimensional fluorescence difference gel electrophoresis (2D DIGE). 16
Two‐dimensional DIGE compares multiple proteomes after differentially labeling the proteomes with fluorescent dyes 17 and separating the proteins based on their mass and charge, to produce a 2‐dimensional protein spot map. 17 Changes in spot intensities represent changes in protein abundance among different conditions and can be used to identify biomarker candidates. 12
In this prospective study, we characterized the small intestinal mucosal proteome of cats with LPE and SCL by an untargeted proteomics approach using 2D DIGE. Results were compared to results from a group of healthy control cats with demographic characteristics similar to those reported for cats with CE. A subset of the identified proteins was validated by Western blot analysis. We hypothesized that protein abundances would differ among these 3 groups and that 2D DIGE would identify biomarker candidates for the differentiation of LPE from SCL in cats in accordance with Western blot analysis.
2. MATERIALS AND METHODS
2.1. Study approval and enrollment
This prospective study was conducted at the Veterinary Medical Teaching Hospital of Texas A&M University between May 2015 and September 2017. Study protocols were approved by the Texas A&M University Institutional Animal Care and Use Committee (IACUC 2014‐0369 CA and IACUC 2015‐0276 CA). All experiments were performed in accordance with relevant guidelines and regulations. Cat owners provided written informed consent before study enrollment.
2.2. Patients and procedures
Cats with clinical signs of CE (total n = 14 consisting of 6 LPE and 8 SCL cats) and control cats (n = 6) were recruited from the hospital population at the Small Animal Hospital of Texas A&M University, College Station, Texas, or the Veterinary Specialty Hospital, San Diego, California. Cats with clinical signs of CE (eg, weight loss, hyporexia, vomiting, diarrhea) of at least 3 weeks' duration were eligible for enrollment. Cats that had received corticosteroids within 4 weeks before biopsy were excluded from the study. Cats in this group underwent gastro‐duodenoscopy and in some cases ileo‐colonoscopy for diagnostic purposes.
Besides diagnostic biopsy specimens, 6 additional biopsy specimens were acquired endoscopically from the upper small intestinal tract, individually collected into prechilled tubes, and immediately snap‐frozen in a methanol‐dry ice bath. Equipment, operator, and sampling site within the upper small intestine were not standardized. Samples collected at the Veterinary Specialty Hospital, San Diego, were kept on dry ice and shipped overnight to the Texas A&M Gastrointestinal Laboratory and immediately stored at −80°C upon arrival. Samples collected at the Veterinary Medical Teaching Hospital were transferred to the Texas A&M Gastrointestinal Laboratory and immediately stored at −80°C until 2D DIGE analysis.
Clinically healthy, adult, client‐owned cats ≥3 years of age, undergoing an elective procedure requiring general anesthesia, were eligible for enrollment into the study. Cases classified as healthy controls were part of a previously published project on results of histopathology, immunohistochemistry, and molecular clonality testing of small intestinal biopsy specimens from clinically healthy client‐owned cats. 10 Cats were deemed healthy based on a client questionnaire, physical examination, and laboratory testing including CBC, serum biochemistry profile, serum total T4 concentration, and serum concentrations of cobalamin, folate, feline pancreatic lipase immunoreactivity (fPLI), and feline trypsin‐like immunoreactivity (fTLI). Cats with gastrointestinal signs (eg, weight loss, hyporexia, vomiting >2x/month, diarrhea) within 6 months before enrollment were excluded from the study. Cats that had received any antibiotics, antacids, anti‐inflammatory drugs, or corticosteroids within the past 6 months also were excluded from the study. After a routine dental procedure under general anesthesia, all cats underwent gastroduodenoscopy. Six biopsy specimens each from the upper small intestinal tract were collected for histopathologic examination, immunohistochemistry, and clonality testing. An additional 6 biopsy specimens were collected from the small intestinal tract as described above and immediately stored at −80°C until 2D DIGE analysis. Clinically healthy controls were followed over time to ensure absence of subclinical CE. 10
2.3. Histopathology, immunohistochemistry, and clonality analysis
Histopathologic examination of H&E‐stained endoscopic formalin‐fixed, paraffin‐embedded (FFPE) tissue sections was performed by a single board‐certified pathologist (MA) blinded to the clinical status of the cats. Samples were assessed using standards published by the World Small Animal Veterinary Association (WSAVA) Gastrointestinal Standardization Group. 18 , 19 Samples of the upper and lower small intestinal tract of cats with FCE and samples from the upper small intestinal tract from healthy cats underwent immunohistochemistry and PCR for antigen receptor rearrangements (PARR). A final diagnosis of LPE or SCL was reached upon integration of results from histopathology, immunohistochemistry, and PARR as recommended by the EuroClonality/BIOMED‐2 guidelines for interpretation and reporting of Ig/TCR clonality testing in suspected lymphoproliferations. 20 , 21 , 22 Only FCE cases with consistent results among histopathology, immunohistochemistry, and clonality testing were enrolled into the study. Cases with inconsistent results (i.e., histopathology indicative of inflammation with clonal rearrangements or vice versa) were excluded. In addition, all cases categorized as LPE had to have biopsy results from the stomach, upper, and lower small intestinal tract, and the colon available that showed no evidence for small cell lymphoma in any of these locations.
2.4. Protein processing and labeling
Endoscopically acquired, snap frozen duodenal specimens from each cat were pooled, placed in a precooled 1.5 mL glass pestle and tube tissue grinder and homogenized on ice in 10 mM Tris‐HCl/1% Pierce CHAPS (Thermo Fisher Scientific, Waltham, Massachusetts) buffer containing DNAse (Sigma Aldrich, St. Louis, Missouri) and protease inhibitors (Roche/Sigma Aldrich, St. Louis, Missouri). The homogenate was sonicated in ice water for 15 minutes and centrifuged at 15000g for 15 min at room temperature. The supernatant proteome was precipitated using a methanol chloroform method and dissolved in 100 μL of DIGE labeling buffer (30 mM Tris, 7 M urea, 2 M Thiourea, 4% Pierce CHAPS, pH 8.5 buffer). 23 The protein concentration of each protein extract was determined by the Bradford protein assay using bovine serum albumin as a standard. 24
2.5. 2‐Dimensional fluorescence difference gel electrophoresis
Fifty micrograms of protein extracts from the 3 groups were fluorescently labeled with 200 pmol of either Cy 2 or Cy 5 (CyDye DIGE Fluors, GE Healthcare). A pooled internal standard (IS) containing equal parts of all samples was labeled with Cy3. All labeling reactions were carried out for 30 minutes at 4°C in the dark and subsequently quenched by the addition of 1 μL of 10 mM lysine (Sigma Aldrich, St. Louis, Missouri) for 10 minutes.
Samples for isoelectric focusing were prepared by mixing the differently labeled proteomes from 2 different groups (ie, healthy, LPE, or SCL) and an equal portion of the labeled IS. The combined samples were diluted to 450 μL with a buffer containing 7 M urea, 2 M thiourea, 4% Pierce CHAPS, 0.5% Pharmalyte (GE Healthcare, Chicago, Illinois), 40 mM dithiothreitol (DTT), and 0.002% bromophenol blue and used to rehydrate IPG DryStrips (24 cm; pH 3‐10NL; GE Healthcare, Chicago, Illinois) overnight. Isoelectric focusing was performed on an IPG Phor 2 horizontal electrophoresis system (GE Healthcare, Chicago, IL, USA) at 4°C (0.5 kV for 1 hour, ramping to 1 kV over 1 hour, ramping to 8 kV over 2.5 hours, holding at 8 kV until 110 kV*h were achieved). After focusing, each strip was equilibrated in 2 steps: 15 minutes in buffer (6 M urea, 50 mM Tris‐HCl, pH 8.8 with 30% [v/v] glycerol, 2% [w/v] sodium dodecyl sulfate (SDS), 0.01 bromophenol) containing DTT (10 mg/mL) followed by 15 minutes in the same buffer containing iodoacetamide (25 mg/mL). The equilibrated immobilized pH gradient (IPG) strips were affixed to 12% SDS gels and sealed with an agarose sealing solution (25 mM Tris, 192 mM, glycine, 0.1% SDS, 0.5% [w/v] agarose, and 0.02% bromophenol blue). Electrophoresis was performed on an Ettan Dalt‐6 (GE Healthcare, Chicago, Illinois) at 1 W per gel (10°C) until the dye front reached the bottom of the gel.
2.6. Image acquisition and analysis
Gels were scanned at 3 wavelengths (473 nm for Cy2, 532 nm for Cy3, 635 nm for Cy5 labeled samples) using a Typhoon FLA 9500 laser scanner (GE Healthcare) at 100 μm resolution and analyzed using ImageQuant (GE Healthcare) software. All gels were fixed overnight in 10% methanol and 7.5% acetic acid until spot picking.
Multiplex gel images were alalyzed using the DeCyder 2‐D Differential Analysis Software (v 6.5 GE Healthcare), which consists of the following automated steps: spot detection, background subtraction, in‐gel normalization, gel artifact removal, gel‐to‐gel spot matching, and statistical analysis. Automated spot detection was verified by manual editing. Each spot on a gel contains proteins from 2 of the 3 groups (normal or SCL or LPE) and the IS, which are distinguished by their fluorescent signatures (dyes). The signal from each dye‐labeled group is used to calculate an average pixel intensity of that dye in the spot, which is used to compare the fluorescent intensity to the same spot (as matched by the software) on all gels after normalization against the fluorescent intensity of the IS, which is common to all gels in the analysis. DeCyder compares the normalized intensities of all spots among groups and reports differences as a fold‐change, which is correlated to the amount of protein (or proteins) within that spot relative to a particular group. Statistical significance of the change is obtained by analyzing biological replicates for all conditions. 25 , 26
2.7. Spot picking and protein processing
Spots of interest (positive or negative fold change) were excised from the fixed gels using an Ettan Spot Handling Workstations (GE Healthcare, Chicago, Illinois) and in‐gel protein digestion was performed using recombinant porcine trypsin (Promega, Madison, Wisconsin). Tryptic peptides were extracted and later concentrated by SpeedVac (Thermo Fisher Scientific, Waltham, Massachusetts). Peptides were analyzed by nanoflow liquid chromatography tandem mass spectrometry, with proteins identified using the MASCOT search engine (v2.2). The feline genome (UniProt) was searched using the following parameters for protein identification: (a) 1 missed cleavage by trypsin; (b) monoisotopic peptide masses; (c) peptide mass tolerance of 1.2 Da; and (d) fragment mass tolerance of 0.8 Da. Furthermore, oxidation of methionine (variable modification) and carbamidomethylation (fixed modification) of cysteine were taken into consideration by MASCOT in the protein identification. A minimum of 2 matching peptides were required for protein identification. All identifications were verified using Scaffold (Proteome Software, Portland, Oregon).
2.8. Western blotting
The same samples used for 2D DIGE were used for Western blot analysis. Selected proteins identified as potential biomarker candidates by 2D DIGE and nanoflow liquid chromatography tandem mass spectrometry (malate dehydrogenase‐1, MDH 1; malate dehydrogenate‐2, MDH 2; apolipoprotein, APO; annexin IV, ANXA4; annexin V, ANXA5) were validated using standard Western blotting techniques. Protein samples (10 μg per lane) were heated to 65°C for 15 minutes after addition of a reducing Laemmli sample buffer, 27 separated on precast gels (BIO‐RAD, 8‐16% Mini PROTEAN TGX), and transferred to polyvinylidene difluoride (PVDF, Millipore, Burlington, Massachusetts) membranes. The PVDF membranes were blocked in 5% nonfat dried milk (NFDM) 0.1% Tween‐phosphate‐buffered saline (T‐PBS) overnight at 4°C and incubated with primary antibodies diluted in 5% NFDM 0.1% T‐PBS solution overnight at 4°C. Membranes were washed sequentially in 5% NFDM 0.1% T‐PBS (50 mM Tris, 150 mM NaCl, 5 mM EDTA, 0.1% SDS, 0.1% sodium deoxycholate, 1% Tween) and incubated with a horseradish peroxidase (HRP)‐conjugated goat anti‐rabbit secondary antibody (1:20000, Abcam, ab6721, Cambridge, Massachusetts) in 5% NFDM 0.1% T‐PBS for 2 hours at room temperature. The PVDF membranes were washed in 5% NFDM 0.1% T‐PBS and radioimmunoprecipitation assay (RIPA) buffer, incubated with a chemiluminescent substrate (SuperSignal West Pico PLUS, Thermo Fisher Scientific, Waltham, Massachusetts), and the signal was detected using an Amersham Imager 600 (GE Healthcare, Chicago, Illinois). Densitometry was performed using the ImageJ software (NIH, Bethesda, Massachusetts).
The following primary antibodies were used: MDH 1 (1:6000, Abcam, ab180152, Cambridge, Massachusetts), MDH 2 (1:32000, Abcam, ab46193, Cambridge, Massachusetts), apolipoprotein (1:2000, Abcam, ab64308, Cambridge, Massachusetts), annexin IV (1:600, Abcam, ab33009, Cambridge, Massachusetts), annexin V (1:4000, Abcam, ab14196, Cambridge, Massachusetts). Equal protein loading for each sample was confirmed by immunoblotting for beta‐actin (1:20000 for MDH2 and ANXA5; 1:40000 for MDH1; 1:80000 for APO and ANXA4, Abcam, ab6721, Cambridge, Massachusetts) as reference.
2.9. Statistical analysis
Patient demographics were compared using Mann‐Whitney or Fisher's exact tests and Dunn's multiple comparisons test (GraphPad Prism version 7.0 for Mac, GraphPad Software, La Jolla, California). Data analysis for 2D DIGE was performed using the DeCyder 2‐D Differential Analysis Software (v 6.5, GE Healthcare). 25 , 26 Differential expression of normalized protein spot intensities was compared using 1‐way analysis of variance (ANOVA) and post hoc Student's t test. Differences in spot intensities were considered statistically significant at P < .05, with a minimum fold change of ± 2.0. False discovery rate was controlled by application of the Benjamini‐Hochberg procedure at q ≤ 0.05. For Western blot analysis, densitometric ratios were transformed by the following formula to equalize variances among the groups: Log (100 * relative protein abundance ratio of interest). Log‐transformed densitometric values were compared by 1‐way ANOVA and used for post hoc sample size calculation (JMP 15.0, SAS Institute, Cary, North Carolina). Statistical significance was set at P < .05.
3. RESULTS
3.1. Patients and procedures
Six cats classified as healthy controls were enrolled in this study, and samples of the upper small intestinal tract of these individuals served as controls. All cases were reevaluated using an owner questionnaire and were free of clinical signs of FCE for a median of 641 days (range, 342 to 821 days) after endoscopic biopsy collection. One of the cats developed clinical signs of FCE approximately 513 days postendoscopy that were diet responsive, but the cat was clinically normal until that time. 10
Based on integration of results from histopathology, immunohistochemistry, and PARR, 6 cases were classified as LPE and 8 cases as SCL. 20 , 21 , 22 Patient demographics are shown in Table 1. Although no significant age difference was found between healthy cats and cats with LPE or SCL, cats with SCL were significantly older than cats with LPE (P = .008). In addition, cats with LPE (P = .05) had a significantly lower body condition score than did healthy control cats.
TABLE 1.
Demographic characteristics of healthy cats, cats with lymphoplasmacytic enteritis (LPE), and cats with alimentary small cell lymphoma (SCL)
| Healthy | LPE | SCL | P value | Healthy vs LPE | Healthy vs SCL | LPE vs SCL | |
|---|---|---|---|---|---|---|---|
| Number of cats | 6 | 6 | 8 | NA | NA | NA | NA |
| Median age in years (range) | 8 (3–7) | 7 (2–10) | 12 (7‐15) | .00 a | >.99 b | .11 b | .01 b |
| Median BW in kg (range) | 5.04 (4.01‐6.47) | 4.61 (2.49‐4.99) | 4.12 (2.96‐5.24) | .20 a | NA | NA | NA |
| Median BCS (range) | 5 (5‐9) | 4 (3‐5) | 3.5 (2‐6) | .02 a | .05 b | .06 b | >.99 b |
| Sex | 2 FS, 4 MN | 2 FS, 4 MN | 3FS, 5 MN | NA | NA | NA | NA |
| Breeds | 6 DSH | 1 DMH, 2 DLH, 3 DSH | 7 DSH, 1 DLH | NA | NA | NA | NA |
Note: BCS, body condition score: 1‐3: underweight, 4‐5 ideal, 6‐9 overweight.
Kruskal‐Wallis test.
Dunn's multiple comparison test.
3.2. Histopathology, immunohistochemistry, and clonality analysis
The pathologist rated the number and quality of all submitted samples as “good” or “very good.” Cases classified as LPE had samples from the upper and lower small intestinal tract available. All samples had histopathological evidence of LPE with polyclonal rearrangements on clonality testing. Upper small intestinal biopsy specimens classified as SCL had a histopathological diagnosis of SCL, dense CD3+ infiltrates in the epithelium, lamina propria or both, and clonal rearrangements on clonality testing.
Biopsy specimens from clinically healthy control cats had mostly mild histopathologic changes, as previously reported. 10 None of the healthy cats enrolled in the study were found to have clonal rearrangements in samples of the upper small intestinal tract. Supplemental Table 1 provides details for signalment, clinical, ultrasonographic, endoscopic, and histopathologic findings and follow‐up data on the healthy control cats. Supplemental Table 2 provides WSAVA scores for samples of the upper small intestinal tract of all cats enrolled.
3.3. 2‐Dimensional fluorescence difference gel electrophoresis
A total of 2349 matching spots were identified, of which 9 were differentially expressed among all 3 groups (i.e., healthy controls, LPE, SCL; .01 < P < .001; Figure 1; Table 2). Eight of these 9 also were differentially expressed between cats with LPE and cats with SCL (.0015 < P < .04). Spots 1063 and 1065 were immediately adjacent to each other and showed 3.6‐fold and 3.2‐fold increased protein abundance, respectively. Cytosolic and mitochondrial malate dehydrogenases (MDH 1 and 2), Na+/H+ exchange regulatory cofactor NHE‐RF1, and inorganic pyrophosphatase (PPi) were identified by tandem mass spectrometry. Spot 1112 showed a 5.6‐fold increase between healthy cats and cats with SCL and a 3.8‐fold increase between cats with LPE and those with SCL. This spot contained annexin 5, ADP‐sugar pyrophosphatase isoform X1, an adiponectin precursor, and phosphoglycolate phosphatase based on mass spectrometry identification. The sole protein identified in spot 1116 was annexin A4 (ANXA4) with an increased abundance in cats with SCL of 2.3‐fold and 2‐fold compared to healthy cats and cats with LPE, respectively. Spot 1301 was the only 1 of the 9 protein spots that showed decreased abundance when comparing cats with SCL or LPE to healthy cats (−2.1 and −2.4‐fold, respectively). This spot contained apolipoprotein A‐I. A complete list of spot numbers, identified proteins, and fold changes is shown in Table 2.
FIGURE 1.
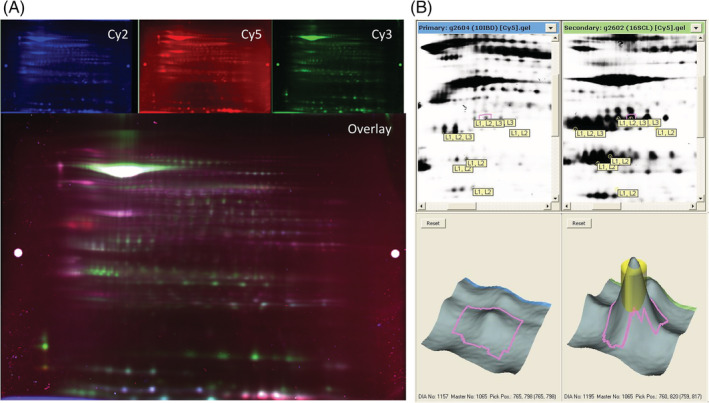
Representative examples of a 2‐dimensional difference in gel electrophoresis (2D‐DIGE) imaged using the ImageQuant software and analyzed by the DeCyder software. A, Representative fluorescent protein profiles of a gel containing protein samples extracted from the small intestinal mucosa of a cat with lymphoplasmacytic enteritis (LPE) labeled with Cy2 (top left), a cat with intestinal small cell lymphoma (SCL) labeled with Cy5 (top middle), a pooled internal control labeled with Cy3 (top right), and the overlay image (bottom) as seen in the ImageQuant software. B. Representative view of gel images uploaded into DeCyder software and analyzed by the Biological Variation Analysis module. Top: black and white images of gels containing protein samples from a cat with LPE (left) and SCL (right). Bottom: Enlarged region and 3‐D view of upregulated spot 1065 within the respective gels. The pink area demarcates the area analyzed by DeCyder for protein spot intensity. The yellow cylinder represents the area that can be picked during spot picking and analyzed by mass spectrometry for protein identification
TABLE 2.
Summary of proteins from differentially expressed spots found on 2‐dimensional fluorescence difference gel electrophoresis and subsequently identified by tandem mass‐spectrometry
| Spot | Identified protein | Biological process according to the Gene Ontology database | Fold ∇ a | Fold ∇ b | Fold ∇ c | # Pep‐tides | ANOVA P value | q value |
|---|---|---|---|---|---|---|---|---|
| 1063 | Inorganic pyrophosphatase | Metabolic processes, negative prognostic indicator for certain cancer types | ns | 4.20 | 3.64 | 8 | .00 | .00 |
| 1063 | Na(+)/H(+) exchange regulatory cofactor NHE‐RF1 | Cytoskeleton, part of Wnt pathway | ns | 4.20 | 3.64 | 10 | .00 | .00 |
| 1063 | Malate dehydrogenase, cytoplasmic | Metabolic processes, supports glycolysis in cancer cells | ns | 4.20 | 3.64 | 3 | .00 | .00 |
| 1063 | Malate dehydrogenase, mitochondrial | Metabolic processes | ns | 4.20 | 3.64 | 2 | .00 | .00 |
| 1065 | Inorganic pyrophosphatase | Metabolic processes, negative prognostic indicator for certain cancer types | ns | 3.55 | 3.21 | 7 | .00 | .00 |
| 1065 | Na(+)/H(+) exchange regulatory cofactor NHE‐RF1 | Cytoskeleton, part of Wnt pathway | ns | 3.55 | 3.21 | 8 | .00 | .00 |
| 1065 | Malate dehydrogenase, cytoplasmic | Metabolic processes, supports glycolysis in cancer cells | ns | 3.55 | 3.21 | 4 | .00 | .00 |
| 1065 | Malate dehydrogenase, mitochondrial | Metabolic processes | ns | 3.55 | 3.21 | 2 | .00 | .00 |
| 1112 | Annexin A5 | Negative regulation of apoptotic processes | ns | 5.59 | 3.84 | 17 | .00 | .01 |
| 1112 | ADP‐sugar pyrophosphatase isoform X1 | Energy metabolism | ns | 5.59 | 3.84 | 3 | .00 | .01 |
| 1112 | Adiponectin precursor | Adiponectin: control of lipid metabolism and insulin‐sensitivity, anti‐inflammatory | ns | 5.59 | 3.84 | 3 | .00 | .01 |
| 1112 | Phosphoglycolate phosphatase | Metabolic processes | ns | 5.59 | 3.84 | 2 | .00 | .01 |
| 1116 | Annexin A4 | Membrane‐fusion, Exocytosis, de‐regulated in a variety of cancers | ns | 2.25 | 1.99 | 18 | .01 | .01 |
| 1202 | Rho GDP‐dissociation inhibitor 1 | Control Rho proteins involved in cell polarity, migration and division, associated with metastasis and resistance to drug‐induced apoptosis | ns | 3.25 | 3.58 | 7 | .01 | .01 |
| 1202 | Endoplasmic reticulum resident protein 29 | Protein processing within the endoplasmic reticulum | ns | 3.25 | 3.58 | 4 | .01 | .01 |
| 1216 | Rho GDP‐dissociation inhibitor 1 | Control Rho proteins involved in cell polarity, migration and division, associated with metastasis and resistance to drug‐induced apoptosis | ns | 6.30 | 5.48 | 12 | .00 | .00 |
| 1216 | Rho GDP‐dissociation inhibitor 2 | Cytoskeleton | ns | 6.30 | 5.48 | 5 | .00 | .00 |
| 1216 | Endoplasmic reticulum resident protein 29 | Protein processing within the endoplasmic reticulum | ns | 6.30 | 5.48 | 7 | .00 | .00 |
| 1301 | Apolipoprotein A‐I | HDL assembly and reverse transport of cholesterol to the liver, protective role in cancer development | −2.08 | −2.40 | ns | 5 | .00 | .01 |
| 1575 | Nucleoside diphosphate kinase B | Metabolic processes | ns | 2.56 | 2.66 | 4 | .00 | .01 |
| 1577 | Nucleoside diphosphate kinase B | Metabolic processes | ns | 2.72 | 2.63 | 5 | .00 | .01 |
Note: ns, not significant. Fold changes are given for proteins considered statistically significant by DeCyder software criteria, that is, statistically significant at P ≤ .05, with a minimum fold change of ± 2.0.
Fold change LPE vs healthy, P = .004.
Fold change SCL vs healthy 0.001 < P < .02.
Fold change SCL vs LPE 0.0015 < P < .04.
3.4. Western blotting
Five proteins were selected for Western blot analysis based on their origin species (Felis catus), number of identified peptides, and biological functions: malate dehydrogenase‐1 (MDH 1), malate dehydrogenase‐2 (MDH 2), apolipoprotein (APO), annexin IV (ANXA4), and annexin V (ANXA5). Because of to the limited quantity of available protein extract, not all samples and not all proteins were used for Western blot analysis. The selected proteins were assessed for their contribution to the altered relative abundance in the small intestinal proteome of cats with LPE (n = 5), and SCL (n = 4, except for APO and ANXA4 for which n = 5, and ANXA5 for which n = 3) compared with healthy controls (n = 5; Table 3).
TABLE 3.
Western blot results for malate dehydrogenase 1 (MDH1), malate dehydrogenase 2 (MDH2), apolipoprotein (APO), annexin IV (ANXA4), and annexin V (ANXA5) in small intestinal biopsies of cats with lymphoplasmacytic enteritis (LPE; n = 5), and small cell lymphoma (SCL; n = 3, 4, or 5 depending on the protein) compared to healthy control cats (Healthy; n = 5)

|
Comparison of the relative mean densitometric values showed no significant differences for any of the proteins interrogated by Western blot analysis: MDH 1 (P = .31), MDH 2 (P = .65), ANXA4 (P = .51), ANXA5 (P = .20), and APO (P = .06). Annexin A4 was not observed during Western blot analysis for some cats in each group (Table 3).
4. DISCUSSION
In this prospective study, we compared the mucosal proteomes of cats with LPE and cats with SCL to those of healthy control cats using 2‐D DIGE and nanoflow liquid chromatography tandem mass spectrometry. Differential expression of selected proteins was assessed by Western blot analysis for the purposes of validation.
Discovery proteomics approaches have been utilized previously to identify unknown biomarkers for a variety of different diseases and conditions. 28 However, because protein biomarkers are commonly scarce and untargeted proteomics experiments are “fishing expeditions,” proteomic approaches commonly suffer from data noise that can overwhelm the signal. 28 One approach to overcome this dilemma is to investigate the proteome in the affected tissue first, hypothesizing that the abundance of an unknown protein biomarker should be highest in the affected tissue. 29 Once a biomarker candidate has been identified, targeted approaches can be applied to other, less‐invasively obtainable samples such as biofluids, and can identify even low abundance proteins with high sensitivity. 29
Two‐dimensional DIGE has been used as a strategy for biomarker discovery in various diseases in humans including inflammatory bowel disease, 30 colon cancer, 31 and lymphoma. 32
Proteins from different sources such as from a control group and a diseased group are covalently labeled with different color fluorescent dyes. 33 Labeled protein lysates are mixed and separated by their isoelectric points in the first dimension followed by separation by their mass in the second dimension of electrophoresis, leading to an array of protein spots. Gels are scanned using different wavelength lasers. 17 , 33 The fluorescent dyes tagged to the proteins excite and emit the laser light at different wavelengths and thus can project different images of the same gel. 17 , 33 Digital images are collected and overlaid and spot intensities compared among different protein samples. To overcome intergel variations, an IS is included in each gel. 26 The IS consists of a pool of all samples analyzed within 1 experiment and thus allows for normalization. 26 Protein spot intensities are measured relative to the IS, which is the same in every gel, thus decreasing between‐gel variability. 26 Differentially expressed protein spots represent potential biomarker candidates. 12 Selected spots subsequently can be excised and analyzed by tandem mass spectrometry to identify the proteins within the spots. 17 , 33
Major advantages of 2D DIGE are the broad range of proteins that can be analyzed at once as well as the simultaneous comparison of different samples within the same gel or within the same experiment. 17 , 33 This decreases between‐gel variability, eliminates the need for technical replicates, and improves the precision of protein quantification. 34 The main disadvantage is the inherently low throughput with typical 2D DIGE platforms holding a maximum of either 6 or 12 gels only, 35 making 2D DIGE a time‐ and resource‐consuming technique and the comparison of different experiments in 2D DIGE challenging. In addition, proteins with similar mass and charge may be captured in the same spot, dependent on gel size and resulting resolution. 17 , 33 , 34 As with all untargeted experiments, results of 2D DIGE must be verified by a second targeted method such as Western blotting. 17
To our knowledge, ours is the first study characterizing the mucosal proteome in clinically healthy, client‐owned cats, cats with LPE, and cats with SCL. This 2D DIGE‐based approach identified 9 differentially expressed protein spots among the 3 groups, of which 8 also were differentially expressed in the small intestinal mucosa of cats with LPE compared to cats with SCL, with a minimum fold change of 200% (absolute 2.0‐fold change). Within these spots, 14 proteins warranting further investigations as potential biomarkers for CE in cats were identified using mass spectrometry (Table 2).
Several of these proteins previously have been found to be involved in inflammatory or neoplastic processes, whereas others do not appear to have recognized affiliations with a pathologic condition. However, the same protein may have a variety of different biological or pathological functions depending on location, time of translation from RNA, posttranslational modifications, or accumulation in tissue. In addition, many biological functions are still to be elucidated. Therefore, lack of an apparent inflammatory or cancer‐related pathway does not necessary exclude a protein's value as a potential biomarker.
Because of limited sample quantity, we were unable to verify all proteins identified during 2D DIGE by Western blot analysis. The 5 proteins MDH1, MDH2, ANXA4, ANXA 5, and APO found in 5 different spots during 2D DIGE were interrogated by Western blot analysis. Of those, none were confirmed to be differentially expressed between groups.
Proteins found by 2D DIGE but not included in our Western blot verification included Na+/H+ exchange regulatory cofactor NHE‐RF1 (scaffold protein potentially enhancing the Wnt pathway), endoplasmic reticulum protein 29 (endoplasmic reticulum secretion factor, upregulated in various cancers 36 ), and inorganic pyrophosphatase (PPi; various metabolic processes involving phosphate‐dependent second messenger systems). All of these proteins are involved in ubiquitous and critical metabolic pathways, and differential protein expression has been described in different types of cancer in humans such as breast cancer, 37 , 38 , 39 lung cancer, 40 ovarian cancer, 41 hepatocellular carcinoma, 42 and colorectal cancer. 43
However, differential expression of the above‐mentioned proteins was not verified by Western blot analysis and therefore their promise as biomarker candidates is uncertain.
Our study had several limitations. Results of 2D DIGE and tandem mass spectrometry for MDH1, MDH2, ANXA4, ANXA5, and APO were not confirmed by Western blot analysis, likely because the study was underpowered. A post hoc sample size calculation based on the densitometric Western blot data showed that between 22 and 152 cases per experimental group would have been necessary to achieve 80% power. Small sample size is a limiting factor in many proteomics experiments in general and in gel‐based experiments in particular. Ours, and most other commercially available gel systems, allow for a maximum of 12 gels to be run in parallel. 35 However, doing so would require multiple experiments, increasing technical variability and data noise. A better option for future experiments would be to use larger scale high throughput techniques such as mass spectrometry‐based methods or protein microarray technology. 44 Furthermore, Western blotting and densitometry are known to have limited sensitivity for detecting small changes, 45 , 46 and housekeeping proteins in Western blotting have been described to potentially vary between healthy and diseased states. 47 The previously mentioned small sample size together with the technical limitations of these techniques could have contributed to the observed results based on immunoblotting.
Because of limited sample availability, we were unable to verify all proteins using Western blot analysis. Our samples were obtained from client‐owned cats with spontaneous CE or from client‐owned healthy animals. Therefore, we were faced with limitations with regard to collection of endoscopic biopsy specimens and the risks and benefits associated with such a procedure. Moreover, although 2D DIGE has a relatively high resolution, proteins of similar mass and charge often can be found in the same protein spot (Table 2). In our study, up to 4 different proteins were found in 1 protein spot. Therefore, it is possible that proteins not interrogated by Western blot analysis were responsible for the identified differences in spot intensities.
We used client‐owned cats either presented for signs of CE (i.e., LPE and SCL groups) or as a part of a regular health evaluation (i.e., healthy control cats). Therefore, factors such as genetics and environment were not controlled and likely increased biological variability. To minimize biological variability (and thus data noise) as much as possible, we included only cats that were categorized as healthy or as having LPE or SCL based on current EuroClonality/BIOMED‐2 guidelines for interpretation and reporting of Ig/TCR clonality testing in suspected lymphoproliferations. 21 , 22 , 48 Only cases with consistent results among histopathology, immunohistochemistry and clonality testing were enrolled, whereas cases that showed inconsistent results among tests were excluded from the study. However, controlling for all other factors such as breed, housing or diet would have made our study clinically irrelevant. Cats in the healthy control group did show mostly mild histopathologic changes in the upper small intestinal mucosa, as previously reported. 10 However, our results indicated that histopathological changes and clonality results were not predictive for the development of clinical disease. 10 Moreover, studies by other groups also found poor correlation between intestinal ultrasonographic findings and health status 49 or histopathologic changes. 50 Overdiagnosis, overtreatment and false positive results have become major concerns in human medicine and led to several statements and guidelines issued by the U.S. Preventive Services Task Force, 51 National Comprehensive Cancer Network 52 and the EuroClonality/BIOMED‐2 consortium. 21 , 22 , 48 Overdiagnosis is defined as identification of an abnormality where detection will not benefit the patient and is present when increased disease incidence coincides with unchanged morbidity and mortality (i.e., outcome). 53 Overdiagnosis will lead to overtreatment with potential harmful consequences to the patient. 54 , 55 Control cats in our study were free of clinical signs at least 6 months before and 342 days after enrollment, histopathologic changes were mostly minimal or mild, and results of clonality analysis all were reported as polyclonal (Supplemental Table 1). Therefore, we believe that our control group can be considered healthy and, in conjunction with demographic characteristics similar to the FCE group, it was appropriate to answer the research question. Although the presence of histopathologic abnormalities in the clinically healthy control group may explain the lack of differentially expressed proteins in the intestinal mucosa, our study aimed to identify clinically applicable biomarkers. Including only cats with normal histopathology would bias the results and is unlikely useful as a diagnostic marker in the clinical setting. Lastly, the sampling site and endoscopic equipment used for intestinal biopsies was not standardized, and samples likely included duodenal and jejunal tissue. Although we cannot exclude that this may have led to failure to identify biomarkers in the mucosa, biomarker identification aims to develop minimally invasive biomarkers that can be measured in media such as serum or urine. If a biomarker cannot be identified in the affected homogenized tissue, it is unlikely to be present in meaningful quantities in other tissue or body fluids.
Finally, it has been hypothesized that LPE and SCL in cats may not be 2 distinct disease processes but rather represent a continuum of the same disease. 4 , 5 , 8 In addition, alimentary SCL in cats often is accompanied by inflammatory lesions. 5 Therefore, a molecular biomarker that reliably differentiates between the 2 may not be present. However, a recent study published by our group using histology‐guided mass spectrometry found distinct molecular fingerprints within the mucosa of cats with LPE and SCL that could differentiate between LPE and SCL with a sensitivity of 87% and specificity of 92%. 11
In conclusion, we were unable to identify a biomarker candidate for the differentiation of LPE from SCL in cats using 2D DIGE and Western blot verification. Future experiments should focus on use of different techniques such as mass spectrometry‐based methods or protein microarray technology for the identification of protein biomarker candidates in cats with CE. Our study also may serve as a benchmark for sample size and power calculations for future proteomics studies in cats.
5. CONFLICT OF INTEREST DECLARATION
At the time of the study, authors Marsilio, Dröes, Lidbury, Suchodolski, and Steiner are or were employed by the Gastrointestinal Laboratory at Texas A&M University, which offers laboratory testing, including histopathology services, on a fee‐for‐service basis. The author Dangott is an employee of the Protein Chemistry Laboratory at Texas A&M, which offers laboratory testing, including 2D DIGE, on a fee‐for‐service basis. The author Ackermann is affiliated with the Gastrointestinal Laboratory at Texas A&M University. The author Estep is employed by Texas Veterinary Pathology, LLC, which offers histopathology for animals on a fee‐for‐service basis. The authors Chow and Hill have nothing to disclose.
OFF‐LABEL ANTIMICROBIAL DECLARATION
Authors declare no off‐label use of antimicrobials.
INSTITUTIONAL ANIMAL CARE AND USE COMMITTEE (IACUC) OR OTHER APPROVAL DECLARATION
Approved by the Texas A&M University Animal Care and Use Committee (IACUC 2014‐0369 CA and IACUC 2015‐0276 CA).
HUMAN ETHICS APPROVAL DECLARATION
Authors declare human ethics approval was not needed for this study.
REFERENCES
- 1. Jergens AE, Schreiner CA, Frank DE, et al. A scoring index for disease activity in canine inflammatory bowel disease. J Vet Intern Med. 2003;17:291‐297. [DOI] [PubMed] [Google Scholar]
- 2. Simpson KW, Jergens AE. Pitfalls and progress in the diagnosis and management of canine inflammatory bowel disease. Vet Clin North Am Small Anim Pract. 2011;41:381‐398. [DOI] [PubMed] [Google Scholar]
- 3. Jergens AE. Feline idiopathic inflammatory bowel disease: what we know and what remains to be unraveled. J Feline Med Surg. 2012;14:445‐458. [DOI] [PMC free article] [PubMed] [Google Scholar]
- 4. Sabattini S, Bottero E, Turba ME, Vicchi F, Bo S, Bettini G. Differentiating feline inflammatory bowel disease from alimentary lymphoma in duodenal endoscopic biopsies. J Small Anim Pract. 2016;57:396‐401. [DOI] [PubMed] [Google Scholar]
- 5. Moore PF, Rodriguez‐Bertos A, Kass PH. Feline gastrointestinal lymphoma: mucosal architecture, immunophenotype, and molecular clonality. Vet Pathol. 2012;49:658‐668. [DOI] [PubMed] [Google Scholar]
- 6. Kiupel M, Smedley RC, Pfent C, et al. Diagnostic algorithm to differentiate lymphoma from inflammation in feline small intestinal biopsy samples. Vet Pathol. 2011;48:212‐222. [DOI] [PubMed] [Google Scholar]
- 7. Paulin MV, Couronne L, Beguin J, et al. Feline low‐grade alimentary lymphoma: an emerging entity and a potential animal model for human disease. BMC Vet Res. 2018;14:306. [DOI] [PMC free article] [PubMed] [Google Scholar]
- 8. Moore PF, Woo JC, Vernau W, Kosten S, Graham PS. Characterization of feline T cell receptor gamma (TCRG) variable region genes for the molecular diagnosis of feline intestinal T cell lymphoma. Vet Immunol Immunopathol. 2005;106:167‐178. [DOI] [PubMed] [Google Scholar]
- 9. Kokovic I, Novakovic BJ, Cerkovnik P, et al. Clonality analysis of lymphoid proliferations using the BIOMED‐2 clonality assays: a single institution experience. Radiol Oncol. 2014;48:155‐162. [DOI] [PMC free article] [PubMed] [Google Scholar]
- 10. Marsilio S, Ackermann MR, Lidbury JA, Suchodolski JS, Steiner JM. Results of histopathology, immunohistochemistry, and molecular clonality testing of small intestinal biopsy specimens from clinically healthy client‐owned cats. J Vet Intern Med. 2019;33:551‐558. [DOI] [PMC free article] [PubMed] [Google Scholar]
- 11. Marsilio S, Newman SJ, Estep JS, et al. Differentiation of lymphocytic‐plasmacytic enteropathy and small cell lymphoma in cats using histology‐guided mass spectrometry. J Vet Intern Med. 2020;34:669‐677. [DOI] [PMC free article] [PubMed] [Google Scholar]
- 12. Group BDW . Biomarkers and surrogate endpoints: preferred definitions and conceptual framework. Clin Pharmacol Ther. 2001;69:89‐95. [DOI] [PubMed] [Google Scholar]
- 13. Srivastava A, Creek DJ. Discovery and Validation of Clinical Biomarkers of Cancer: A Review Combining Metabolomics and Proteomics. PROTEOMICS. 2019;19(10):1700448 10.1002/pmic.201700448. [DOI] [PubMed] [Google Scholar]
- 14. Wasinger VC, Cordwell SJ, Cerpa‐Poljak A, et al. Progress with gene‐product mapping of the Mollicutes: mycoplasma genitalium. Electrophoresis. 1995;16:1090‐1094. [DOI] [PubMed] [Google Scholar]
- 15. Clark DP, Pazdernik NJ. Molecular Biology, Chapter e15 Proteomics: The Global Analysis of Proteins. 2nd ed. New York, NY, USA: Elsevier; 2013. [Google Scholar]
- 16. Tannu NS, Hemby SE. Two‐dimensional fluorescence difference gel electrophoresis for comparative proteomics profiling. Nat Protoc. 2006;1:1732‐1742. [DOI] [PMC free article] [PubMed] [Google Scholar]
- 17. Minden JS. Chapter 6‐two‐dimensional difference gel electrophoresis (2D DIGE). Methods Cell Biol. 2012;112:111. [DOI] [PubMed] [Google Scholar]
- 18. Day MJ, Bilzer T, Mansell J, et al. Histopathological standards for the diagnosis of gastrointestinal inflammation in endoscopic biopsy samples from the dog and cat: a report from the World Small Animal Veterinary Association Gastrointestinal Standardization Group. J Comp Pathol. 2008;138(Suppl 1):S1‐S43. [DOI] [PubMed] [Google Scholar]
- 19. Washabau RJ, Day MJ, Willard MD, et al. Endoscopic, biopsy, and histopathologic guidelines for the evaluation of gastrointestinal inflammation in companion animals. J Vet Intern Med. 2010;24:10‐26. [DOI] [PubMed] [Google Scholar]
- 20. Keller SM, Vernau W, Moore PF, et al. Clonality testing in veterinary medicine: a review with diagnostic guidelines. Vet Pathol. 2012;49:658‐668. [DOI] [PubMed] [Google Scholar]
- 21. Langerak AW, Groenen PJ, Bruggemann M, et al. EuroClonality/BIOMED‐2 guidelines for interpretation and reporting of Ig/TCR clonality testing in suspected lymphoproliferations. Leukemia. 2012;26:2159‐2171. [DOI] [PMC free article] [PubMed] [Google Scholar]
- 22. van Dongen JJ, Langerak AW, Bruggemann M, et al. Design and standardization of PCR primers and protocols for detection of clonal immunoglobulin and T‐cell receptor gene recombinations in suspect lymphoproliferations: report of the BIOMED‐2 concerted action BMH4‐CT98‐3936. Leukemia. 2003;17:2257‐2317. [DOI] [PubMed] [Google Scholar]
- 23. Wessel D, Flugge UI. A method for the quantitative recovery of protein in dilute solution in the presence of detergents and lipids. Anal Biochem. 1984;138:141‐143. [DOI] [PubMed] [Google Scholar]
- 24. Bradford MM. A rapid and sensitive method for the quantitation of microgram quantities of protein utilizing the principle of protein‐dye binding. Anal Biochem. 1976;72:248‐254. [DOI] [PubMed] [Google Scholar]
- 25. Tonge R, Shaw J, Middleton B, et al. Validation and development of fluorescence two‐dimensional differential gel electrophoresis proteomics. Dent Tech. 2001;1:377‐396. [DOI] [PubMed] [Google Scholar]
- 26. Alban A, David SO, Bjorkesten L, et al. A novel experimental design for comparative two‐dimensional gel analysis: two‐dimensional difference gel electrophoresis incorporating a pooled internal standard. Proteomics. 2003;3:36‐44. [DOI] [PubMed] [Google Scholar]
- 27. Laemmli UK. Cleavage of structural proteins during the assembly of the head of bacteriophage T4. Nature. 1970;227:680‐685. [DOI] [PubMed] [Google Scholar]
- 28. Ning M, Lo EH. Opportunities and challenges in omics. Transl Stroke Res. 2010;1:233‐237. [DOI] [PMC free article] [PubMed] [Google Scholar]
- 29. Prieto DA, Ye XY, Veenstra TD. Proteomic analysis of traumatic brain injury: the search for biomarkers. Expert Rev Proteomic. 2008;5:283‐291. [DOI] [PubMed] [Google Scholar]
- 30. Alex P, Gucek M, Li X. Applications of proteomics in the study of inflammatory bowel diseases: current status and future directions with available technologies. Inflamm Bowel Dis. 2009;15:616‐629. [DOI] [PMC free article] [PubMed] [Google Scholar]
- 31. Friedman DB, Hill S, Keller JW, et al. Proteome analysis of human colon cancer by two‐dimensional difference gel electrophoresis and mass spectrometry. Proteomics. 2004;4:793‐811. [DOI] [PubMed] [Google Scholar]
- 32. Repetto O, Mussolin L, Elia C, et al. Proteomic identification of plasma biomarkers in children and adolescents with recurrent hodgkin lymphoma. J Cancer. 2018;9:4650‐4658. [DOI] [PMC free article] [PubMed] [Google Scholar]
- 33. Timms JF, Cramer R. Difference gel electrophoresis. Proteomics. 2008;8:4886‐4897. [DOI] [PubMed] [Google Scholar]
- 34. Beretov J, Wasinger VC, Graham PH, et al. Proteomics for breast cancer urine biomarkers. Adv Clin Chem. 2014;63:123‐167. [DOI] [PubMed] [Google Scholar]
- 35.User manual vertical electrophoresis, Ettan Daltsix Electrophoresis System, Amersham Bioscience. San Francisco, CA, USA.
- 36. Bambang IF, Xu S, Zhou J, Salto‐Tellez M, Sethi SK, Zhang D. Overexpression of endoplasmic reticulum protein 29 regulates mesenchymal‐epithelial transition and suppresses xenograft tumor growth of invasive breast cancer cells. Lab Invest. 2009;89:1229‐1242. [DOI] [PubMed] [Google Scholar]
- 37. Chahed K, Kabbage M, Ehret‐Sabatier L, et al. Expression of fibrinogen E‐fragment and fibrin E‐fragment is inhibited in the human infiltrating ductal carcinoma of the breast: the two‐dimensional electrophoresis and MALDI‐TOF‐mass spectrometry analyses. Int J Oncol. 2005;27:1425‐1431. [PubMed] [Google Scholar]
- 38. Hamler RL, Zhu K, Buchanani NS, et al. A two‐dimensional liquid‐phase separation method coupled with mass spectrometry for proteomic studies of breast cancer and biomarker identification. Proteomics. 2004;4:562‐577. [DOI] [PubMed] [Google Scholar]
- 39. Mishra DR, Chaudhary S, Krishna BM, Mishra SK. Identification of critical elements for regulation of inorganic pyrophosphatase (PPA1) in MCF7 breast cancer cells. PLos One. 2015;10:e0124864. [DOI] [PMC free article] [PubMed] [Google Scholar]
- 40. Chen GA, Gharib TG, Huang CC, et al. Proteomic analysis of lung adenocarcinoma: identification of a highly expressed set of proteins in tumors. Clin Cancer Res. 2002;8:2298‐2305. [PubMed] [Google Scholar]
- 41. Kachman MT, Wang HX, Schwartz DR, Cho KR, Lubman DM. A 2‐D liquid separations/mass mapping method for interlysate comparison of ovarian cancers. Anal Chem. 2002;74:1779‐1791. [DOI] [PubMed] [Google Scholar]
- 42. Megger DA, Bracht T, Kohl M, et al. Proteomic differences between hepatocellular carcinoma and nontumorous liver tissue investigated by a combined gel‐based and label‐free quantitative proteomics study. Mol Cell Proteomics. 2013;12:2006‐2020. [DOI] [PMC free article] [PubMed] [Google Scholar]
- 43. Tomonaga T, Matsushita K, Yamaguchi S, et al. Identification of altered protein expression and post‐translational modifications in primary colorectal cancer by using agarose two‐dimensional gel electrophoresis. Clin Cancer Res. 2004;10:2007‐2014. [DOI] [PubMed] [Google Scholar]
- 44. Chandramouli K, Qian P‐Y. Proteomics: challenges, techniques and possibilities to overcome biological sample complexity. Human Genomics Proteomics. 2009;1:1‐22. [DOI] [PMC free article] [PubMed] [Google Scholar]
- 45. Ghosh R, Gilda JE, Gomes AV. The necessity of and strategies for improving confidence in the accuracy of western blots. Expert Rev Proteomics. 2014;11:549‐560. [DOI] [PMC free article] [PubMed] [Google Scholar]
- 46. Butler TA, Paul JW, Chan E‐C, et al. Misleading westerns: common quantification mistakes in Western blot densitometry and proposed corrective measures. Biomed Res Int. 2019;2019:1‐15. [DOI] [PMC free article] [PubMed] [Google Scholar]
- 47. Ferguson RE, Carroll HP, Harris A, Maher ER, Selby PJ, Banks RE. Housekeeping proteins: a preliminary study illustrating some limitations as useful references in protein expression studies. Proteomics. 2005;5:566‐571. [DOI] [PubMed] [Google Scholar]
- 48. Langerak AW. Toward standardization of Clonality testing in veterinary medicine. Vet Pathol. 2016;53:705‐706. [DOI] [PubMed] [Google Scholar]
- 49. Zwingenberger AL, Marks SL, Baker TW, Moore PF. Ultrasonographic evaluation of the muscularis propria in cats with diffuse small intestinal lymphoma or inflammatory bowel disease. J Vet Intern Med. 2010;24:289‐292. [DOI] [PubMed] [Google Scholar]
- 50. Guttin T, Walsh A, Durham AC, Reetz JA, Brown DC, Rondeau MP. Ability of ultrasonography to predict the presence and location of histologic lesions in the small intestine of cats. J Vet Intern Med. 2019;33:1278‐1285. [DOI] [PMC free article] [PubMed] [Google Scholar]
- 51. Force USPST . Section 6. Methods for Arriving at a Recommendation 2017.
- 52. NCCN . NCCN clinical practice guidelines in oncology (NCCN guidelines®) esophageal and Esophagogastric junction cancers. Version 1.2014 2014.
- 53. Davies L, Petitti DB, Martin L, Woo M, Lin JS. Defining, estimating, and communicating overdiagnosis in cancer screening. Ann Intern Med. 2018;169:36‐43. [DOI] [PubMed] [Google Scholar]
- 54. Jenniskens K, de Groot JAH, Reitsma JB, Moons KGM, Hooft L, Naaktgeboren CA. Overdiagnosis across medical disciplines: a scoping review. BMJ Open. 2017;7:e018448. [DOI] [PMC free article] [PubMed] [Google Scholar]
- 55. Moynihan R, Doust J, Henry D. Preventing overdiagnosis: how to stop harming the healthy. Bmj. Br Med J. 2012;344:e3502. [DOI] [PubMed] [Google Scholar]
Supporting information
Supplemental Table 1 Demographic, clinical, histopathological, immunohistochemical, and clonality results of cats with feline chronic enteropathy and clinically healthy control cats
Supplemental Table 2 World Small Animal Veterinary Association Gastrointestinal Standardization Group19,20 based histopathological scores of biopsies from the upper small intestinal tract of cats with feline chronic enteropathy and healthy control cats.
ACKNOWLEDGMENTS
No funding was received for this study. Portions of these data were presented at the 2018 American College of Veterinary Internal Medicine Forum in Seattle, WA. The authors thank Jaqueline Sedillo for her work in regards to sample administration and organization of logistics.
Marsilio S, Dröes FC, Dangott L, et al. Characterization of the intestinal mucosal proteome in cats with inflammatory bowel disease and alimentary small cell lymphoma. J Vet Intern Med. 2021;35:179–189. 10.1111/jvim.16003
Floris C. Dröes contributed equally to the study.
Associated Data
This section collects any data citations, data availability statements, or supplementary materials included in this article.
Supplementary Materials
Supplemental Table 1 Demographic, clinical, histopathological, immunohistochemical, and clonality results of cats with feline chronic enteropathy and clinically healthy control cats
Supplemental Table 2 World Small Animal Veterinary Association Gastrointestinal Standardization Group19,20 based histopathological scores of biopsies from the upper small intestinal tract of cats with feline chronic enteropathy and healthy control cats.