

Abstract
Adult hippocampal neurogenesis supports the structural and functional plasticity of the brain, while its decline is associated with neurodegeneration common in Alzheimer’s disease (AD). Although the dysregulation of certain microRNAs (miRNAs) in AD have been observed, the effects of miRNAs on hippocampal neurogenesis are largely unknown.
In this study, we demonstrated miR-351-5p as a causative factor in hippocampal neural progenitor cell death through modulation of the mitochondrial guanosine triphosphatase (GTPase), Miro2. Downregulation of Miro2 by siMiro2 induced cell death, similar to miR-351-5p, whereas ectopic Miro2 expression using an adenovirus abolished these effects. Excessively fragmented mitochondria and dysfunctional mitochondria were indexed by decreased mitochondrial potential, and increased reactive oxygen species were identified in miR-351-5p-induced cell death. Moreover, subsequent induction of mitophagy via Pink1 and Parkin was observed in the presence of miR-351-5p and siMiro2. The suppression of mitochondrial fission by Mdivi-1 completely inhibited cell death by miR-351-5p. miR-351-5p expression increased whereas the level of Miro2 decreased in the hippocampus of AD model mice, emulating expression in AD patients. Collectively, the data indicate the mitochondrial fission and accompanying mitophagy by miR-351-5p/Miro2 axis as critical in hippocampal neural progenitor cell death, and a potential therapeutic target in AD.
Keywords: hippocampal neural progenitor cells, miRNA-351-5p, Miro GTPase, cell death, autophagy, mitophagy, Alzheimer’s disease
Graphical Abstract
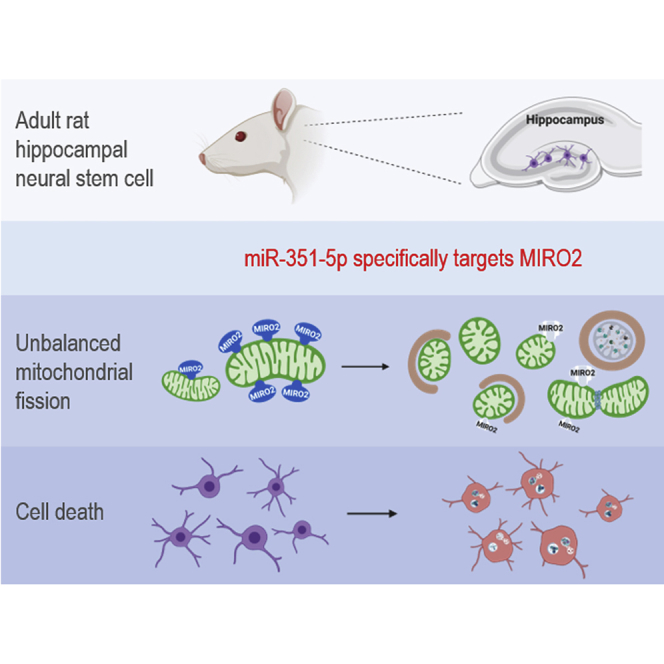
Woo et al. revealed that miR-351-5p is the causative factor for hippocampal neural progenitor cell death through modulation of Miro2. They suggest that mitochondrial fission by the miR-351-5p/Miro2 axis, and accompanying mitophagy, is a critical event in hippocampal neural progenitor cell death, which could be a potential therapeutic target in AD.
Introduction
Alzheimer’s disease (AD) is a progressive neurodegenerative disease characterized by the loss of neurons and synapses, synaptic dysfunction, mitochondrial dysfunction, and inflammatory responses, along with extracellular amyloid plaques and intracellular neurofibrillary tangles.1 Various factors are involved in the reduction of cognitive resilience linked with chronic neurodegenerative disease, including AD. New neurons are generated from multipotent neural progenitor cells in the dentate gyrus (DG) of the hippocampus throughout life, although neuroplasticity may be somewhat affected with age.2 The hippocampus is one of the most affected areas in AD. Decreased neurogenesis in the hippocampus is a critical factor contributing to neurodegenerative defects owing to a declined neural progenitor pool caused by excessive cell death in the hippocampal neurogenic niche.3 Recent reports strongly suggest that impaired adult neurogenesis in the hippocampus is a potentially relevant mechanism underlying memory deficits in AD.4
Adult hippocampal neural progenitor (HCN) cells have previously been isolated from the adult rat brain by Gage group5 and differentiated into neurons, astrocytes, or oligodendrocytes in vitro and in vivo. HCN cells have also been proven to functionally integrate into existing neuronal networks in vivo.6 Their proliferation and differentiation can be regulated by various exogenous and endogenous factors.7 Among these, insulin is known as a critical regulator of HCN cell death. Previously we reported that HCN cells undergo cell death accompanied with excessive autophagy in the absence of insulin.8 According to a recent report, conditional knockout of autophagy regulators in neural stem cells prevented the death of hippocampal neural stem cells induced by chronic stress.9 These data indicate that HCN cells can be considered a genuine model for the study of adult neurogenesis and autophagy-dependent cell death (ADCD).10 However, the molecular mechanisms that regulate autophagy-dependent HCN cell death remain largely unknown.
Alterations in mitochondrial homeostasis caused by the abnormal regulation of dynamics, morphology, and movement are known to be associated with AD.11 Mitochondria play a pivotal role in all eukaryotic cells for cellular energy production, calcium buffering, and regulation of cell death, including apoptosis, necrosis, and autophagy. Therefore, mitochondrial homeostasis is delicately regulated by mitochondrial quality control systems such as mitochondrial biogenesis, mitophagy, fission, and fusion.12 Mitochondrial fission and fusion modulate mitochondrial morphology, network formation, and individual mitochondrial size. Mitochondrial fission is mediated by the guanosine triphosphatase (GTPase) dynamin-related protein 1 (Drp1), whereas fusion involves three GTPases: mitofusin 1 and 2 (Mfn1 and Mfn2) and optic atrophy 1 (OPA1).13,14 Mitochondrial biogenesis and mitophagy, two opposing processes, coordinately regulate mitochondrial contents in response to cellular stresses. Recent research has suggested a functional association between mitochondrial dynamics and mitophagy. Excessive mitochondrial fission promotes mitophagy, which selectively targets mitochondria to autophagosomes through Pink1/Parkin-mediated ubiquitination.15,16
Recently, we used microarray-based analysis and reported that several microRNAs (miRNAs), including miR-351-5p, exhibited significantly altered expression levels upon autophagic death of HCN cells.17 We further identified that increased levels of miR-351-5p could induce HCN cell death but the detailed mechanisms underlying HCN cell death needed more investigation. miRNAs are highly conserved endogenous small non-coding RNAs, about 18–24 nt in length. They repress protein expression at the post-transcriptional level through binding to the 3′ untranslated region (UTR) of a specific messenger RNA (mRNA) with a seed sequence match. These highly conserved miRNAs are deeply involved in diverse biological processes, including cell proliferation, differentiation, and cell death. Interestingly, the human nervous system expresses approximately 70% of all miRNAs. Therefore, it is very likely that miRNAs serve as critical regulators of neurogenesis, neuronal differentiation, and synaptic plasticity in the brain.18
In addition to the relevance of miR-351-5p to HCN cell death, we acknowledged that Miro2 could be the target protein of miR-351-5p. Miro is an atypical Rho-like GTPase localized on the outer mitochondrial membrane (OMM). Two genes encoding Miro GTPases exist in humans: Miro1 and Miro2. Several studies have suggested that Miro proteins are deeply involved in mitochondrial dynamics, including trafficking, fission, and fusion.19 Miro proteins are involved in mitophagy through phosphorylation, ubiquitination, and degradation by Pink1/Parkin.20 It is also known that some mutations of Miro1 found in Parkinson’s disease are related to mitochondrial quality control.21
In the present study, we focused on miR-351-5p and its target Miro2 to investigate their function in HCN cell death related to the maintenance of mitochondrial homeostasis and examined the relevance of these mechanisms to AD.
Results
Mitochondrial GTPase Miro2 is the target of miR-351-5p
We previously reported that miR-351-5p is upregulated during cell death along with autophagy induction in HCN cells.17 Through cross-analysis of miRNA target prediction tools, including TargetScan, DIANA, and miRanda, we predicted mitochondrial GTPase Miro2 as a potential target of miR-351-5p. The 3′ UTR of Miro2 harbors one matching sequence to the seed sequence of miR-351-5p (Figure 1A). psiCHECK-2 vectors containing the 3′ UTR of wild-type (WT) or mutant (MT) Miro2 with 5-nt mismatches within the miR-351-5p target sequence were constructed. Actual binding activity was quantitatively determined through a luciferase assay after co-transfecting psiCHECK-2 with miR-351-5p mimics in 293T cells (Figure 1B). Compared with the miRNA control (miR-Con), miR-351-5p preferentially inhibited Miro2’s 3′ UTR activity by 37% (p < 0.001). As expected, miR-351-5p treatment significantly reduced the amount of Miro2 mRNA and protein by 71% ± 0.07% (p < 0.0001; Figure 1C) and 41% ± 0.10% (p < 0.01; Figures 1D and 1E), respectively. These results indicate that miR-351-5p directly targets Miro2 in HCN cells.
Figure 1.

Miro2 is a direct target of miR-351-5p
(A) Sequence alignment of miR-351-5p with the 3′ UTR of Miro2. Luciferase assay constructs with either WT or MT 3′ UTR of Miro2 were prepared. (B) 293T cells were transfected with miR-351-5p, miR-Con, or anti-miR-351-5p with luciferase assay constructs. miR-351-5p inhibited luciferase expression by directly targeting the 3′ UTR of Miro2. (C) HCN cells were transfected with miR-351-5p or miR-Con. RT-qPCR analysis indicated that miR-351-5p downregulated Miro2 mRNA. (D and E) After transfection of HCN cells with miR-Con or miR-351-5p, western blot analysis showed downregulation of Miro2. miR-351-5p specifically downregulated Miro2 at both the mRNA and protein levels. The data represent the mean ± SD values (n > 3). ∗∗p < 0.01, ∗∗∗p < 0.001.
miR-351-5p and its target Miro2 regulate cell death in HCN cells
To verify the specificity of cell death-inducing activity of miR-351-5p on HCN cells, cells with miR-351-5p mimic and anti-mimetic were treated with antisense sequences against miR-351-5p and the extent of cell death was quantified with propidium iodide (PI) staining (Figures 2A and 2B). miR-351-5p treatment sharply induced HCN cell death, which was specifically inhibited through combinatorial treatment with anti-miR-351-5p in a dose-dependent manner (Figure 2B). To examine the influence of decrease of Miro2 by miR-351-5p, HCN cells were treated with siMiro2 and control small interfering RNA (siRNA) (siCon). When compared with the siCon group, siMiro2 exhibited increased cell death by 32.8% (p < 0.005) in HCN cells (Figures 2C and 2D). The data indicate that miR-351-5p and its downstream target Miro2 potentially regulate HCN cell death.
Figure 2.

Overexpression of miR-351-5p or suppression of its target candidate Miro2 induced cell death in HCN cells
(A and B) HCN cells were transfected with miR-Con, miR-351-5p, anti-miR-Con, or anti-miR-351-5p. After staining with Hoechst 33342 and PI at 24 h after transfection, cell death was quantified by counting PI-positive cells. Anti-miR-351-5p specifically inhibited miR-351-5p-induced cell death in a dose-dependent manner. (C and D) HCN cells were transfected with siCon or siMiro2. After 24 h, cell death was determined using the method described herein. Suppression of Miro2 significantly induced cell death in HCN cells. Data in the graphs represent the mean ± SD values (n > 3). ∗∗p < 0.01.
Suppression of Miro2 by miR-351-5p induces ADCD in HCN cells
siMiro2- and miR-351-5p-treated HCN cells experienced an increase in levels of autophagic vacuoles, as clearly identified and quantitated using transmission electron microscopy (TEM; data not shown). The number of autophagic vesicles was 8% ± 0.95% (p < 0.0001) in the miR-351-5p group, 8.0% ± 2.16% in the siMiro2 group (p < 0.0001), and 3.2% ± 0.75% in the control group (Figure 3A). The conversion and association of ATG8/LC3 protein with autophagosomes and degradation of representative substrate, such as p62, are established autophagy indicators. During autophagy, LC3-I is associated with phosphatidylethanolamine (PE) and forms an LC3-PE conjugate (LC3-II) that is localized at the autophagosome membrane. miR-351-5p increased LC3-II levels (2.54- ± 0.55-fold), and combinatorial treatment with miR-351-5p and anti-miR-351-5p completely restored LC3-II conversion (Figures 3B, 3C, and S1). The level of p62 was regulated by miR-351-5p and bafilomycin A1 (Baf-A), a lysosomal-targeting autophagy inhibitor (Figures 3B and 3C).
Figure 3.

Suppression of Miro2 by miR-351-5p induces ADCD in HCN cells
(A) Quantification was carried out by enumerating the autophagosomes per cell (n > 4). miR-351-5p and siMiro2 treatment significantly increased the number of autophagic vesicles relative to the control group. (B) After treatment with miR-351-5p or miR-Con, cells were treated with bafilomycin A1 (Baf-A) (10 or 20 nM) for 1 h before harvesting. Cell lysates were prepared and analyzed by western blotting using anti-LC3 and anti-p62. β-Actin was used as a loading control. (C) Quantitation of the LC3 conversion. The ratio of LC3-II/LC3-I was analyzed using ImageJ software. (D) Autophagy flux was monitored using mRFP-GFP tandem fluorescent-tagged LC3 (tfLC3) plasmid. At 24 h after transfection with miR-351-5p or miR-Con, cells were observed under a confocal microscope. Baf-A (20 nM) treatment was applied 1 h before observation. (E) Quantitation of red LC3 puncta from (D) (n = 39 cells for miR-Con, 32 cells for miR-351-5p, and 84 cells for miR-351-5p+Baf-A from three independent experiments). (F and G) Cells were treated with autophagy inhibitors chloroquine (CQ) and Baf-A 1 h before miR-351-5p or miR-Con transfection. At 24 h after transfection, cell death was assessed using the method described herein. Cell death induced by siMiro2 and miR-351-5p was effectively suppressed in the presence of CQ and Baf-A. Data in the graphs represent the mean ± SD values (n > 3). ∗p < 0.05, ∗∗p < 0.01, ∗∗∗p < 0.001.
To monitor autophagic flux, we used a monomeric red fluorescent protein (mRFP)-green fluorescent protein (GFP) tandem fluorescent-tagged LC3 (tfLC3) plasmid.21 Because of the reduced stability of GFP under acidic conditions, mRFP signals without GFP indicate autophagosomes fused with a lysosome (mature autolysosome) and autophagic flux in the final stage of autophagy. An increased number of mRFP-LC3 puncta was observed in miR-351-5p-treated HCN cells (Figures 3D and 3E). Additionally, Baf-A treatment increased mRFP-LC3 puncta and LC3-II levels (Figures 3B and 3D). These data represent autophagy flux activation by miR-351-5p. We previously reported that HCN cell death induced by miR-351-5p was an ADCD, with the autophagy inhibitor being 3-methyl adenine (3-MA).17 Therefore, the effects of late-phase autophagy inhibitors on HCN cell death were investigated. Chloroquine (CQ) and Baf-A inhibited the formation of autolysosomes and lysosomal acidification, respectively.23 Cell death induced by miR-351-5p was effectively suppressed in the presence of CQ and Baf-A (Figures 3F and 3G). These indicate that increased levels of miR-351-5p and decreased levels of Miro2 specifically induce ADCD.
Suppression of Miro2 and miR-351-5p induce PINK1-Parkin-dependent mitophagy and mitochondrial dysfunction
Accumulating evidence has supported the important role of Miro in mitochondrial dynamics such as mitochondrial fission, fusion, and mitophagy.19 In the present study, the number of autophagosomes containing mitochondria increased in miR-351-5p- and siMiro2-treated HCN cells (Figures 4A, 4B, and S2). miR-351-5p or siMiro2-treated HCN cells were examined for mitophagy using MitoTracker and LysoTracker. In the miR-351-5p- or siMiro2-treated cells, MitoTracker and LysoTracker were significantly overlapped (Figures 4C). Mitochondria and lysosomes in miR-351-5p- or siMiro2-treated cells were quite co-localized, confirming the occurrence of mitophagy. To determine the degree of mitophagy, we used a mitophagy dye that increased the incidence of pH-sensitive fluorescence when the autophagosome containing mitochondria fused with acidic lysosomes.23 The fluorescence intensity of the mitophagy dye in the miR-351-5p-treated group was markedly higher than that in the control group, which was treated with anti-miR-351-5p. siMiro2 treatment also induced mitophagy (Figure 4D). The Pink1 and Parkin status during mitophagy, determined through western blotting, indicated that Pink1 and Parkin specifically accumulated in miR-351-5p- and siMiro2-treated groups (Figures 4E and 4F). These results suggest that Miro2 suppression by miR-351-5p effectively induces mitophagy via Pink1 Parkin activity.
Figure 4.

Suppression of Miro2 and miR-351-5p induces mitophagy in HCN cells
(A and B) Cells were transfected with miR-351-5p, miR-Con, or siMiro2 and observed by TEM. Autophagosomes containing mitochondria (white arrows) were quantitated by enumerating mitophagosomes per cell (n > 4). miR-351-5p and siMiro2 significantly increased the number of autophagic vesicles relative to the control group. (C) To assess mitophagy induction, HCN cells transfected with miR-Con, miR-351-5p, or siMiro2 were treated with MitoTracker (green) and LysoTracker (red). Under the confocal microscope, colocalized regions were observed as yellow puncta. (D) HCN cells transfected with miR-Con, miR-351-5p, or siMiro2 were treated with mitophagy dye whose fluorescence was altered through mitophagy progression. (E and F) Western blot analysis revealed that Pink1 and Parkin accumulated in miR-351-5p- and siMiro2-induced mitophagy. Anti-miR-351-5p suppressed the accumulation of Pink1 and Parkin by miR-351-5p. Data in the graphs represent the mean ± SD values (n > 3). ∗∗p < 0.01, ∗∗∗p < 0.001.
Along with inducing mitophagy, both miR-351-5p- and siMiro2-treated HCN cells displayed drastically increased mitochondrial fragmentation (Figures 5A and 5B; Video S1). Mitochondrial function was assessed by quantifying the mitochondrial membrane potential (MMP) and ATP content. Due to the reduction in the MMP, JC-1 cannot aggregate in the matrix of reduced MMP, causing the emitted fluorescence to change from red to green. miR-351-5p- and siMiro2-treated HCN cells displayed a high ratio of green/red fluorescence, indicating a reduction in MMP (Figure 5C). Mitochondrial ATP synthesis, assessed via the ToxGlo assay, indicated that miR-351-5p or siMiro2 decreased ATP synthesis (Figure 5D). Mitochondrial dysfunction by miR-351-5p was readily restored by anti-miR-351-5p (Figures 5C and 5D). The expression level of Drp1 was increased and Mfn2 was decreased upon treatment with miR-351-5p and siMiro2 (Figures 5E and 5F). Thus, the inhibition of Miro2 expression by miR-351-5p induces mitochondrial fission, accompanied by mitochondrial dysfunction.
Figure 5.

Suppression of Miro2 caused mitochondrial fission and dysfunction
(A and B) HCN cells transfected with miR-351-5p and siMiro2 were stained with MitoTracker green. High-resolution images of HCN cells revealed excessive mitochondrial fission in miR-351-5p- and siMiro2-treated cells. The observed mitochondrial fission was quantitated. (C) Mitochondrial membrane potential was measured via JC-1. Decreased mitochondrial potential in miR-351-5p- and siMiro2-treated HCN cells revealed a high ratio of green/red fluorescence of JC-1. (D) Mitochondrial ATP production was analyzed via a ToxGlo assay. miR-351-5p- and siMiro2-transfected cells were incubated in galactose-containing media, and ATP was quantified. miR-351-5p or siMiro2 decreased mitochondrial ATP synthesis. Relative quantification was carried out on the basis of miR-Con-treated cells. Mitochondrial uncoupler CCCP was used as an inducer of mitochondrial dysfunction. (E and F) Mitochondrial fission factor Drp1 and mitochondrial fusion factor Mfn2 were analyzed by western blotting after treatment miR-351-5p and siMiro2. β-Actin was used as a loading control. Mitochondrial dysfunction was restored by anti-miR-351-5p. Data in the graphs represent the mean ± SD values (n > 3). ∗p < 0.05, ∗∗p < 0.01, ∗∗∗p < 0.001
Inhibition of mitochondrial fission abolished ADCD induced by miR-351-5p via Miro2 by reestablishing mitochondrial function
To investigate whether miR-351-5p- or siMiro2-induced mitochondrial fission abnormalities play a crucial role in ADCD in HCN cells, we treated cells with the mitochondrial fission inhibitor Mdivi-1, which specifically targets Drp1.24 Pretreatment of Mdivi-1 restored mitochondrial morphology in the elongated form (Figures 6A and 6B), and it significantly restored MMP reduced by miR-351-5p or siMiro2 (Figure 6C). Inhibiting mitochondrial fission completely prevented miR-351-5p-induced cell death (Figures 6D and S4). The critical role of Miro2 in miR-351-5p-induced HCN cell death was further confirmed through measuring Miro2 overexpression using recombinant adenovirus (rAD-Miro2) in combination with miR-351-5p. Nearly all HCN cells expressed green fluorescence upon treatment with rAD-GFP, and Miro2 proteins were upregulated by rAD-Miro2 in a dose-dependent manner (Figures S5A and S5B). rAD-Miro2 effectively inhibited miR-351-5p-induced cell death down to 7.6% ± 2.6%, whereas rAD-GFP resulted in a 35.8% ± 3.3% increase in cell death (Figures 7A and S5C). rAD-Miro2 treatment suppressed excessive mitochondrial fission induced by miR-351-5p and siMiro2, and mitochondrial morphology recovered as a tubular network (Figures 7B and 7C). Overexpression of Miro2 completely inhibited cell death and mitochondrial fission induced by insulin withdrawal (Figures 7D and 7E). These data indicate that Miro2 is the target of miR-351-5p and regulates HCN cell death through mitochondrial fission, consequently inducing mitophagy.
Figure 6.

Inhibition of mitochondrial fission inhibited ADCD induced by miR-351-5p via Miro2 by reestablishing mitochondrial function
(A and B) Mdivi-1 is a mitochondrial fission inhibitor that inhibits mitochondrial fission factor Drp-1. The inhibitory effects of Mdivi-1 on mitochondrial fission induced by miR-351-5p or siMiro2 were observed and quantitated. (C) After treatment of Mdivi-1, mitochondrial membrane potential was measured via JC-1. CCCP was used to induce mitochondrial damage. (D) Mdivi-1 inhibited ADCD induced through miR-351-5p and siMiro2 in a dose-dependent manner. Cell death was analyzed as described above. Data in the graphs represent the mean ± SD values (n > 3). ∗∗p < 0.01, ∗∗∗p < 0.001.
Figure 7.

Overexpression of Miro2 adequately recovered cell death and mitochondrial fission induced by miR-351-5p or insulin withdrawal on HCN cells
(A) Adenovirus expressing Miro2 was generated. Infection efficiency was confirmed using rAD-GFP virus used as a control (>90%, Figures S4A and S4B). rAD-Miro2 completely suppressed miR-351-5p-induced cell death. (B and C) Mitochondrial morphology was monitored and quantitated using MitoTracker after co-treatment with rAD-Miro2 and miR-351-5p. (D and E) HCN cells were cultured in an insulin (−) medium in the presence of rAD-GFP or rAD-Miro2 for 24 h. Cell death was measured by counting PI-positive cells. Mitochondrial morphology was monitored using MitoTracker under a confocal microscope. Data in the graphs represent the mean ± SD values (n > 3). ∗p < 0.05, ∗∗p < 0.01, ∗∗∗p < 0.001.
miR-351-5p and Miro2 were deregulated in AD
Recent studies have reported that a diminished neural progenitor population within the hippocampus resulting from excessive cell death may be closely associated with neuronal deficiencies observed among AD patients.3 We thus speculated that dysregulation of miR-351-5p and its target Miro2 may affect the survival of HCN cells. Therefore, we analyzed RNA sequencing data from the Allen Brain Institute Aging, Dementia, and Traumatic Brain Injury (TBI) study to investigate the association between Miro2 and AD. Based on the metadata regarding the hippocampus, an AD group (n = 24) with AD neuropathological features and a control group (n = 29) were distinguished. Miro2 levels were lower in the AD group than in the control group (Figure 8A). Similarly, Miro2 was downregulated in the dementia group (n = 36) when compared to the non-dementia group (n = 38) (Figure 8B). To further investigate, Miro2 expression specifically in the hippocampal progenitor cells of the AD model mice was examined. Hippocampal specimens from WT and the triple-transgenic model (3xTG) at 15 weeks were examined for Miro2 expression in Nestin+ cells, representing progenitor cells in the hippocampus during adult neurogenesis.4 Immunohistochemical analysis revealed that Miro2 was significantly decreased in the Nestin+ cells (Figures 8C and 8D). Similarly, Miro2 was decreased in the proliferating hippocampal cells, doublecortin (DCX)+ cells (Figure S6). The expression levels of miR-351-5p and Miro2 were further examined by quantitative RT-PCR analysis in the hippocampus of 3xTG and other AD model 5xFAD mice. In the AD model, miR-351-5p was upregulated and Miro2 was downregulated relative to WT mice (Figure S6), suggesting the potential involvement of dysregulated miR-351-5p and its target Miro2 expression in the survival of HCN cells in AD.
Figure 8.

Expression of miR-351-5p and its target candidate Miro2 in the hippocampus is associated with adult neurogenesis and AD pathophysiology
(A and B) RNA sequencing data from the Allen Brain Institute Aging, Dementia, and Traumatic Brain Injury (TBI) study were analyzed for Miro2 expression. The AD group (n = 24) (neuropathological features of AD, including amyloid-β secretion and the presence of amyloid plaques), control group (n = 29), dementia group (n = 36), and non-dementia group (n = 38) were formed. (C and D) To analyze the expression of Miro2 in proliferating cells in the hippocampus of mouse brain, 15-week-old WT and 3xTG AD model mice were examined by immunohistochemistry using anti-Miro2 and anti-Nestin antibody. Images were observed using a confocal microscope, and levels of Miro2 were quantified specifically in Nestin+ cells using ImageJ software. ML, molecular layer; GCL granule cell layer in dentate gyrus. Data in the graphs represent the mean ± SD values (n = 16 cells for WT, 18 cells for 3xTG from three independent experiments). ∗p < 0.05; ∗∗∗p < 0.001.
Figure 9 illustrates the schematic mechanism of the miR-351-5p/Miro2 axis during HCN cell death derived from the above experiments. Upon abnormal stimuli, increased levels of miR-351-5p downregulate Miro2 in HCN cells. Abnormally low Miro2 levels readily induce mitochondrial fission, causing excessive mitophagy and eventual HCN cell death, possibly leading to AD.
Figure 9.

Schematic mechanism of the miR-351-5p/Miro2 axis in adult neurogenesis
By an unknown mechanism, abnormal stimuli increase the amount of miR-351-5p, which sequentially downregulates Miro2 in HCN cells. Aberrant low Miro2 levels readily induced mitochondrial fission, resulting in excessive mitophagy and cell death in the HCN population, which can contribute to the pathological condition in AD.
Discussion
Since the discovery and subsequent affirmation of hippocampal adult neurogenesis, accumulating evidence indicates that the decline in neural progenitor cell populations may contribute to the pathogenesis of neurological disorders, including AD.3 Indeed, smaller stem cell pools in aged AD patients or a sharp reduction in adult hippocampal neurogenesis in AD patients further supports this finding.4 RNA sequencing data from the Allen Brain Institute Aging, Dementia, and Traumatic Brain Injury study revealed a significant reduction in Miro2 in the hippocampus of the AD and dementia group (Figures 8A and 8B). Considering that AD is a chronic disease progressing during a long period, even a slight reduction in Miro2 expression can significantly influence the maintenance of hippocampal neurogenesis. Also, a reduction of Miro2 levels specifically in the proliferating cells in the hippocampus of AD model mice supports that Miro2 has important functions during adult neurogenesis. Furthermore, the present results indicate the upregulation of miR-351-5p and the downregulation of its target Miro2, probably implying that the miR-351-5p/Miro2 axis helps maintain the HCN cell pool. Several reports suggested that an increase in adult hippocampal neurogenesis is sufficient to improve cognition and mood, thus showing its potential as a therapeutic target for neurological diseases.25,26 Thus, the miR-351-5p/Miro2 axis may be a promising target for the maintenance of neural progenitor pools for neurodegenerative diseases.
Dysregulation of mitochondrial dynamics is related to the pathogenesis of various human diseases, including neuronal diseases.11 As a major site of energy production, mitochondria are essential organelles with high plasticity for cell survival, death, and metabolic homeostasis. Mitochondria delicately regulate their homeostasis through several dynamic phenomena, including fission, fusion, and mitophagy.12 The present results indicate that suppression of Miro2 by miR-351-5p readily induced massive mitochondrial fission (Figure 5). Under normal physiological conditions, mitochondrial fission is a necessary phenomenon for mitochondrial quality control in driving mitophagy by segregating severely damaged mitochondria.15 Furthermore, the present results suggest that excessive mitochondrial fission can lead to undesirable mitophagic events, resulting in massive loss of normal mitochondria and eventual HCN cell death. This finding is further supported by the fact that such cell death was significantly suppressed by the mitochondrial fission inhibitor Mdivi-1 inhibiting a primary regulator of mitochondrial fission, Drp-1 (Figures 6C and 6D). Through ectopic expression of Miro2, miR-351-5p-induced cell death was significantly suppressed (Figure 7A), and mitochondrial morphology was also reinstated (Figures 7B and 7C). Expression of Miro2 also suppressed cell death induced by insulin withdrawal in HCN cells (Figures 7D and 7E). These results indicate the crucial role of Miro2 in ADCD in HCN cells through unexpected massive mitochondrial fission.
Miro protein, known to have a subset of Miro1 and Miro2, is intricately involved in mitochondrial dynamics by regulating mitochondrial mitophagy, fusion, and fission.27 Under normal conditions, Miro GTPase and its guanine nucleotide exchange factor VIMAR/RAP1GDS1 complex regulate mitochondrial fission through Drp-1.28 Our study suggests that increased miR-351-5p levels by unidentified abnormal factors in HCN cells can trigger the cell death owing to a shift toward mitochondrial fission and mitophagy in accordance with the loss of normal levels of Miro2 protein. Interestingly, Miro1 and Miro2 were considered to have functional redundancy despite the slight phenotypic differences in knockout mice.29 Some studies have recently revealed functional differences between Miro1 and Miro2.30,31 Our results suggest that miR-351-5p preferentially downregulates Miro2, not Miro1. In fact, Miro1 does not harbor the target sequence for miR-351-5p in its 3′ UTR (data not shown). Furthermore, we confirmed that cell death-inducing activity was observed only for siMiro2, not for siMiro1, in HCN cells (data not shown). Furthermore, Miro1 expression levels did not differ in the RNA sequencing data in Allen Brain Institute Aging, Dementia, and Traumatic Brain Injury study (data not shown). Although many questions regarding functional differences between Miro1 and Miro2 remain unsolved, our results indicate that Miro2 potentially plays different roles with Miro1 in mitochondrial fission and fusion maintenance in HCN cells.
Cell death in HCN cells is known to be ADCD, which fulfilled the criteria proposed by Shen and Codogno.8,32 miR-351-5p-induced cell death occurred independent of apoptosis, increased autophagic flux, and was suppressed by autophagy inhibitors (Figures 3F and 3G). In particular, the miR-351-5p/Miro2 axis induced Pink1-Parkin-mediated mitophagy (Figures 4E and 4F). A correlation between Miro proteins and Pink-Parkin-mediated mitophagy has been previously reported wherein Miro1 is phosphorylated by Pink1 at Ser65, then ubiquitinated by Parkin and degraded by the proteasome.33 Furthermore, knockdown of Miro1 suppresses mitophagy through reduction of mitochondrial Parkin translocation.34 HCN cell death mediated by the miR-351-5p/Miro2 axis was characterized by ADCD in the present study; however, the molecular basis of HCN-mediated cell death remains largely unknown, warranting further investigation.
Several miRNAs are reportedly implicated in neurogenesis such as miR-9, miR-19, miR-124, and miR-137.35, 36, 37, 38, 39 However, these miRNAs are involved in embryonic neurogenesis or neural fate determination, maturation, and migration. The present results indicate that miR-351-5p is a new specific miRNA that directly determines cell survival and death among HCN cells. Thus far, most of our knowledge on the survival and death of HCN cells has been obtained from rodent models, and limited information is available regarding physiological regulation in adult neurogenesis. The physiological or pathological stimuli upregulating miR-351-5p in HCN cells still remain unclear, and their regulatory mechanisms warrant further investigation.
Collectively, our study indicates the aberrant expression of miR-351-5p and mitochondrial GTPase Miro2 in the hippocampus of human AD patients and AD model mice. These results thus suggest that the miR-351-5p/Miro2 axis may play significant roles in the hippocampus, contributing to the pathogenesis or progression of AD. miR-351-5p causes uncontrolled mitochondrial fission through Miro2 inhibition, which is a critical determinant of mitophagy-dependent cell death in rat adult HCN cells. Collectively, these findings indicate that miR-351-5p and Miro2 are important regulators of cell death of HCNs, suggesting the involvement of dysregulation of hippocampal neurogenesis in AD.
Materials and methods
Adult HCN cell culture, transfection, and chemical treatment
HCN cells were cultured in serum-free Dulbecco’s modified Eagle’s medium nutrient mixture F-12 (Invitrogen, Carlsbad, CA, USA) supplemented with 1.27 g/L sodium bicarbonate (Invitrogen), 100 mg/L transferrin (Sigma, St. Louis, MO, USA), 30 nM sodium selenite (Sigma), 16 mg/L putrescine dihydrochloride (Sigma), 20 nM progesterone, 100 μg/mL streptomycin, and 100 U/mL penicillin (Invitrogen). Furthermore, 20 ng/mL fibroblast growth factor β (FGF-β) (Invitrogen) and 5 μg/mL insulin (Sigma) were added to the media before use. All plates for HCN cells were coated with 10 mg/L poly-l-ornithine and 1 mg/L laminin.
miRNA mimics and anti-miRNAs were purchased from Genolution (Korea), whereas siRNA duplexes were from Bioneer (Korea). Transient transfection was carried out using Lipofectamine 2000 according to the manufacturer’s instructions, and cells were harvested at the designated time for the following experimental step. To depolarize mitochondria, HCN cells were treated with 10 μM CCCP (carbonyl cyanide 3-chlorophenylhydrazone) (Sigma; C2759) for 2 h. Additionally, CQ diphosphate salt (Merck; C6628) and bafilomycin A (Merck; B1793) were added to cultures at 1 h before observation (10/20 nM) for autophagy inhibition. Mdivi-1 (Merck; M0199) treatment was also performed 1 h before transfection to block mitochondrial fission.
Cell viability assays
Viability of HCN cells was measured by staining with Hoechst 33342 and PI. Hoechst 33342 (5 μg/mL) and PI were added to the culture media, and cells were maintained at 37°C. After 5 min, the observed fields were randomly selected (>5 fields, >200 cells) and imaged under a fluorescence microscope. Using ImageJ, the cell death rate was calculated as: cell death rate (%) = [PI-positive cell number (red)/Hoechst 33342-positive cell number (blue)] × 100.
Western blot analysis and immunohistochemistry
HCN cells were harvested and lysed in M-per buffer (Thermo Fisher Scientific, Wilmington, DE, USA; 78501) containing protease cocktail inhibitors (Merck; P8340) and phosphatase inhibitors (Merck; P5726). After lysis, cell lysates were measured using the Pierce bicinchoninic acid (BCA) protein assay kit (Thermo Fisher Scientific; #23225) and loaded with 15–20 μg of proteins for western blotting analysis. The primary antibodies used were as follows: anti-Miro2 (1:1,000, Proteintech, Rosemont, IL, USA; 11237-1-AP), anti-Pink1 (1:1,000, Novus Biologicals, Centennial, CO, USA; BC100-494,), anti-Parkin (1:2,000, Santa Cruz Biotechnology, Dallas, TX, USA; SC32282), anti-Drp1 (1:1,000, Cell Signaling Technology, Beverly, MA, USA; 8570S), anti-Mfn2 (1:3,000, Abcam; ab56889), anti-p62 (1:2,000, Abnova, Taipei, Taiwan; H00008878-M01), anti-Nestin (1:1,000, Millipore, Billerica, MA, USA; MAB353), and anti-β-actin (1:100,000, Sigma; A5441). The primary antibodies were then bound to peroxidase-conjugated secondary antibodies diluted in blocking solution, and their binding on the membrane was detected using an enhanced chemiluminescence (ECL) system (Thermo Fisher Scientific; 32106).
TEM
Cells were fixed with 2% paraformaldehyde and 2.5% glutaraldehyde in sodium cacodylate buffer (pH 7.2) at 4°C. The fixed samples were then dehydrated using an ethanol gradient (50%, 60%, 70%, 80%, 90%, and 100%) for 30 min each. Ultra-thin sections were cut on uncoated copper grids and were stained with lead nitrate and 2% uranyl acetate. The samples were then examined with TEM.
Animals
AD model 5xFAD mice (APP KM670/671NL [Swedish], APP I716V [Florida], APP V717I [London], PSEN1 M146L [A>C], PSEN1 L286V) and 3xTg-AD mice (APP Swedish, tauP301L, PSEN1 M146V) were purchased from Jackson Laboratory. All animal experiments and procedures were approved by the Institutional Animal Care and Use Committee of Sungkyunkwan University (2018-01-01-1).
Autophagic flux assay
For confocal microscopy live cell imaging, HCN cells were prepared on μ-Dish (ibidi, Germany; 81156) and mRFP-GFP tfLC322 constructs were co-transfected with miR-351-5p. At 24 h images were obtained with a confocal microscope (LSM 780; Carl Zeiss, Germany).
Mitophagy assay
HCN cells treated with miR-Con, miR-351-5p, or siMiro2 were stained with MitoTracker (Invitrogen; M7514) and LysoTracker (Thermo Fisher Scientific, Carlsbad, CA, USA; L7528) and observed under a confocal microscope. Co-localizations of MitoTracker and LysoTracker were observed by confocal fluorescence microscopy. To examine the degree of mitophagy, HCN cells transfected with miRNAs and siMiro2 were stained with a mitophagy dye (Dojindo, Japan; MD01-10) according to the manufacturer’s instructions. To induce mitophagy, HCN cells were treated with a final concentration of 10 μM CCCP. At 24 h, the HCN cells were washed twice with serum-free medium. The intensity of the mitophagy dye was measured using ZEN software (Carl Zeiss).
Mitochondrial function analysis
To determine the MMP, cells were seeded in six-well plates and transfected with miRNAs and siRNA for 24 h. Cells were then stained using JC-1 fluorescent dye (Abcam; ab113850) for 1 h at 37°C. After treatment as indicated, the cells were harvested and analyzed with a flow cytometer using FACSCanto Plus software (BD Biosciences, San Jose, CA, USA). Fluorescent signals for J-aggregates and J-monomers were read at excitation and emission wavelengths of 535 and 595 nm and 485 and 535 nm, respectively. The J-aggregates/J-monomers ratio was then calculated. ATP levels of mitochondria were measured using the mitochondrial ToxGlo assay (Promega, Madison, WI, USA; G8000). To assay the mitochondrial activity, HCN cells transfected with each condition were incubated in a white 96-well plate in glucose- or galactose-containing medium for 90 min. Then, 100 μL of Promega mitochondrial ToxGlo assay medium was added to each well. The HCN cells were then incubated at 37°C for 30 min, and their luminescence was measured for detection of ATP production. To quantify mitochondrial fission, cells were treated with MitoTracker and imaged with a confocal microscope. A minimum of 100 randomly selected cell regions in each treatment group were analyzed for mitochondrial length using ImageJ software.
miRNA quantification
TRIzol reagent (Invitrogen; 15596026) was used to isolate the total RNA of each tissue sample. For quantitation of miR-351-5p expression, reverse transcription was performed with the Mir-X miRNA first-strand synthesis kit (Clontech Laboratories, Mountain View, CA, USA; 638313), followed by PCR amplification using the iQ SYBR Green I mix (Bio-Rad, Hercules, CA, USA; 170-8885) on the CFX96 real-time system (Bio-Rad). GAPDH was used as the reference gene for relative quantification. The primer used for miR-351-5p was 5′-TCCCTGAGGAGCCCTTTGAGCCTG-3′. For quantitation of Miro2, reverse transcription was performed with oligo(dT) primers. GAPDH was used as the reference gene for relative quantification. The primers used for Miro2 and GAPDH were as follows: Miro2, forward, 5′-GAGAAGATCCGAACCAAGTGG-3′, reverse, 5′-ACACAGCCTCTATGGTACTCC-3′; GAPDH, forward, 5′-TGCACCACCAACTGCTTAGC-3′, reverse, 5′-GCATGGACTGTGGTCATGAG-3′.
3′ UTR luciferase reporter assay
The WT 3′ UTR of Miro2 (WT-Miro2) and the mutant-type 3′ UTR of Miro2 (MT-Miro2) were inserted into psiCHECK-2 at the 3′ end of the coding sequence of Renilla luciferase by the manufacturer. For luciferase reporter analysis, two types of DNAs were transfected using Lipofectamine 2000 along with the miR-351-5p mimics or miR-Con mimics into HCN cells, respectively. The activities of firefly and Renilla luciferases were measured at 24 h after transfection. The dual-luciferase assay was performed using the Dual-Luciferase reporter assay system (Promega; E1960) using the manufacturer-qualified instruments.
Statistical analysis
All experiments were performed independently in triplicate, and all quantitative results are represented as means ± standard deviation (SD). Statistical analysis was performed with Prism 5 software (GraphPad, San Diego, CA, USA). Differences between means were considered statistically significant at the following values: ∗p < 0.05, ∗∗p < 0.01, ∗∗∗p < 0.001.
Acknowledgments
This work was supported by National Research Foundation of Korea (NRF) grants (2017R1A2B4012769 to H.L., NRF-2018R1D1A1A02045847 to H.-N.W., and 2018R1A5A2020732 to S.W.K.). We thank Yunhee Kim Kwon (Kyung Hee University) for critical advice and discussion, Won Il Lee for providing fundamental ideas, and Paula Khim for English editing. We also thank the Electron Microscope and Confocal Microscope core facilities at the Convergence Medicine Research Center (CREDIT), Asan Medical Center, for support and instrumentation.
Author contributions
Conceptualization, H.L. and S.W.K.; methodology, H.-N.W., S.P., H.L.K. M.-K.J., J.P., Y.C., and D.K.K.; investigation, H.L., S.W.K., H.-N.W., S.P., C.-G.P., D.-G.J., and I.M.-J.; writing – original draft, H.L., H.-N.W., and S.P.; writing – review & editing, H.L., S.W.K., and H.-N.W. All authors read and approved the final manuscript
Declaration of interests
The authors declare no competing interests.
Footnotes
Supplemental Information can be found online at https://doi.org/10.1016/j.omtn.2020.12.014.
Contributor Information
Seong Who Kim, Email: swhokim@amc.seoul.kr.
Heuiran Lee, Email: heuiran@amc.seoul.kr.
Supplemental information
References
- 1.Scheltens P., Blennow K., Breteler M.M., de Strooper B., Frisoni G.B., Salloway S., Van der Flier W.M. Alzheimer’s disease. Lancet. 2016;388:505–517. doi: 10.1016/S0140-6736(15)01124-1. [DOI] [PubMed] [Google Scholar]
- 2.Boldrini M., Fulmore C.A., Tartt A.N., Simeon L.R., Pavlova I., Poposka V., Rosoklija G.B., Stankov A., Arango V., Dwork A.J. Human hippocampal neurogenesis persists throughout aging. Cell Stem Cell. 2018;22:589–599.e5. doi: 10.1016/j.stem.2018.03.015. [DOI] [PMC free article] [PubMed] [Google Scholar]
- 3.Toda T., Parylak S.L., Linker S.B., Gage F.H. The role of adult hippocampal neurogenesis in brain health and disease. Mol. Psychiatry. 2019;24:67–87. doi: 10.1038/s41380-018-0036-2. [DOI] [PMC free article] [PubMed] [Google Scholar]
- 4.Moreno-Jiménez E.P., Flor-García M., Terreros-Roncal J., Rábano A., Cafini F., Pallas-Bazarra N., Ávila J., Llorens-Martín M. Adult hippocampal neurogenesis is abundant in neurologically healthy subjects and drops sharply in patients with Alzheimer’s disease. Nat. Med. 2019;25:554–560. doi: 10.1038/s41591-019-0375-9. [DOI] [PubMed] [Google Scholar]
- 5.Ray J., Peterson D.A., Schinstine M., Gage F.H. Proliferation, differentiation, and long-term culture of primary hippocampal neurons. Proc. Natl. Acad. Sci. USA. 1993;90:3602–3606. doi: 10.1073/pnas.90.8.3602. [DOI] [PMC free article] [PubMed] [Google Scholar]
- 6.Reynolds B.A., Weiss S. Generation of neurons and astrocytes from isolated cells of the adult mammalian central nervous system. Science. 1992;255:1707–1710. doi: 10.1126/science.1553558. [DOI] [PubMed] [Google Scholar]
- 7.Palmer T.D., Markakis E.A., Willhoite A.R., Safar F., Gage F.H. Fibroblast growth factor-2 activates a latent neurogenic program in neural stem cells from diverse regions of the adult CNS. J. Neurosci. 1999;19:8487–8497. doi: 10.1523/JNEUROSCI.19-19-08487.1999. [DOI] [PMC free article] [PubMed] [Google Scholar]
- 8.Yu S.W., Baek S.H., Brennan R.T., Bradley C.J., Park S.K., Lee Y.S., Jun E.J., Lookingland K.J., Kim E.K., Lee H. Autophagic death of adult hippocampal neural stem cells following insulin withdrawal. Stem Cells. 2008;26:2602–2610. doi: 10.1634/stemcells.2008-0153. [DOI] [PubMed] [Google Scholar]
- 9.Jung S., Choe S., Woo H., Jeong H., An H.K., Moon H., Ryu H.Y., Yeo B.K., Lee Y.W., Choi H. Autophagic death of neural stem cells mediates chronic stress-induced decline of adult hippocampal neurogenesis and cognitive deficits. Autophagy. 2020;16:512–530. doi: 10.1080/15548627.2019.1630222. [DOI] [PMC free article] [PubMed] [Google Scholar]
- 10.Allen B., Ingram E., Takao M., Smith M.J., Jakes R., Virdee K., Yoshida H., Holzer M., Craxton M., Emson P.C. Abundant tau filaments and nonapoptotic neurodegeneration in transgenic mice expressing human P301S tau protein. J. Neurosci. 2002;22:9340–9351. doi: 10.1523/JNEUROSCI.22-21-09340.2002. [DOI] [PMC free article] [PubMed] [Google Scholar]
- 11.Fang E.F., Hou Y., Palikaras K., Adriaanse B.A., Kerr J.S., Yang B., Lautrup S., Hasan-Olive M.M., Caponio D., Dan X. Mitophagy inhibits amyloid-β and tau pathology and reverses cognitive deficits in models of Alzheimer’s disease. Nat. Neurosci. 2019;22:401–412. doi: 10.1038/s41593-018-0332-9. [DOI] [PMC free article] [PubMed] [Google Scholar]
- 12.Dorn G.W., 2nd Evolving concepts of mitochondrial dynamics. Annu. Rev. Physiol. 2019;81:1–17. doi: 10.1146/annurev-physiol-020518-114358. [DOI] [PubMed] [Google Scholar]
- 13.Ishihara N., Eura Y., Mihara K. Mitofusin 1 and 2 play distinct roles in mitochondrial fusion reactions via GTPase activity. J. Cell Sci. 2004;117:6535–6546. doi: 10.1242/jcs.01565. [DOI] [PubMed] [Google Scholar]
- 14.Delettre C., Lenaers G., Griffoin J.-M., Gigarel N., Lorenzo C., Belenguer P., Pelloquin L., Grosgeorge J., Turc-Carel C., Perret E. Nuclear gene OPA1, encoding a mitochondrial dynamin-related protein, is mutated in dominant optic atrophy. Nat. Genet. 2000;26:207–210. doi: 10.1038/79936. [DOI] [PubMed] [Google Scholar]
- 15.Pickles S., Vigié P., Youle R.J. Mitophagy and quality control mechanisms in mitochondrial maintenance. Curr. Biol. 2018;28:R170–R185. doi: 10.1016/j.cub.2018.01.004. [DOI] [PMC free article] [PubMed] [Google Scholar]
- 16.Palikaras K., Lionaki E., Tavernarakis N. Mechanisms of mitophagy in cellular homeostasis, physiology and pathology. Nat. Cell Biol. 2018;20:1013–1022. doi: 10.1038/s41556-018-0176-2. [DOI] [PubMed] [Google Scholar]
- 17.Park S., Lee S.H.S., Lee W.I., Choi R., Kim S.W., Woo H.N., Lee H. MicroRNA expression profiling of adult hippocampal neural stem cells upon cell death reveals an autophagic cell death-like pattern. Biochem. Biophys. Res. Commun. 2019;509:674–679. doi: 10.1016/j.bbrc.2018.12.157. [DOI] [PubMed] [Google Scholar]
- 18.Nowak J.S., Michlewski G. miRNAs in development and pathogenesis of the nervous system. Biochem. Soc. Trans. 2013;41:815–820. doi: 10.1042/BST20130044. [DOI] [PubMed] [Google Scholar]
- 19.Saotome M., Safiulina D., Szabadkai G., Das S., Fransson A., Aspenstrom P., Rizzuto R., Hajnóczky G. Bidirectional Ca2+-dependent control of mitochondrial dynamics by the Miro GTPase. Proc. Natl. Acad. Sci. USA. 2008;105:20728–20733. doi: 10.1073/pnas.0808953105. [DOI] [PMC free article] [PubMed] [Google Scholar]
- 20.Shlevkov E., Kramer T., Schapansky J., LaVoie M.J., Schwarz T.L. Miro phosphorylation sites regulate Parkin recruitment and mitochondrial motility. Proc. Natl. Acad. Sci. USA. 2016;113:E6097–E6106. doi: 10.1073/pnas.1612283113. [DOI] [PMC free article] [PubMed] [Google Scholar]
- 21.Grossmann D., Berenguer-Escuder C., Bellet M.E., Scheibner D., Bohler J., Massart F., Rapaport D., Skupin A., Fouquier d’Hérouël A. Mutations in RHOT1 disrupt endoplasmic reticulum-mitochondria contact sites interfering with calcium homeostasis and mitochondrial dynamics in Parkinson’s disease. Antioxid. Redox Signal. 2019;31:1213–1234. doi: 10.1089/ars.2018.7718. [DOI] [PMC free article] [PubMed] [Google Scholar]
- 22.Kimura S., Noda T., Yoshimori T. Dissection of the autophagosome maturation process by a novel reporter protein, tandem fluorescent-tagged LC3. Autophagy. 2007;3:452–460. doi: 10.4161/auto.4451. [DOI] [PubMed] [Google Scholar]
- 23.Klionsky D.J., Abeliovich H., Agostinis P., Agrawal D.K., Aliev G., Askew D.S., Baba M., Baehrecke E.H., Bahr B.A., Ballabio A. Guidelines for the use and interpretation of assays for monitoring autophagy in higher eukaryotes. Autophagy. 2008;4:151–175. doi: 10.4161/auto.5338. [DOI] [PMC free article] [PubMed] [Google Scholar]
- 24.Cassidy-Stone A., Chipuk J.E., Ingerman E., Song C., Yoo C., Kuwana T., Kurth M.J., Shaw J.T., Hinshaw J.E., Green D.R., Nunnari J. Chemical inhibition of the mitochondrial division dynamin reveals its role in Bax/Bak-dependent mitochondrial outer membrane permeabilization. Dev. Cell. 2008;14:193–204. doi: 10.1016/j.devcel.2007.11.019. [DOI] [PMC free article] [PubMed] [Google Scholar]
- 25.Sahay A., Scobie K.N., Hill A.S., O’Carroll C.M., Kheirbek M.A., Burghardt N.S., Fenton A.A., Dranovsky A., Hen R. Increasing adult hippocampal neurogenesis is sufficient to improve pattern separation. Nature. 2011;472:466–470. doi: 10.1038/nature09817. [DOI] [PMC free article] [PubMed] [Google Scholar]
- 26.Anacker C., Hen R. Adult hippocampal neurogenesis and cognitive flexibility—linking memory and mood. Nat. Rev. Neurosci. 2017;18:335–346. doi: 10.1038/nrn.2017.45. [DOI] [PMC free article] [PubMed] [Google Scholar]
- 27.Nemani N., Carvalho E., Tomar D., Dong Z., Ketschek A., Breves S.L., Jaña F., Worth A.M., Heffler J., Palaniappan P. MIRO-1 determines mitochondrial shape transition upon GPCR activation and Ca2+ stress. Cell Rep. 2018;23:1005–1019. doi: 10.1016/j.celrep.2018.03.098. [DOI] [PMC free article] [PubMed] [Google Scholar]
- 28.Ding L., Lei Y., Han Y., Li Y., Ji X., Liu L. Vimar is a novel regulator of mitochondrial fission through Miro. PLoS Genet. 2016;12:e1006359. doi: 10.1371/journal.pgen.1006359. [DOI] [PMC free article] [PubMed] [Google Scholar]
- 29.López-Doménech G., Covill-Cooke C., Ivankovic D., Halff E.F., Sheehan D.F., Norkett R., Birsa N., Kittler J.T. Miro proteins coordinate microtubule- and actin-dependent mitochondrial transport and distribution. EMBO J. 2018;37:321–336. doi: 10.15252/embj.201696380. [DOI] [PMC free article] [PubMed] [Google Scholar]
- 30.Okumoto K., Ono T., Toyama R., Shimomura A., Nagata A., Fujiki Y. New splicing variants of mitochondrial Rho GTPase-1 (Miro1) transport peroxisomes. J. Cell Biol. 2018;217:619–633. doi: 10.1083/jcb.201708122. [DOI] [PMC free article] [PubMed] [Google Scholar]
- 31.Castro I.G., Richards D.M., Metz J., Costello J.L., Passmore J.B., Schrader T.A., Gouveia A., Ribeiro D., Schrader M. A role for mitochondrial Rho GTPase 1 (MIRO1) in motility and membrane dynamics of peroxisomes. Traffic. 2018;19:229–242. doi: 10.1111/tra.12549. [DOI] [PMC free article] [PubMed] [Google Scholar]
- 32.Shen H.M., Codogno P. Autophagic cell death: Loch Ness monster or endangered species? Autophagy. 2011;7:457–465. doi: 10.4161/auto.7.5.14226. [DOI] [PubMed] [Google Scholar]
- 33.Kazlauskaite A., Kelly V., Johnson C., Baillie C., Hastie C.J., Peggie M., Macartney T., Woodroof H.I., Alessi D.R., Pedrioli P.G., Muqit M.M. Phosphorylation of Parkin at Serine65 is essential for activation: elaboration of a Miro1 substrate-based assay of Parkin E3 ligase activity. Open Biol. 2014;4:130213. doi: 10.1098/rsob.130213. [DOI] [PMC free article] [PubMed] [Google Scholar]
- 34.Safiulina D., Kuum M., Choubey V., Gogichaishvili N., Liiv J., Hickey M.A., Cagalinec M., Mandel M., Zeb A., Liiv M., Kaasik A. Miro proteins prime mitochondria for Parkin translocation and mitophagy. EMBO J. 2019;38:e99384. doi: 10.15252/embj.201899384. [DOI] [PMC free article] [PubMed] [Google Scholar]
- 35.Rajman M., Schratt G. MicroRNAs in neural development: from master regulators to fine-tuners. Development. 2017;144:2310–2322. doi: 10.1242/dev.144337. [DOI] [PubMed] [Google Scholar]
- 36.Zhao C., Sun G., Li S., Shi Y. A feedback regulatory loop involving microRNA-9 and nuclear receptor TLX in neural stem cell fate determination. Nat. Struct. Mol. Biol. 2009;16:365–371. doi: 10.1038/nsmb.1576. [DOI] [PMC free article] [PubMed] [Google Scholar]
- 37.Han J., Kim H.J., Schafer S.T., Paquola A., Clemenson G.D., Toda T., Oh J., Pankonin A.R., Lee B.S., Johnston S.T. Functional implications of miR-19 in the migration of newborn neurons in the adult brain. Neuron. 2016;91:79–89. doi: 10.1016/j.neuron.2016.05.034. [DOI] [PubMed] [Google Scholar]
- 38.Cheng L.-C., Pastrana E., Tavazoie M., Doetsch F. miR-124 regulates adult neurogenesis in the subventricular zone stem cell niche. Nat. Neurosci. 2009;12:399–408. doi: 10.1038/nn.2294. [DOI] [PMC free article] [PubMed] [Google Scholar]
- 39.Han J., Sarkar A., Gage F.H. MIR137: big impacts from small changes. Nat. Neurosci. 2015;18:931–933. doi: 10.1038/nn.4045. [DOI] [PubMed] [Google Scholar]
Associated Data
This section collects any data citations, data availability statements, or supplementary materials included in this article.