

Abstract
Histone deacetylases (HDACs) are epigenetic modulators linked to diseases including cancer and neurodegeneration. Given their therapeutic potential, highly sensitive biochemical and cell-based profiling technologies have been developed to discover small molecule HDAC inhibitors. Ultimately, the therapeutic action of these inhibitors is dependent on a physical engagement with their intended targets in cellular and tissue environments. Confirming target engagement in the cellular environment is particularly relevant for HDACs since they function as part of cell type-specific multiprotein complexes. Here we implemented two recently developed high-throughput target engagement technologies, NanoBRET and SplitLuc CETSA, to profile 349 compounds in the Epigenetic-Focused collection for HDAC1 binding. We found the two HDAC1 target engagement assays correlated well with each other and with orthogonal activity-based assays, in particular those carried out in cellular environments rather than with isolated HDAC proteins. The assays detected a majority of the previously described HDAC1 inhibitors in the collection and, importantly, triaged HDAC inhibitors known to target other HDACs.
Keywords: HDAC1, qHTS, profiling, SplitLuc CETSA, NanoBRET, epigenetic compound library, target engagement
Introduction
Histone deacetylase (HDACs) enzymes catalyze the removal of the acetyl group from ε-N-acetyl lysine residues on histones and non-histone proteins. Human HDACs are classified into two major groups based on homology and mechanism of action1. The first group comprises the class I (HDAC1–3 and 8), class IIa (HDAC4, 5, 7 and 9), class IIb (HDAC6 and 10) and class IV (HDAC11) enzymes, which require Zn2+ for catalytic activity. The second group comprises class III enzymes, called Sirtuins (SIRT1–7), which require nicotinamide adenine dinucleotide (NAD+) as a co-substrate. HDACs form the catalytic core of large protein complexes involved in chromatin remodeling and are considered important epigenetic factors. Deacetylation of histones by HDAC action leads to chromatin condensation and repression of gene expression1. Importantly, aberrant HDAC expression has been implicated in various diseases, including several cancer types as well as various neurologic and neurodegenerative disorders2–5. Therefore, the development of HDAC inhibitors has been an intensive area of research for the past two decades4, 6. The majority of HDAC inhibitors lack selectivity and target all HDACs (pan-inhibitors) or a subset of HDACs (class-selective inhibitors). To date, there are five FDA-approved HDAC inhibitors: the pan-inhibitors Vorinostat (SAHA), Belinostat and Panobinostat, and the class I inhibitor Romidepsin, for cancer indications (cutaneous T cell lymphoma and multiple myeloma); and the class I and IIa inhibitor Valproic acid, for neurological disorders (migraine, epilepsy, and bipolar disorder). The development of isoform-selective inhibitors is of great interest, not only as chemical tools for dissecting the roles of specific HDACs, but also as potential therapeutics with limited side effects. Although challenging, several isoform-selective HDAC inhibitors, mainly targeting HDAC6, have recently been described7–9.
Multiple high-throughput profiling technologies have been developed to discover and characterize HDAC inhibitors10, 11. Highly sensitive biochemical assays are amenable to large compound library screens and can be used to determine compound potency and selectivity across a panel of HDAC proteins. Biochemical assays typically rely on purified HDACs (or HDAC fragments) and isolated histone substrates (small peptides, histones, nucleosomes). Multiple detection formats are available including mass-spectrometry, lysine-specific antibodies and protease-coupled assays with fluorogenic or luminescent peptide substrates, to name a few. However, biochemical assays do not assess HDACs in their native multiprotein complexes. To this end, cell-based technologies have been developed to discover and characterize HDAC inhibitors in native environments. Two commonly used approaches are antibody-based assays to detect endogenous levels of acetylated lysine residues in intact cells or cell lysates (such as ELISA, AlphaLISA, LANCE, and high-content imaging) and cell-permeable fluorogenic or luminogenic HDAC substrates10, 11. While high-throughput, these assays are confounded by a myriad of indirect effects. More recently, mass-spectrometry based thermal profiling and chemoproteomic studies have been implemented to characterize HDAC inhibitor potency and selectivity in cells. These studies have not only identified off-targets, but also demonstrated that the target engagement profile for HDAC inhibitors is different in a cellular context compared to isolated recombinant enzymes12, 13. Although powerful, mass spectrometry-based proteomic profiling assays are not amenable to the characterization of large number of inhibitors. Two high-throughput amenable methods for assessing HDAC engagement in cells have been recently reported: SplitLuc CETSA, a cellular thermal shift assay (CETSA) that detects compound-mediated thermal stabilization of targets using a split Nano Luciferase (NanoLuc) approach14 and NanoBRET, a commercially available assay that utilizes a fluorescent probe which is detected when in close proximity to a NanoLuc-labeled HDAC15. Although amenable to high-throughput settings, to our knowledge, these methods have not been applied to the profiling of large compound collections for HDAC binding. Here, we applied SplitLuc CETSA and NanoBRET assays to characterize HDAC target engagement using a collection of 349 small molecules enriched for epigenetic modulators. We focused on the class I member HDAC1 because of its therapeutic potential16–19 and availability of high-throughput assays14, 15, 20. We compared the HDAC1 target engagement results with biochemical and cell-based HDAC1 activity assays using a luminogenic peptide, as well as phenotypic cell viability assays.
Materials and Methods
Compounds:
The Epigenetic-Focused compound collection contains 349 both clinical and pre-clinical-stage compounds that inhibit one or more epigenetic factor as well as non-epigenetic controls (Supplementary Table 1). Annotated HDAC inhibitors that show no activity in HDAC-Glo I/II assays were subjected to quality control by LC/UV, LC/MS, or Hi-res MS. All compounds exhibited >90% purity by peak area or m/z.
Cell lines and culture conditions:
HEK293T and HeLa cells were obtained from ATCC (CRL-1573 and CCL2, respectively). HEK293T and HeLa cells were cultured in DMEM (4.5 g/L glucose; ThermoFisher) supplemented with 10% fetal bovine serum (FBS; Hyclone, GE), 6 mM L-glutamine, 1 mM sodium pyruvate, 50 U/mL penicillin, and 50 μg/mL streptomycin (ThermoFisher). All cells were grown at 37 °C in a humidified incubator maintained at 5% CO2 and tested bimonthly for mycoplasma using a MycoAlert detection kit (Lonza).
HDAC-Glo I/II enzymatic assay:
Recombinant human HDAC1 enzyme was purchased from Reaction Biology (Cat# KDA-21–365) and mixed with the HDAC-Glo I/II Reaction Buffer at a final concentration of 10 nM. Three μL of enzyme solution were dispensed into Greiner 1536-well solid white medium-binding plates using the BioRaptr Workstation (Beckman). Twenty-three nL of compounds and controls (neutral control DMSO or positive control Panobinostat at final concentration of 46 μM; final DMSO concentration of 0.38 %) were subsequently transferred via pintool (Wako Automation) and plates were incubated for 15 minutes at room temperature. Three μL/well of HDAC-Glo I/II Reagent activated with Developer Reagents as per manufacturer’s instructions (Promega) were dispensed into the plates and after a 30 minutes incubation at room temperature, luminescence intensity was measured using a ViewLux High-throughput CCD imager (PerkinElmer) equipped with clear filters.
HDAC-Glo I/II cellular assay:
Five μL/well of HEK293T or HeLa cells in growth media were seeded into Greiner 1536-well solid TC treated plates at a density of 2×10⁵ cells/mL. Following an overnight incubation to allow cell attachment, 23 nL of compound and controls (neutral control DMSO or positive control Panobinostat at final concentration of 27 μM; final DMSO concentration of 0.46 %) were delivered via pintool transfer. The assay plates were then incubated for 1 hour at 37 °C /5 % CO2 before 5 μL of HDAC-Glo I/II Reagent activated with the Developer Reagent as per manufacturer’s instructions were added using the Multidrop Combi Dispenser (ThermoFisher). Luminescence intensity was measured using a ViewLux imager as above.
HDAC-Glo I/II counterscreens:
HDAC-Glo I/II coupled assay utilizes Ultra-Glo luciferase and ATP to quantify aminoluciferin substrate produced from the HDAC enzymatic reaction. The CellTiter-Glo (Promega) assay contains the same Ultra-Glo luciferase and a luciferin substrate but lacks ATP. To profile the effect of the compound collections on UltraGlo luciferase, three μL of CTG solution were dispensed into Greiner 1536-well solid white medium-binding plates using the BioRaptr Workstation. Twenty-three nL of compounds and controls (neutral control DMSO or positive control PTC124 at final concentration of 46 μM; final DMSO concentration of 0.57 %) were subsequently transferred via pintool (Wako Automation) and plates were incubated for 15 minutes at room temperature. One μL/well of an ATP solution in growth media (final concentration of 10 μM) were dispensed into the plates and after a 30 minutes incubation at room temperature, luminescence intensity was measured using a ViewLux High-throughput CCD imager (PerkinElmer) equipped with clear filters.
In addition to inhibition of luciferase activity, reduction in HDAC-Glo I/II signal could be attributed to acute compound-mediated cell death. To rule out assay artifacts due to acute cell death, we profiled the compound collection in a CellTiter-Glo cell viability assay as described below, with the difference that HEK293T cells were incubated with compounds for 1 hour, the same time frame of the HDAC-Glo I/II assay.
CellTiter-Glo viability assay:
Five μL/well of HEK293T or HeLa cells in growth media were seeded into Greiner 1536-well solid TC treated plates at a density of 1×10⁵ cells/mL using the Multidrop Combi Dispenser. Following a 5 hour incubation to allow cell attachment, 23 nL of compound and controls (neutral control DMSO or positive control Digitonin at final concentration of 27 μM; final DMSO concentration of 0.46 %) were delivered via pintool transfer. After a 72 hour incubation at 37°C and 5% CO2, 3 μL of Cell-Titer Glo Reagent (Promega) were added to each well and luminescence was measured using the ViewLux imager as above.
HDAC1–86b SplitLuc CETSA:
The HDAC1 open reading frame was cloned as an in frame fusion to 86b tag (C-term, GSVSGWRLFKKISGS) into the acceptor pcDNA3.1–86b C-terminal backbone using NheI/BamHI sites by PCR amplifying the coding region with InFusion compatible oligonucleotides, as described before. Primers used are Fw 5’-ACCCAAGCTGGCTAGCCACCATGGCGCAGACGCAGG-3’ and Rv 5’-AGCCACTCACGGATCCGGCCAACTTGACCTCCTCCT-3’. The source of DNA template was pDONR223_HDAC1_WT (Addgene, #82212). The fusion construct was sequenced and SplitLuc CETSA was performed as described. Briefly, cells were transfected in T75 flasks using a reverse transfection procedure, where 9 mL of OptiMEM containing Lipofectamine 2000-DNA complex (45 μL and 22.5 μg, respectively) was combined with 10 mL of cell suspension (1 × 10⁶ cells/mL, 10 million cells total). After 24 hours, cells were harvested by trypsinization and resuspended at a density of 3 × 10⁵ cells/mL. Cells were dispensed (5 μL cell/well) into 1,536-well white plates (Aurora, cyclic olefin polymer) using a Multidrop Combi. Following an overnight incubation at 37°C and 5% CO2, twenty-three nL of compounds or controls (neutral control DMSO or positive control Panobinostat at final concentration of 27 μM; final DMSO concentration of 0.46 %) were pinned and plates were incubated for 1 hour at 37 °C. Plates were heated at 49°C for 9 minutes using a heating block. One μL of 6% NP40 with 6x protease inhibitor cocktail was added per well, and plates were incubated for 15 minutes to allow cell lysis followed by addition of 3 μL 11S (final concentration 100 nM), 0.5X furimazine substrate, and 1x protease inhibitor cocktail. Plates were centrifuged and analyzed for luminescence intensity using a ViewLux reader.
Nano Luciferase counterscreen:
Artifacts of the SplitLuc CETSA and NanoBRET assay due to NanoLuc inhibition or 86b-11S complementation inhibition were assessed in a biochemical format as follows: 5 μL of growth media containing 86b (final concentration 0.5 nM) and 1x protease inhibitor were dispensed into Greiner 1536-well, white, TC treated assay plates using the Multidrop Combi. Twenty-three nL of compound and positive control (DMSO neutral control, Cilnidipine positive control, 39 μM final concentration; final DMSO concentration of 0.46 %) were pinned into the assay plates. Following a 15 minute incubation at room temperature, 1 μL of 6% NP40 with 1x protease inhibitor were dispensed into the plates using the Multidrop Combi. After a brief spin, 2 μL of 11S and furimazine (final concentrations 100 nM and 0.5x) in growth media containing 1x protease inhibitor were added. After a 5 minute incubation at room temperature, luminescence was measured using the ViewLux plate reader.
HDAC1 NanoBRET assay:
The NanoBRET Target Engagement HDAC Assay kit was purchased from Promega (Cat#N2170) and used as follows: HEK293T cells were reverse transfected as described above with the HDAC1-NanoLuc FL Fusion Vector. Briefly, 9 mL of Opti-MEM containing Lipofectamine 2000-DNA-DNA carrier complex (45 μL L2000, 2 μg HDAC1-NanoLuc FL Fusion Vector, and 20 μg DNA Carrier) was added to a T75 cell culture flask. Ten mL of HEK293T cells in suspension (1×10⁶ cells/mL) were then mixed and allowed to incubate for 24 hours at 37°C and 5% CO2. Cells were harvested and resuspended in phenol red-free Opti-MEM at a density of 2×10⁵ cells/mL, and 38 μL/well were dispensed into Corning 384-well, white, solid bottom, medium binding assay plates. The BioRaptr Workstation was then used to dispense 2 μL of 20X NanoBRET Tracer Reagent activated with Tracer Dilution Buffer at a 1:4 ratio, as per manufacturer’s instructions. Following a brief spin to ensure reagent mixing, the assay plates were pinned with 116 nL of compound and controls (DMSO neutral control, Panobinostat positive control, 29 μM final concentration; final DMSO concentration of 0.28 %) and incubated at 37°C and 5% CO2 for 2 hours before being equilibrated to room temperature for 15 minutes. The assay plates then received 20 μL of 3X Complete Substrate plus Inhibitor Solution (1:166 dilution of NanoBRET Nano-Glo Substrate plus 1:500 dilution of Extracellular NanoLuc Inhibitor in phenol red-free Opti-MEM assay medium). Following a brief spin to remove bubbles, a PHERAstar plate reader (BMG Labtech) equipped with the LUM 610 LP 450–48 module was used to measure the resulting emission wavelengths (donor emission 450 nm, acceptor emission 610 nm). The final BRET ratio was calculated by dividing the acceptor emission (610 nm) by the donor emission (450 nm).
Fluorescence counterscreen:
Artifacts of the NanoBRET assay due to intrinsic fluorescence in the 610 nm range were identified using the Tecan Infinite M1000 Pro. Forty μL of growth media were dispensed using the Multidrop Combi into Corning 384-well, white, solid bottom, medium binding assay plates, and 116 nL of compound were pinned into the plates (final DMSO concentration of 0.28 %). Wells were excited at 450 nm and scanned for emission every 10 nm from 500–750 nm to generate a full emission spectrum.
qHTS data analysis and statistics:
The screening data were analyzed using software developed internally. Data from each assay were normalized plate-wise to corresponding intra-plate controls as described previously. The same controls were also used for the calculation of the Z’ factor index for each assay. Supplementary Table 2 shows S:B, CV and Z’ values for all assays. Percent activity was derived and fitted to Hill equation using in‐house software (http://tripod.nih.gov/curvefit/). Concentration-response curves (CRCs) were classified as described previously and compounds exhibiting high-quality CRCs (class 1 and 2) were considered active21, 22. Additional activity cutoffs were applied as followed: SplitLuc CETSA and CTG –AUC>50; all other biochemical and cellular assays– AUC>100. Visual inspection of curves was also performed to ensure compounds meet the cutoffs. For each assay, AUC values for dose-response curves were normalized using the following equation: Z-score=[(AUC(cmp)-MEDIAN AUC(assay))/STANDARD DEVIATION AUC(assay)]23. Heatmaps and correlation plots were generated using TIBCO Spotfire 7.1.1 with the following parameters: unweighted pair-group method with arithmetic mean (UPGMA) clustering method, Euclidean distance and ordering method based on average value, and R2 values were calculated using determination coefficient. Venn diagrams were generated using jvenn24.
Results
Compound profiling in activity-based assays identifies HDAC1 inhibitors with cellular potency
To carry out a comparative analysis of target engagement for HDAC1, we expanded on the previously described NCATS Epigenetic-Focused small molecule collection14. The current collection contains a total of 349 small molecules, both commercially available, as well as developed in house, that have progressed through different stages of clinical and pre-clinical development (Supplementary Table 1). Of these, 251 reportedly target one or more epigenetic factors, 60 of which target HDACs of class I and/or II (Figure 1A and 1B). The remaining 98 compounds constitute controls. Specifically, 10 compounds are inactive analogs of some of the aforementioned inhibitors and 88 compounds target non-epigenetic proteins (Figure 1C). The rationale for these 88 controls is that several of the epigenetic inhibitors have dual activity against a non-epigenetic factor, for example dual HDAC and kinase inhibitors25. In fact, most of these 88 control compounds target kinases. Having these control compounds provides an opportunity to assign compound activity to a specific target class.
Figure 1. The NCATS Epigenetic-Focused collection.

(A) Composition of the Epigenetic-Focused collection. (B) Number of compounds that target epigenetic proteins based on target class. (C) Number of compounds in the control group that target non-epigenetic proteins or are inactive analogs of compounds in (B).
We first sought to profile the Epigenetic-Focused library in biochemical and cellular HDAC1 activity-based assays. For this purpose, we used the commercially available HDAC-Glo I/II assay (Promega). The assay uses an acetylated, cell permeable, luminogenic peptide substrate that can be deacetylated by the activity of HDAC class I and II enzymes. Deacetylation of the substrate is measured using a coupled enzymatic system that quantifies aminoluciferin. This assay is compatible with either purified enzymes, extracts or cells. To test the Epigenetic-Focused collection, we miniaturized the HDAC-Glo I/II assay for quantitative high-throughput screening (qHTS) in 1,536-well format as previously described20. Each compound was tested at 11 concentrations which allowed us to generate concentration-response curves (CRCs) directly from the screen. We then calculated Area Under the Curve (AUC) values26, 27, which take into account both compound potency and efficacy, and standardized them to Z-scores to identify compounds with robust bioactivity profiles (see Materials and Methods for analysis details and activity cutoffs). First, we profiled the library against purified human HDAC1 enzyme. This screen identified 47 compounds that inhibit HDAC1 activity. Excluding the BET bromodomain inhibitor RVX-208, the kinase inhibitor KW-2449, and the PARP inhibitor A-966492, all other hits were annotated HDAC inhibitors (Figure 2A and 2B). We then profiled compound activity in HEK293T cells. The luminogenic peptide used in the assay can be deacetylated by any class I and II HDACs, all of which, with the exception of HDAC9, are expressed in HEK293T cells28. We found 37 compounds inhibiting HDAC class I and II activity, with all compounds annotated as HDAC inhibitors (Figure 2A and 2B). The expression pattern of class I and II HDAC enzymes in HeLa cells is comparable to that of HEK293T cells, and compound profiling in HeLa cells using the HDAC-Glo I/II assay indicated a very good agreement of compound activity between cell types (R2=0.981, Figures 2A, 2B, and 2C). An analysis of the hit overlap indicated that most compounds active in the biochemical assay were also active in cells (Figure 2B). The most potent compounds were the hydroxamic acid-based derivatives CUDC-907, Quisinostat, Panobinostat, Wr-301801 and Dacinostat and the natural cyclopeptides, Apicidin and Trapoxin A (Supplementary Figure 1A, 1B). Nine compounds were considered active only in the HDAC1 enzymatic assay, which could be explained by poor cell permeability. These include the non-HDAC inhibitors mentioned above (RVX-208, KW-2449 and A-966492) and six HDAC inhibitors (MI 192, Entinostat, Chidamide, RG2833, TC-H-106 and Tacedinaline) displaying relatively weak activity (below the activity cutoff) in cellular assays. Conversely, only the prodrug PTACH, which requires intracellular activation, showed HDAC inhibition in cells but was inactive in the biochemical assay (Supplementary Figure 2A). Overall, compound activity was well correlated between biochemical and cell-based assays (R2=0.919, R2=0.943, Figure 2D and 2E). Altogether, the activity-based profiling of the Epigenetic-Focused collection indicated that out of the 60 annotated HDAC inhibitors, 45 possessed activity across all the biochemical and cellular HDAC-Glo I/II assays. The remaining 15 compounds either had weak inhibitory activity or did not show activity at all, even though they passed quality controls of purity and integrity. Among the inactive set were HDAC class IIa, HDAC6, and HDAC3-specific inhibitors which do not target HDAC1 and the broad inhibitors HNHA and Pyroximide (Figure 2A). Of note, none of the annotated HDAC class III (Sirtuin) inhibitors showed activity in any of the assays. To rule out assay artifacts that might arise due to luciferase inhibition in the coupled HDAC-Glo I/II assay, we profiled the library against a luciferase counter assay and found that none of the HDAC inhibitors identified above are artifacts (data not shown). Additionally, to rule out artifacts that might arise from compound-mediated acute cell death, we performed a cell viability assay using the CellTiter-Glo reagent, which measures total ATP levels as a proxy for viable cell number. We found that only 2 compounds, the kinase inhibitors SNS-34 and Cerdulatinib, reduced HEK293T cell viability during the 1 hour time course of the assay at the highest concentration tested of 45.8 μM (data not shown). Altogether, the profiling of the Epigenetic-Focus collection in HDAC1 activity-based assays identified HDAC inhibitors with cellular potency against HDAC1.
Figure 2. Compound profiling in HDAC1 activity-based assays.

(A) Heat map of HDAC inhibitor activity, clustered by Z-score of AUC, in biochemical and cellular HDAC-Glo I/II assays. All 60 HDAC inhibitors are shown. Z-score values are colored in a blue-grey gradient, with dark blue color indicating compounds that are more potent and efficacious. (B) Venn diagram of active compounds in activity-based HDAC1 assays. (C, D, E) Correlation plot of compound inhibitory activity (Z-score of AUC) in HEK293T vs. HeLa HDAC-Glo I/II cellular assays (C), biochemical vs. HEK293T HDAC-Glo I/II assays (D) or in biochemical vs. HeLa HDAC-Glo I/II assays (E). HDAC inhibitors are labeled grey and non-HDAC inhibitors, red. Dotted lines indicate activity cutoffs, with inactive compounds in both assays indicated with faded colors.
Compound profiling in target engagement assays identifies on-target HDAC1 inhibitors
After profiling the Epigenetic-Focused collection in activity-based assays, we sought to characterize HDAC1 engagement in the cellular environment. The first cell-based target engagement assay implemented for HDAC1 was SplitLuc CETSA. CETSA assays enable the detection of direct drug-target interactions by quantifying the changes in the thermal stability of proteins upon ligand binding in intact cells. We recently developed a homogeneous, standardized, target-independent and high-throughput CETSA platform that uses a split NanoLuc approach. In this platform, a 15-amino acid small fragment of NanoLuc (HiBiT variant, referred to as 86b) is appended to the target of interest and expressed in cells. Subsequent CETSA and addition of the complementing large fragment of NanoLuc allows for the detection of drug-bound thermally stable target. We have applied SplitLuc CETSA to C-terminal tagged HDAC1 (HDAC1–86b) in HEK293T cells and showed thermal stabilization of the target by the broad spectrum inhibitor Panobinostat as a proof of principle14. To test the Epigenetic-Focused collection, we miniaturized the HDAC1–86b SplitLuc CETSA assay for qHTS in 1,536-well format as previously described. Of the 349 compounds tested, 35 showed thermal stabilization (at 49°C) of HDAC1–86b. Importantly, all active compounds are annotated HDAC inhibitors, indicating that the assay did not detect any spurious activity (Figure 3A and 3B). Similar to activity-based assays, the most potent compounds were the hydroxamic acid-based derivatives CUDC-907, Quisinostat, Panobinostat, Wr-301801 and Dacinostat and the natural cyclopeptides Trapoxin A and Apicidin (Supplementary Figure 1C). HDACs are targeted to genes as part of multiprotein complexes, which may vary based on cell types29. HDAC1 in particular, has been shown to associate with the same protein complexes in HEK293T and HeLa cells30. We also performed SplitLuc CETSA in HeLa cells and, accordingly, a correlation plot indicated a strong agreement of compound activity in the two cell lines (R2=0.952, Figure 3B and 3C). The second cell-based HDAC1 target engagement assay implemented was a NanoBRET competition assay15. The assay utilizes a cell permeable fluorescent tracer derived from the broad HDAC inhibitor SAHA and a C-terminal HDAC1-NanoLuc fusion protein expressed in HEK293T cells. When in proximity, NanoLuc functions as a BRET donor and the tracer as a BRET acceptor. Intracellular target engagement of an inhibitor is then measured by competitive displacement of the tracer resulting in a loss of BRET signal. Our attempts to miniaturize the NanoBRET assay to 1,536-well format failed due to high sample variability (not shown), and hence the Epigenetic-Focused collection was tested at 11 concentration points in 384-well format (at a concentration range of 28.9 μM to 0.49 nM) as per the manufacturer’s instructions. We found that 40 compounds engaged HDAC1-NanoLuc as measured by displacement of the SAHA tracer (Figure 3A and 3B). Once again, the most potent compounds in the NanoBRET assay were the same set identified by activity-based assays and SplitLuc CETSA (Supplementary Figure 1D). All active compounds identified belong to the HDAC inhibitor class except SNS-314, an aurora kinase inhibitor (Figure 3A and Supplementary Figure 2B). Of note, SNS-314 was one of the hits in the HEK293T acute cell death assay. However, we observed acute cell death only when SNS-314 was tested at 45.8 μM (the highest dose achieved in the CellTiter-Glo assay). In contrast, SNS-314 induced loss of BRET signal at much lower concentrations, with an IC50 of 549 nM in the NanoBRET assay (Supplementary Figure 2B). Hence, SNS-31 was considered a hit in NanoBRET. A comparison of compound activity in HEK293T cells between SplitLuc CETSA and NanoBRET indicated that 35 compounds demonstrated HDAC1 engagement in both assays with good agreement in activity levels (R2=0.801; Figure 3B and 3D). NanoBRET was able to detect engagement of 5 additional compounds, which did not induce thermal stabilization in the SplitLuc CETSA assay. These include the above mentioned SNS-314, Nexturastat A, RG2833, SBHA and PTACH were either inactive or did not pass the activity cutoff in the SplitLuc CETSA (Supplementary Figure 2A–E; Supplementary Table 3).
Figure 3. Compound profiling in HDAC1 target engagement assays.
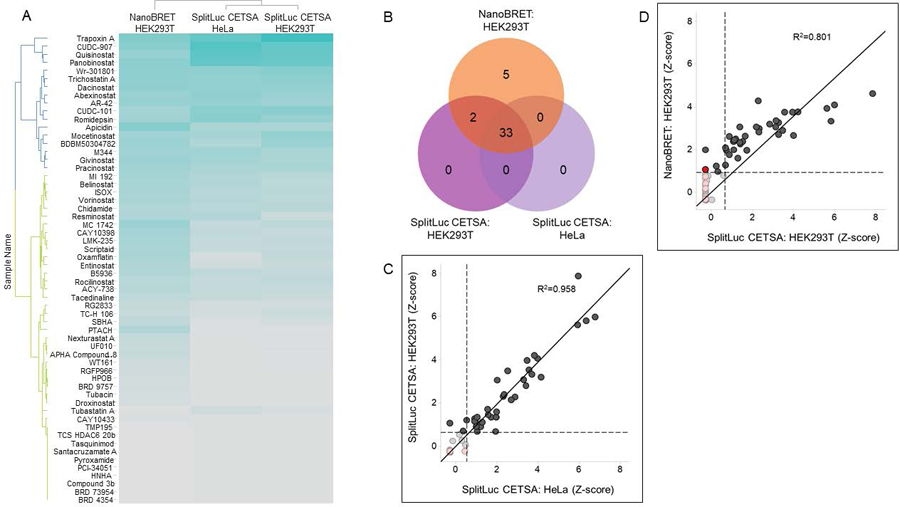
(A) Heat map of HDAC inhibitor activity, clustered by Z-score of AUC, in HDAC1 target engagement assays. All 60 HDAC inhibitors are shown. Z-score values are colored in a blue-grey gradient, with dark blue color indicating compounds that are more potent and efficacious. (B) Venn diagram of active compounds in HDAC1 target engagement assays. (C, D) Correlation plot of compound inhibitory activity (Z-score of AUC) in HEK293T vs. HeLa SplitLuc CETSA assays (C), and NanoBRET vs. SplitLuc CETSA HDAC1 target engagement assays in HEK293T cells (D). HDAC inhibitors are labeled grey and non-HDAC inhibitors, red. Dotted lines indicate activity cutoffs, with inactive compounds in both assays indicated with faded colors.
Overall, cellular target engagement assays correlated well with activity-based assays for HDAC1 indicating that the majority of HDAC inhibitors identified in activity-based assays are on-target (Figure 4A and 4B). However, for six compounds the outcome of activity-based assays does not overlap with either of the target engagement assays (Figure 4C). Of these, two compounds, the HDAC class I inhibitors APHA Compound 8 and TC-H 106, were active in the biochemical assay but were either inactive or did not pass the activity cutoff of any of the cellular assays. This could be explained by their low cellular potency (APHA Compound 8) and slow binding kinetics (TC-H 106)31, 32. The other four compounds, the HDAC Class I inhibitor UF 010, and the HDAC6-specific inhibitors Tubacin, WT161 and HPOB and displayed weak activity in all HDAC-Glo I/II based assays and did not pass the activity cutoff in target engagement studies. Similarly, the HDAC6-specific inhibitor Tubastatin A, displayed weak activity in both HDAC-Glo I/II based assays but was inactive in target engagement studies (Supplementary Figure 2F–K). Supplementary Table 3 displays the activity outcome of all annotated HDAC inhibitors in biochemical and HEK293T cellular assays in terms of AC50, % Efficacy and AUC. An analysis of inhibitor’s specificity indicated that compounds not targeting HDAC1 are for the most part inactive or have low potency/efficacy in all assays tested (Figure 4D). The exception is MI 192, a HDAC2/3 specific target with reported IC50 of 4.8 μM against isolated HDAC133. We found this compound to engage HDAC1 in cells and to be significantly more potent against HDAC1, with an IC50 of 0.08 μM in the enzymatic assay (Supplementary Figure 2L). We then used the activity outcome of annotated HDAC1 inhibitors, to calculate the sensitivity, specificity and accuracy of each assay (Supplementary Table 4). Accuracy was comparable between assays and the biochemical assay was the most sensitive and least specific of all. When comparing target engagement assays, NanoBRET was more sensitive but less specific than SplitLuc CETSA. Overall, both target engagement assays were able to identify the majority of HDAC1 inhibitors in the library, as defined by the profiling in activity-based assays, indicating these inhibitors act on target.
Figure 4. Comparison of HDAC1 activity-based and target engagement assays.

(A, B) Correlation plot of compound inhibitory activity (Z-score of AUC) in HEK293T HDAC-Glo I/II vs. NanoBRET (A) or SplitLuc CETSA (B). HDAC inhibitors are labeled grey and non-HDAC inhibitors, red. Dotted lines indicate activity cutoffs, with inactive compounds in both assays indicated with faded colors. (C) Venn diagram of active compounds in enzymatic and all HEK293T cellular assays. Only active HDAC inhibitors (45 compounds) are shown. (D) Activity plot (Z-score of AUC) of all 60 HDAC inhibitors in enzymatic and HEK293T cellular assays. HDAC inhibitors are divided into compounds previously reported to target HDAC1 (circles) and those that do not target HDAC1 (triangles). Dotted line represents the activity cutoff (calculated as the average cutoff between all four assays).
Target engagement assays as compound triaging strategies in drug discovery campaigns
To assess these target engagement assays in the context of de novo drug discovery campaigns, we tested a set of potential HDAC inhibitors previously identified by Hsu et al 20. Screening the NCATS Pharmaceutical Collection (NPC) of 2,527 small molecule drugs against the HDAC-Glo I/II assay in multiple cell lines, including HEK293T, the authors identified a set of potentially novel HDAC inhibitors. Based on availability, we selected 14 of these compounds, henceforward referred to as the “potential HDAC inhibitor set” (Table 1). The known SIRT inhibitors Resveratrol and Piceatannol were included in this set because they were not part of the Epigenetic-Focused collection. In accordance with Hsu et al., all compounds in the set were active in the HDAC1 biochemical HDAC-Glo I/II assay (passed the AUC activity cutoff as described in Materials and Methods; Table 1 and Supplementary Figure 4A). We first tested the potential HDAC inhibitor set in a luciferase counter assay to identify any luminescent artifacts that might interfere with the HDAC-Glo coupled assay as well as Nano Luciferase-based target engagement assays. Of the 14 compounds, we identified 5 compounds which showed Luciferase inhibition (Supplementary Figure 4B, Materials and Methods). Since the NanoBRET assay is also susceptible to fluorescent artifacts, we measured intrinsic fluorescence of the potential HDAC inhibitor set, and discovered that one compound, Daniquidone, showed both an increase in signal in the 610 nm channel read of the NanoBRET as well as fluorescence over the 500–750 nm range when excited at 450 nm (Supplementary Figure 4C and 4D). These compounds were removed from further analysis. None of the remaining compounds displayed stabilization of HDAC1 in the SplitLuc CETSA (Table 1, Supplementary Figure 4E), indicating a lack of cellular HDAC1 target engagement. Although the NanoBRET assay identified 4 compounds that appear to weakly engage HDAC1 (Table 1, Supplementary Figure 4F), including the serine protease inhibitors Camostat and Nafamostat, the anti-inflammatory Amlexanox, and the known HDAC inhibitor Resveratrol, none of these compounds passed the activity cutoffs. Moreover, of these 4 compounds, only Resveratrol is reported to inhibit HDAC1. In summary, the target engagement assays described here are useful assays to triage compounds in drug discovery campaigns.
Table 1.
The potential HDAC inhibitor set identified in Hsu et al. Compound’s primary and HDAC target as determined in Hsu et al. are indicated. Comparison of IC50 (μM) and efficacy (%) values of the potential HDAC inhibitor set in biochemical HDAC-Glo I/II, and HEK293T cellular SplitLuc CETSA and NanoBRET HDAC1 assays as determined in this study. Luciferase and fluorescence artifacts are noted where relevant. IC50 values are represented as average +/− standard deviation, n=2. MOA: mode of action. NA= non-applicable.
| Compound | MOA | HDAC target in Hsu et al. | Average IC50 ± SD [μM] (% Efficacy) | ||
|---|---|---|---|---|---|
| HDAC-Glo: HDAC1 | SplitLuc CETSA: HEK293T | NanoBRET: HEK293T | |||
| Albendazole | Tubulin depolymerization inhibitor | NA | 7.7 ± 0.8 (93%) | Luciferase inhibitor | |
| Daniquidone | Topoisomerase I/II inhibitor | NA | 2.1 ± 0.6 (92%) | Luciferase inhibitor* | |
| Ensulizole | Sunscreen agent | HDAC3 | 2.4 ± 0.3 (99%) | Luciferase inhibitor | |
| Nitazoxanide | Antiparasitic, PFOR inhibitor | HDAC1/2/4/5/6/7/8/9/10 | 5.1 ± 0.3 (95%) | Luciferase inhibitor | |
| Tenonitrozole | Antiprotozoal | NA | 1.7 ± 0.01 (93%) | Luciferase inhibitor | |
| Axitinib | Tyr Kinase inhibitor | HDAC2/6/8/9/10 | 3.0 ± 0.2 (90%) | Inactive | Inactive |
| Leflunomide | DHODH inhibitor | HDAC3 | 3.0 ± 0.2 (96%) | Inactive | Inactive |
| Niclosamide | Antiparasitic | HDAC1/5/7/9/10 | 2.8 ± 0.01 (99%) | Inactive | Inactive |
| Piceatannol | SIRT1 and Syk inhibitor | pan-HDAC | 3.9 ± 0.01 (97%) | Inactive | Inactive |
| Thiabendazole | Fungicide, Antiparasitic | NA | 3.8 ± 0.6 (90%) | Inactive | Inactive |
| Amlexanox | TBK1/IKK inhibitor | HDAC3/6/7/10 | 1.1 ± 0.01 (94%) | Inactive | 5.4 ± 0.6 (39%) |
| Camostat | Serine protease inhibitor | NA | 1.1 ± 0.1 (95%) | Inactive | 8.2 ± 1.4 (90%) |
| Nafamostat | Serine protease inhibitor | HDAC3/6/10 | 1.3 ± 0.1 (97%) | Inactive | 11.8 ± 2.9 (37%) |
| Resveratrol | SIRT and HDAC I/II inhibitor | HDAC1/2/6/8 | 1.5 ± 0.01 (95%) | Inactive | 7.0 ± 0.9 (46%) |
Fluorescent at 610 nm.
Compound profiling in phenotypic assays
HDAC inhibitors, as well as other epigenetic modulators, can regulate the expression of cell cycle and tumor suppressor genes in cancer and in some cases normal cells, leading to a reduction in cell proliferation. In addition, HDAC inhibitors can influence cell viability by activating multiple cell death pathways2, 4–6, 34. Therefore, to compare the HDAC1 target engagement results with a phenotypic viability readout, we profiled the Epigenetic-Focused collection using CellTiter-Glo. We found that 80 compounds, 39 of which are HDAC inhibitors, affect the viability of HEK293T cells. In the case of HeLa cells, 54 compounds reduce cell numbers, of which only 23 are annotated HDAC inhibitors. Activity in the cell viability assay correlates only moderately for the two cell lines (R2=0.622), indicating cell type-specific compound effects (Figure 5A). Importantly, the cell viability assay did not correlate well with HDAC1 activity-based or target engagement assays (Figure 5B and Supplementary Figure 3A–3C). This is not surprising, given that many epigenetic compounds could reduce cell proliferation via their intended target as well as via off-target mechanisms. However, when focusing only on annotated HDAC inhibitors, the correlation between phenotypic viability assays and target-based assays improved (Figure 5C and Supplementary Figure 3D–3F). This would indicate that on-target HDAC1 inhibition leads to effects in cellular proliferation.
Figure 5. Phenotypic cell viability outcomes do not correlate with HDAC1 activity-based or target engagement assays.

(A) Correlation plot of compound activity (Z-score of AUC) in HEK293T vs. HeLa cell viability assays. HDAC inhibitors are labeled grey and non-HDAC inhibitors, red. Dotted lines indicate activity cutoffs, with inactive compounds in both assays indicated with faded colors. (B) Heat map of HDAC inhibitor activity, clustered by Z-score of AUC, in phenotypic and HDAC1 HEK293T cellular assays. All 60 HDAC inhibitors are shown. Z-score values are colored in a blue-grey gradient, with dark blue color indicating compounds that are more potent and efficacious. (C) Correlation plot of HDAC inhibitor activity (Z-score of AUC) in cell viability of HEK293T and HeLa. Dotted lines indicate activity cutoffs, with inactive compounds in both assays indicated with faded colors.
Discussion
In this study, we performed a comparative analysis of target engagement assays for HDAC1 against the Epigenetic-Focused collection of 349 compounds. Characterization of the compound library against isolated HDAC1 enzyme identified most HDAC inhibitors in the collection; however, it also identified non-HDAC inhibitors as targeting HDAC1. In contrast, an activity-based cellular assay utilizing the same substrate as the biochemical assay identified only HDAC inhibitors, highlighting the importance of assaying HDAC activity in the native cellular environment. A limitation of the activity-based cellular assay, however, is the inability to attribute observed activity to a specific HDAC protein. Protein-specific target engagement assays circumvent this limitation. The two HDAC1 target engagement studies implemented here, NanoBRET and SplitLuc CETSA, utilize exogenously expressed tagged HDAC1 protein. Although the incorporation of tagged HDAC1 in native multiprotein complexes has not been verified in this study, both assays correlated well with each other and with activity-based assays and detected mostly annotated HDAC inhibitors. Importantly, most inactive HDAC inhibitors are those specifically targeting other HDACs, indicating the ability of these assays to pick up on-target interactions. Although NanoBRET is more sensitive than SplitLuc CETSA, as it identified four additional compounds, it also detected a non-HDAC inhibitor which might represent a false positive as this inhibitor did not affect HDAC1 enzymatic activity. These outcomes were also observed when we tested the set of potential HDAC inhibitors identified from the literature as NanoBRET only identified very weak activity of four compounds, only one of them validated as an HDAC1 inhibitor. One factor contributing to the difference in sensitivity between assays is likely the expression levels of tagged HDAC1. While both assays rely on transfection of a tagged HDAC1 reporter from the CMV promoter, NanoBRET requires 10 times less DNA than SplitLuc CETSA. In contrast to Split-Luc CETSA, our attempts to miniaturize the NanoBRET assay to 1,536-well format failed, which limited the throughput and increased the cost of the assay. One additional factor contributing to the difference between NanoBRET and SplitLuc CETSA outcomes is the potential of compounds to bind and inhibit HDAC1 without triggering thermal stabilization.
Finally, a comparison of activity-based and target engagement to phenotypic viability assays indicated a poor to moderate correlation between assays. This could be explained in part by the fact that epigenetic modifications lead to gene expression changes that might take a long time to manifest into quantifiable changes in cell proliferation/viability, which in turn might not be captured within the 72 hour of compound exposure during our viability assay. However, when focusing on the set of annotated HDAC inhibitors, compound activity correlation between assays improved, suggesting that at least for HDAC1, compounds that faithfully inhibit enzymatic activity lead to reduced cell numbers.
To our knowledge, this is the first comparative study of HDAC1 target engagement for a compound collection of this size. From the perspective of a drug discovery campaign, our study suggests that both target engagements assays are suitable and have enough throughput to be used as validation screens. For example, an activity-based assay could be used to screen large compound collections, followed by SplitLuc CETSA or NanoBRET as validation of target engagement. Our study indicates that both NanoBRET and SplitLuc CETSA are able to identify relevant, on-target HDAC1-inhibitor interactions. Both assays will prove valuable to the discovery of HDAC1-specific inhibitors, which to date, have not been described. In the future, it will be interesting to compare these two technologies for other epigenetic and non-epigenetic targets.
Supplementary Material
Acknowledgements
We thank Carleen Klumpp-Thomas and Jamie Travers for assistance with assay automation, NCATS’ compound management group for sourcing, quality control, formatting, and plating all compounds; Kelli Wilson and Jacob Roth for assistance with Spotfire analysis and Hui Guo for data loading.
Funding
This work was supported by the intramural research program of the National Center for Advancing Translational Sciences (NCATS), National Institutes of Health (NIH).
Footnotes
Conflict of Interest
The authors declare no conflicts of interest.
References
- 1.Yang XJ; Seto E The Rpd3/Hda1 family of lysine deacetylases: from bacteria and yeast to mice and men. Nat Rev Mol Cell Biol 2008, 9, 206–18. [DOI] [PMC free article] [PubMed] [Google Scholar]
- 2.Li Y; Seto E HDACs and HDAC Inhibitors in Cancer Development and Therapy. Cold Spring Harb Perspect Med 2016, 6, a026831. [DOI] [PMC free article] [PubMed] [Google Scholar]
- 3.Chuang DM; Leng Y; Marinova Z; et al. Multiple roles of HDAC inhibition in neurodegenerative conditions. Trends Neurosci 2009, 32, 591–601. [DOI] [PMC free article] [PubMed] [Google Scholar]
- 4.Falkenberg KJ; Johnstone RW Histone deacetylases and their inhibitors in cancer, neurological diseases and immune disorders. Nat Rev Drug Discov 2014, 13, 673–91. [DOI] [PubMed] [Google Scholar]
- 5.Haberland M; Montgomery RL; Olson EN The many roles of histone deacetylases in development and physiology: implications for disease and therapy. Nat Rev Genet 2009, 10, 32–42. [DOI] [PMC free article] [PubMed] [Google Scholar]
- 6.West AC; Johnstone RW New and emerging HDAC inhibitors for cancer treatment. J Clin Invest 2014, 124, 30–9. [DOI] [PMC free article] [PubMed] [Google Scholar]
- 7.Faria Freitas M; Cuendet M; Bertrand P HDAC inhibitors: a 2013–2017 patent survey. Expert Opin Ther Pat 2018, 1–17. [DOI] [PubMed] [Google Scholar]
- 8.Sultana F; Manasa KL; Shaik SP; et al. Zinc dependent Histone deacetylase inhibitors in cancer therapeutics: Recent update. Curr Med Chem 2018, 25, 1. [DOI] [PubMed] [Google Scholar]
- 9.Bieliauskas AV; Pflum MK Isoform-selective histone deacetylase inhibitors. Chem Soc Rev 2008, 37, 1402–13. [DOI] [PMC free article] [PubMed] [Google Scholar]
- 10.Howitz KT Screening and profiling assays for HDACs and sirtuins. Drug Discov Today Technol 2015, 18, 38–48. [DOI] [PubMed] [Google Scholar]
- 11.Liao D Profiling technologies for the identification and characterization of small-molecule histone deacetylase inhibitors. Drug Discov Today Technol 2015, 18, 24–8. [DOI] [PMC free article] [PubMed] [Google Scholar]
- 12.Bantscheff M; Hopf C; Savitski MM; et al. Chemoproteomics profiling of HDAC inhibitors reveals selective targeting of HDAC complexes. Nat Biotechnol 2011, 29, 255–65. [DOI] [PubMed] [Google Scholar]
- 13.Becher I; Werner T; Doce C; et al. Thermal profiling reveals phenylalanine hydroxylase as an off-target of panobinostat. Nat Chem Biol 2016, 12, 908–910. [DOI] [PubMed] [Google Scholar]
- 14.Martinez NJ; Asawa RR; Cyr MG; et al. A widely-applicable high-throughput cellular thermal shift assay (CETSA) using split Nano Luciferase. Sci Rep 2018, 8, 9472. [DOI] [PMC free article] [PubMed] [Google Scholar]
- 15.Robers MB; Dart ML; Woodroofe CC; et al. Target engagement and drug residence time can be observed in living cells with BRET. Nat Commun 2015, 6, 10091. [DOI] [PMC free article] [PubMed] [Google Scholar]
- 16.Weichert W HDAC expression and clinical prognosis in human malignancies. Cancer Lett 2009, 280, 168–76. [DOI] [PubMed] [Google Scholar]
- 17.Kawai H; Li H; Avraham S; et al. Overexpression of histone deacetylase HDAC1 modulates breast cancer progression by negative regulation of estrogen receptor alpha. Int J Cancer 2003, 107, 353–8. [DOI] [PubMed] [Google Scholar]
- 18.Ishihama K; Yamakawa M; Semba S; et al. Expression of HDAC1 and CBP/p300 in human colorectal carcinomas. J Clin Pathol 2007, 60, 1205–10. [DOI] [PMC free article] [PubMed] [Google Scholar]
- 19.Sudo T; Mimori K; Nishida N; et al. Histone deacetylase 1 expression in gastric cancer. Oncol Rep 2011, 26, 777–82. [DOI] [PubMed] [Google Scholar]
- 20.Hsu CW; Shou D; Huang RL; et al. Identification of HDAC Inhibitors Using a Cell-Based HDAC I/II Assay. J Biomol Screen 2016, 21, 643–652. [DOI] [PMC free article] [PubMed] [Google Scholar]
- 21.Seethala R; Zhang L Handbook of drug screening, Edn 2nd InformaHealthcare, New York: 2009. [Google Scholar]
- 22.Inglese J; Auld DS; Jadhav A; et al. Quantitative high-throughput screening: a titration-based approach that efficiently identifies biological activities in large chemical libraries. Proc Natl Acad Sci U S A 2006, 103, 11473–8. [DOI] [PMC free article] [PubMed] [Google Scholar]
- 23.Kreyszig E Advanced Engineering Mathematics. Wiley ISBN 0–471-02140–7 1979, Fourth edition, p. 880. [Google Scholar]
- 24.Bardou P; Mariette J; Escudie F; et al. jvenn: an interactive Venn diagram viewer. BMC Bioinformatics 2014, 15, 293. [DOI] [PMC free article] [PubMed] [Google Scholar]
- 25.Hesham HM; Lasheen DS; Abouzid KAM Chimeric HDAC inhibitors: Comprehensive review on the HDAC-based strategies developed to combat cancer. Med Res Rev 2018, 38, 2058–2109. [DOI] [PubMed] [Google Scholar]
- 26.Huang S; Pang L Comparing statistical methods for quantifying drug sensitivity based on in vitro dose-response assays. Assay Drug Dev Technol 2012, 10, 88–96. [DOI] [PubMed] [Google Scholar]
- 27.Guha R; Mathews Griner LA; Keller JM; et al. Ranking Differential Drug Activities from Dose-Response Synthetic Lethality Screens. J Biomol Screen 2016, 21, 942–55. [DOI] [PMC free article] [PubMed] [Google Scholar]
- 28.Thul PJ; Akesson L; Wiking M; et al. A subcellular map of the human proteome. Science 2017, 356, 6340. [DOI] [PubMed] [Google Scholar]
- 29.Delcuve GP; Khan DH; Davie JR Roles of histone deacetylases in epigenetic regulation: emerging paradigms from studies with inhibitors. Clin Epigenetics 2012, 4, 5. [DOI] [PMC free article] [PubMed] [Google Scholar]
- 30.Banks CAS; Miah S; Adams MK; et al. Differential HDAC1/2 network analysis reveals a role for prefoldin/CCT in HDAC1/2 complex assembly. Sci Rep 2018, 8, 13712. [DOI] [PMC free article] [PubMed] [Google Scholar]
- 31.Mai A; Massa S; Ragno R; et al. Binding mode analysis of 3-(4-benzoyl-1-methyl-1H-2-pyrrolyl)-N-hydroxy-2-propenamide: a new synthetic histone deacetylase inhibitor inducing histone hyperacetylation, growth inhibition, and terminal cell differentiation. J Med Chem 2002, 45, 1778–84. [DOI] [PubMed] [Google Scholar]
- 32.Chou CJ; Herman D; Gottesfeld JM Pimelic diphenylamide 106 is a slow, tight-binding inhibitor of class I histone deacetylases. J Biol Chem 2008, 283, 35402–9. [DOI] [PMC free article] [PubMed] [Google Scholar]
- 33.Boissinot M; Inman M; Hempshall A; et al. Induction of differentiation and apoptosis in leukaemic cell lines by the novel benzamide family histone deacetylase 2 and 3 inhibitor MI-192. Leuk Res 2012, 36, 1304–10. [DOI] [PubMed] [Google Scholar]
- 34.Eckschlager T; Plch J; Stiborova M; et al. Histone Deacetylase Inhibitors as Anticancer Drugs. Int J Mol Sci 2017, 18, 1414. [DOI] [PMC free article] [PubMed] [Google Scholar]
Associated Data
This section collects any data citations, data availability statements, or supplementary materials included in this article.