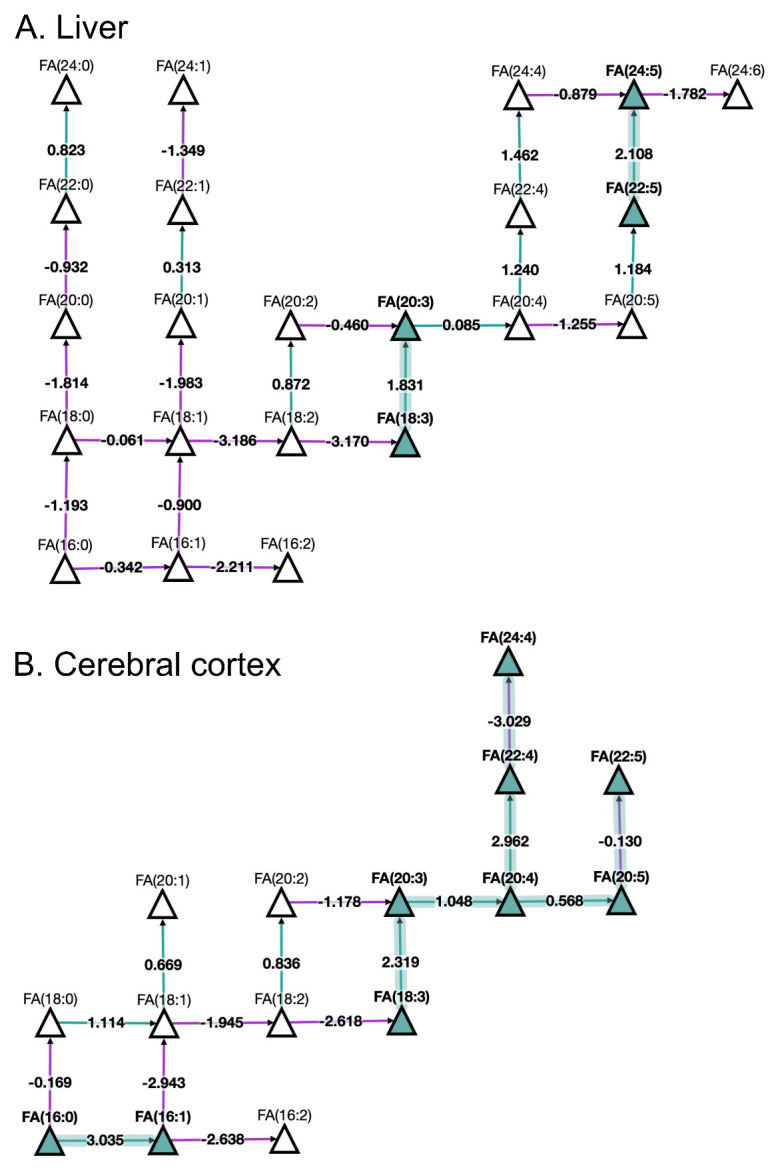
Figure 3. BioPAN fatty acids networks.

FA graphs exported from BioPAN tool for the liver ( A) and the cerebral cortex ( B) of aged mice compared to young mice 17 . Green nodes correspond to active lipids and green shaded arrows to active pathways. Reactions with a positive Z score have green arrows while negative Z scores are coloured purple. Pathways options: aged condition of interest, young control condition, lipid type, active status, subclass level, reaction subset of lipid data, p value 0.05, and no paired-data.
